| Param | Original file | Final file |
|---|---|---|
| Filename | modeM0/AS1A10_116T01_9000004082_28355cztM0_level2.evt | modeM0/AS1A10_116T01_9000004082_28355cztM0_level2_quad_clean.evt |
| Size (bytes) | 202,970,880 | 48,162,240 |
| Size | 193.6 MB | 45.9 MB |
| Events in quadrant A | 1,370,903 | 336,220 |
| Events in quadrant B | 1,160,822 | 350,017 |
| Events in quadrant C | 1,081,387 | 321,670 |
| Events in quadrant D | 2,386,819 | 295,549 |
| Mode M9 | |||
|---|---|---|---|
| Quadrant | BADHDUFLAG | Total packets | Discarded packets |
| A | 1 | 140042035239720 | 46 |
| B | 1 | -1 | -1 |
| C | 1 | -1 | -1 |
| D | 1 | -1 | -1 |
| Mode M0 | |||
|---|---|---|---|
| Quadrant | BADHDUFLAG | Total packets | Discarded packets |
| A | 0 | 5480 | 0 |
| B | 0 | 4851 | 0 |
| C | 0 | 4607 | 0 |
| D | 0 | 8546 | 0 |
| Quadrant | Total seconds | Saturated seconds | Saturation percentage |
|---|---|---|---|
| A | 2133 | 25 | 1.172058% |
| B | 2133 | 13 | 0.609470% |
| C | 2133 | 15 | 0.703235% |
| D | 2133 | 245 | 11.486170% |
Noise dominated data is calculated using 1-second bins in cleaned event files. If a bin has >2000 counts, and if more than 50% of those come from <1% of pixels, then it is considered to be noise-dominated and hence unusable.
| Quadrant | # 1 sec bins | Bins with >0 counts | Bins with >2000 counts | High rate bins dominated by noise | Noise dominated (total time) | Noise dominated (detector-on time) | Marked lightcurve |
|---|---|---|---|---|---|---|---|
| A | 2133 | 2133 | 28 | 28 | 1.31% | 1.31% | 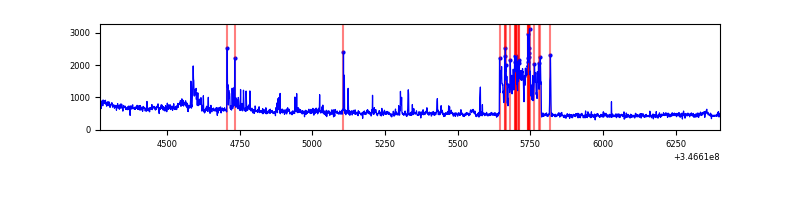 |
| B | 2133 | 2133 | 2 | 2 | 0.09% | 0.09% | 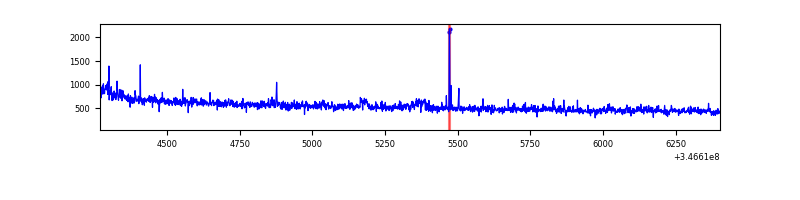 |
| C | 2133 | 2133 | 0 | 0 | 0.00% | 0.00% | 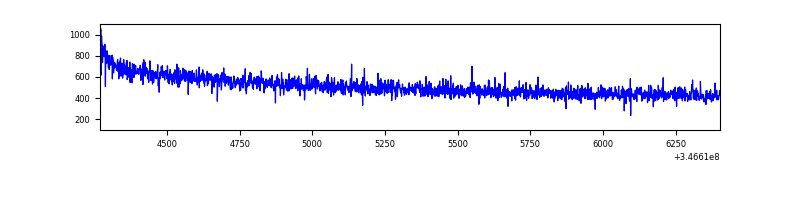 |
| D | 2133 | 2133 | 226 | 226 | 10.60% | 10.60% | 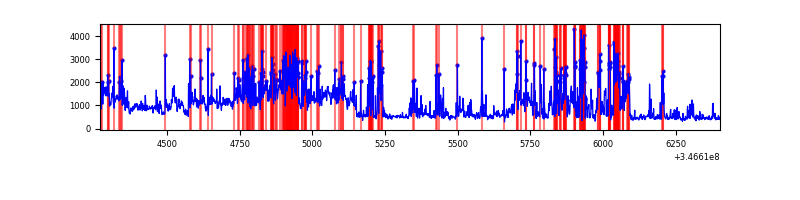 |
Top three noisy pixels from each quadrant. If the there are fewer than three noisy pixels in the level2.evt file, extra rows are filled as -1
| Pixel properties | Quadrant properties | ||||||
|---|---|---|---|---|---|---|---|
| Quadrant | DetID | PixID | Counts | Sigma | Mean | Median | Sigma |
| A | 15 | 174 | 240754 | 4170.9 | 285 | 281 | 57.7 |
| A | 12 | 96 | 28883 | 496.09 | 285 | 281 | 57.7 |
| A | 13 | 254 | 4068 | 65.68 | 285 | 281 | 57.7 |
| B | 0 | 230 | 12273 | 217.06 | 285 | 279 | 55.3 |
| B | 10 | 246 | 9710 | 170.67 | 285 | 279 | 55.3 |
| B | 12 | 0 | 8588 | 150.37 | 285 | 279 | 55.3 |
| C | 14 | 238 | 44399 | 697.61 | 266 | 268 | 63.3 |
| C | 13 | 61 | 1736 | 23.21 | 266 | 268 | 63.3 |
| C | 0 | 10 | 767 | 7.89 | 266 | 268 | 63.3 |
| D | 1 | 52 | 889830 | 14387.8 | 256 | 249 | 61.8 |
| D | 8 | 195 | 481474 | 7783.18 | 256 | 249 | 61.8 |
| D | 2 | 250 | 32878 | 527.73 | 256 | 249 | 61.8 |
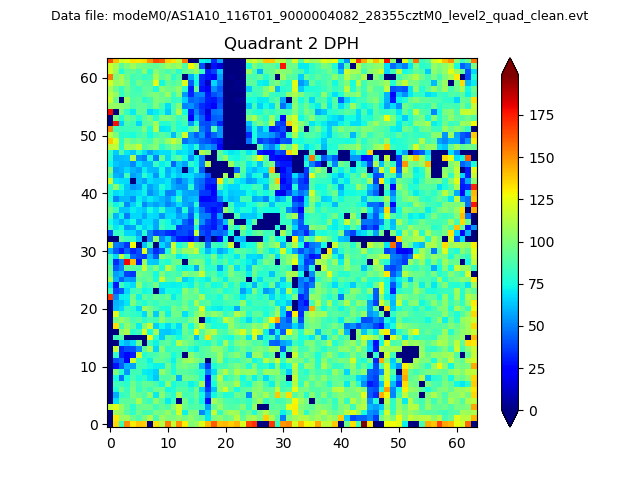
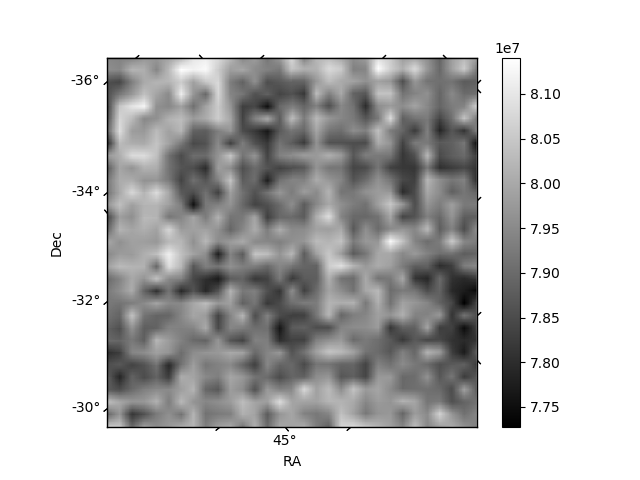
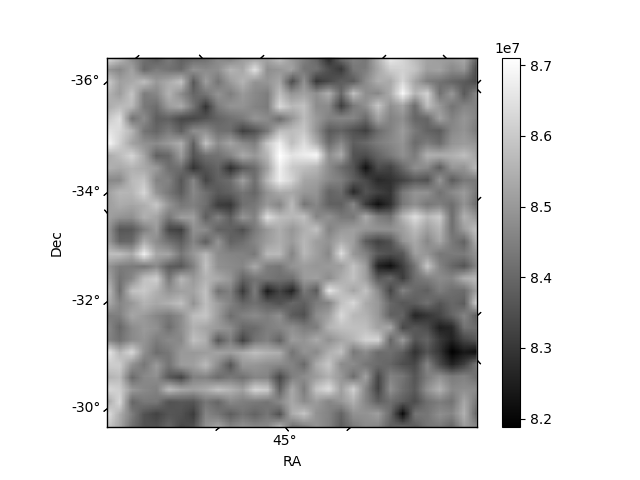
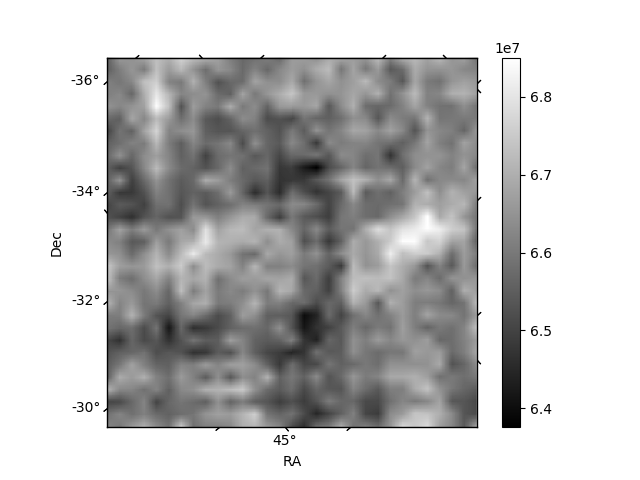
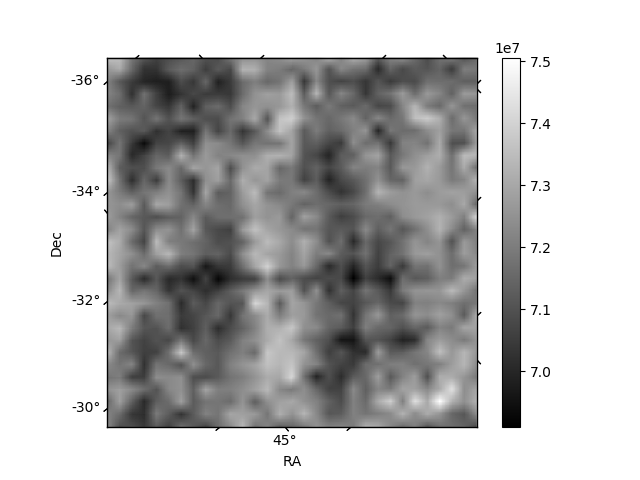
Histogram calculated using DETX and DETY for each event in the final _common_clean file
| Quadrant A | 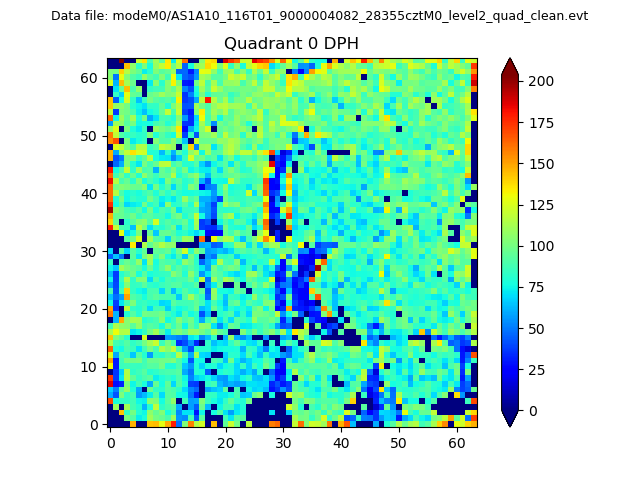 |
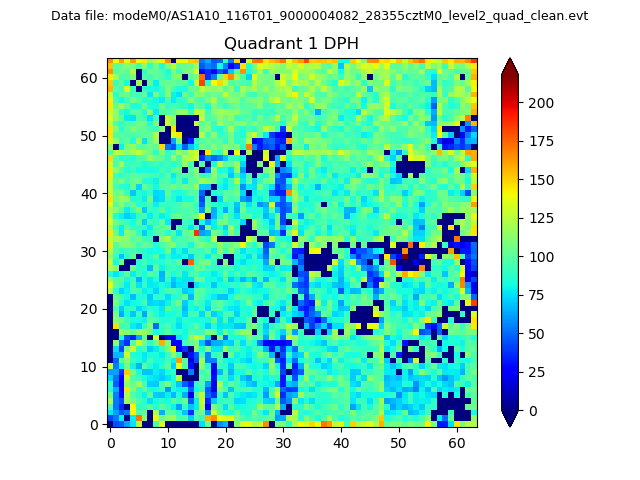 |
Quadrant B |
|---|---|---|---|
| Quadrant D | 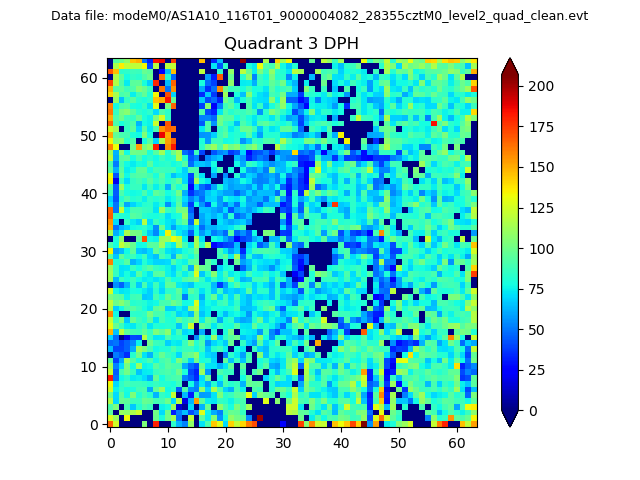 |
 |
Quadrant C |
| Plot type | Count rate plots | Images |
|---|---|---|
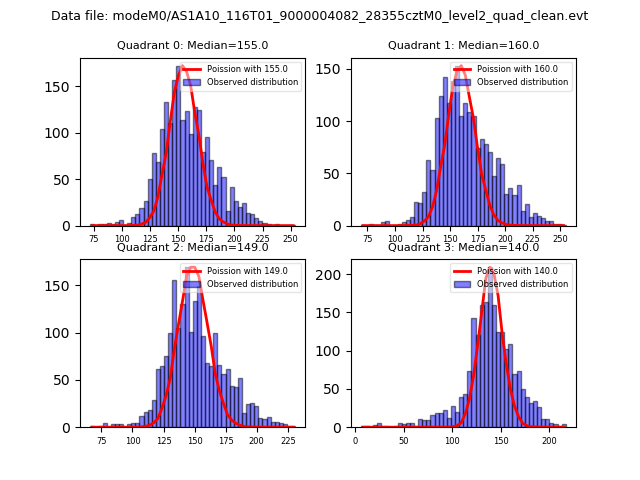
| Comparison with Poisson distribution Blue bars denote a histogram of data divided into 1 sec bins. Red curve is a Poisson curve with rate = median count rate of data. |
 |
 |
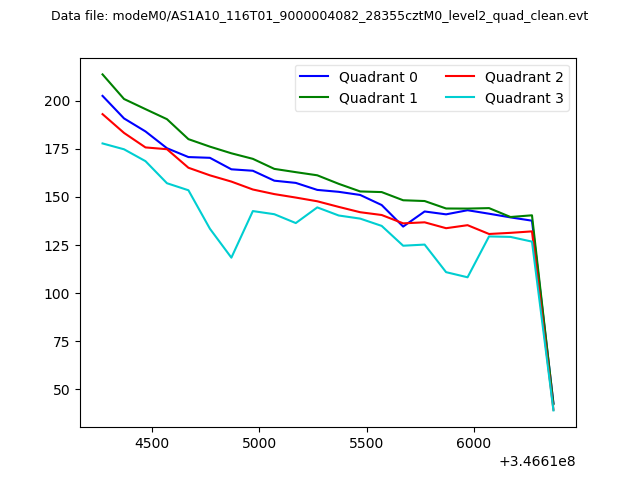
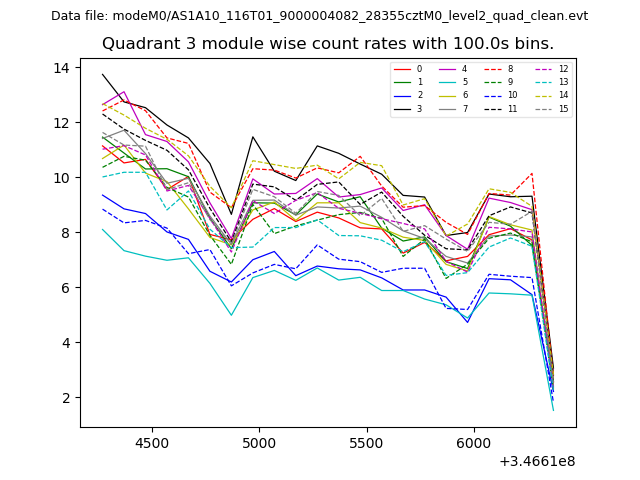
| Quadrant-wise count rates Data is divided into 100 sec bins |
 |
|
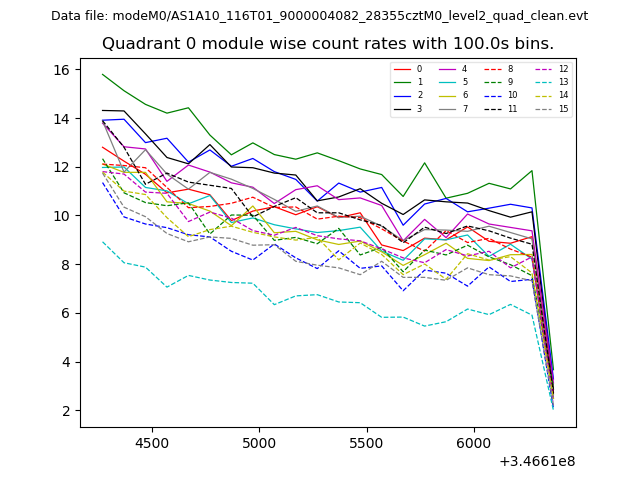
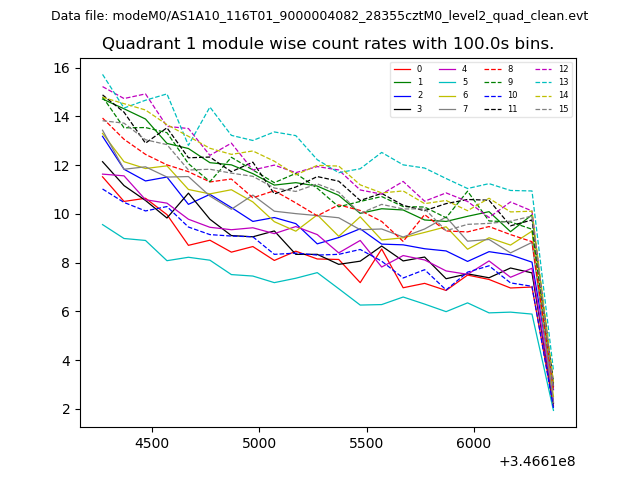
| Module-wise count rates for Quadrant A Data is divided into 100 sec bins |
 |
 |
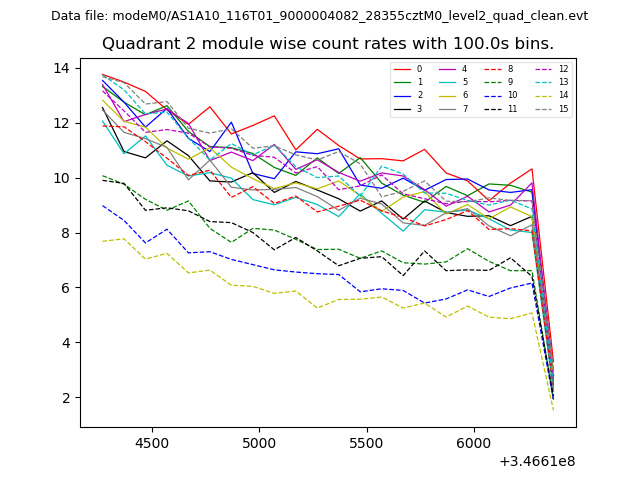
| Module-wise count rates for Quadrant B Data is divided into 100 sec bins |
 |
 |
| Module-wise count rates for Quadrant C Data is divided into 100 sec bins |
 |
 |
| Module-wise count rates for Quadrant D Data is divided into 100 sec bins |
 |
 |
| Parameter | Plot |
|---|---|
| CZT HV Monitor | 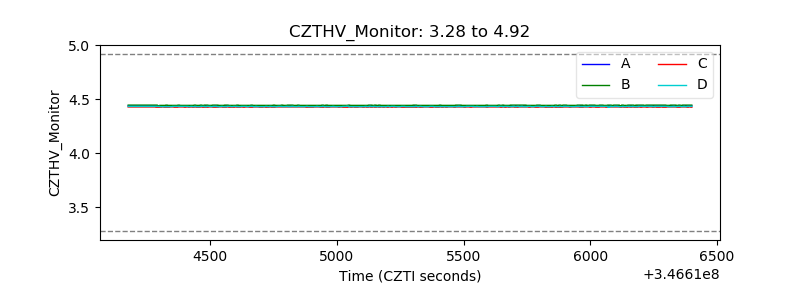 |
| D_VDD | 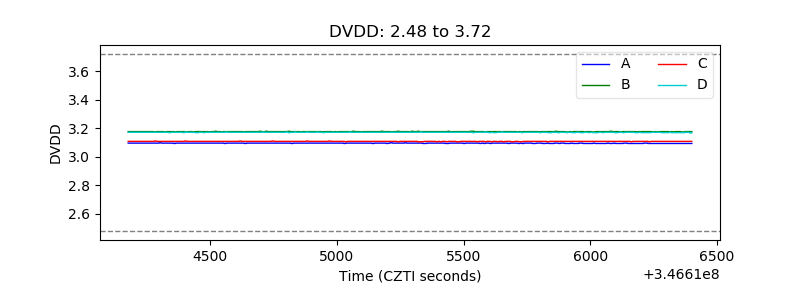 |
| Temperature 1 | 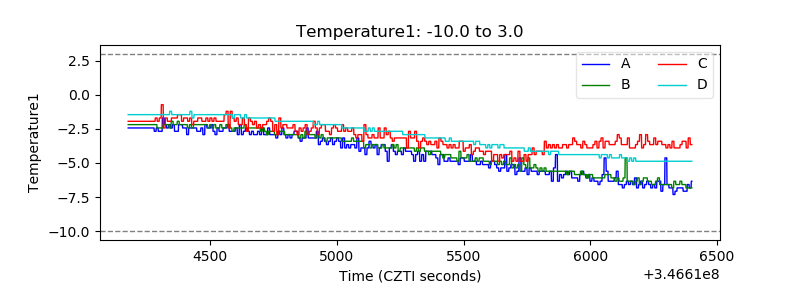 |
| Veto HV Monitor | 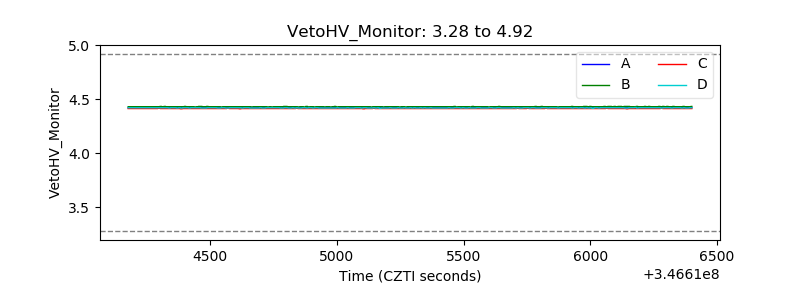 |
| Veto LLD | 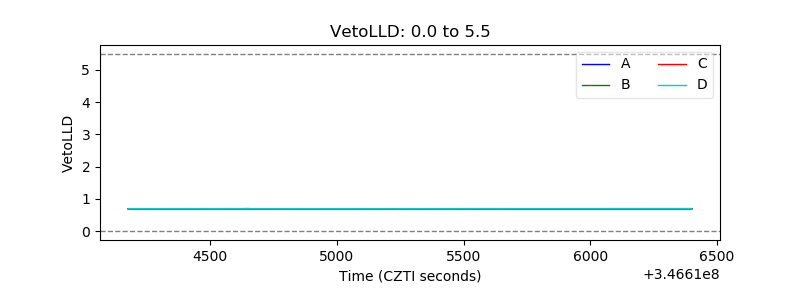 |
| Alpha Counter | 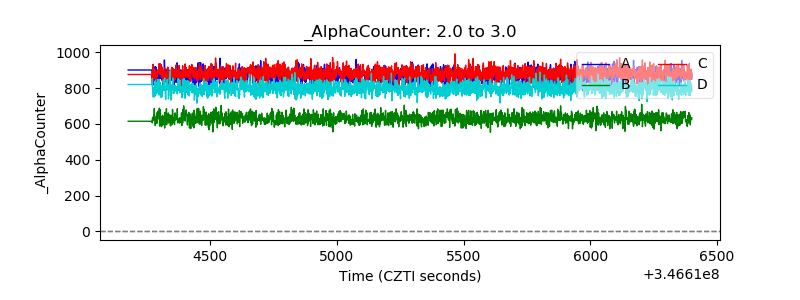 |
| _CPM_Rate | 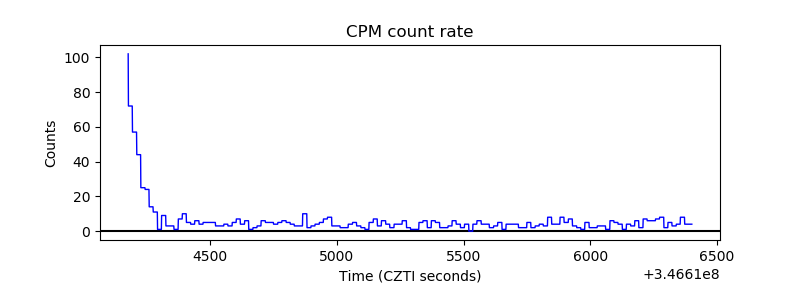 |
| CZT Counter | 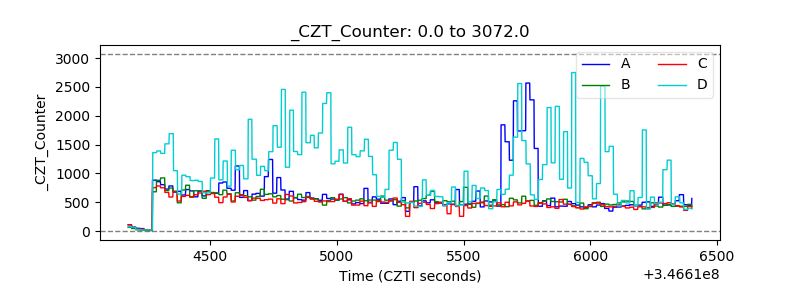 |
| +2.5 Volts monitor | 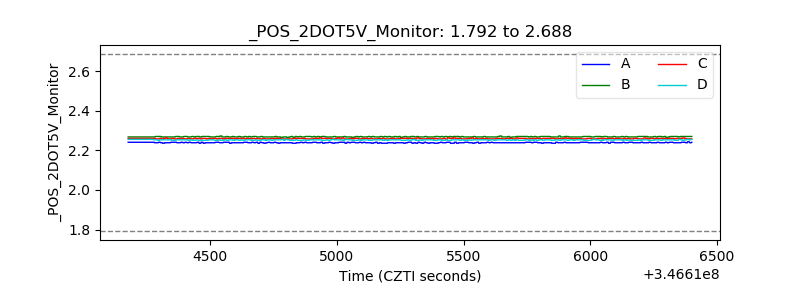 |
| +5 Volts monitor |  |
| _ROLL_ROT | 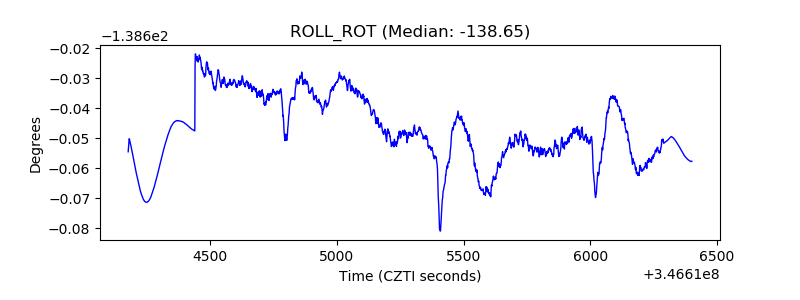 |
| _Roll_DEC | 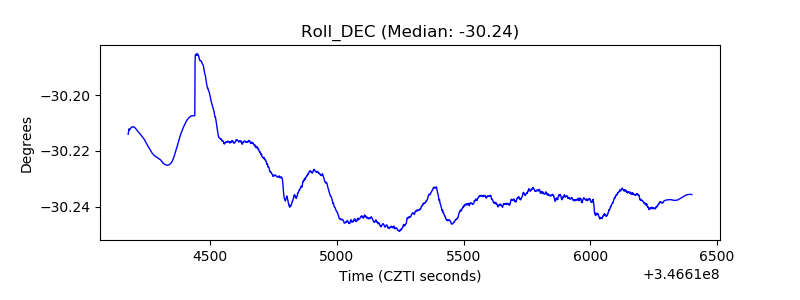 |
| _Roll_RA | 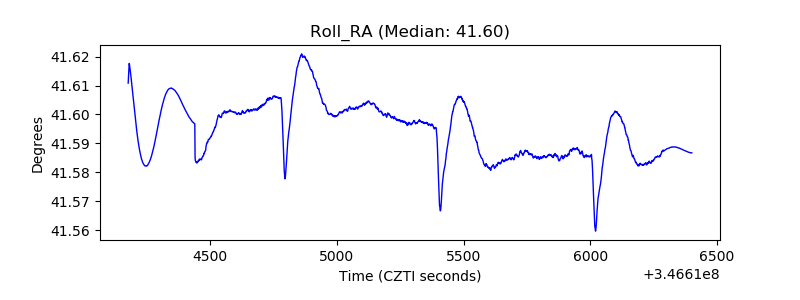 |
| Veto Counter | 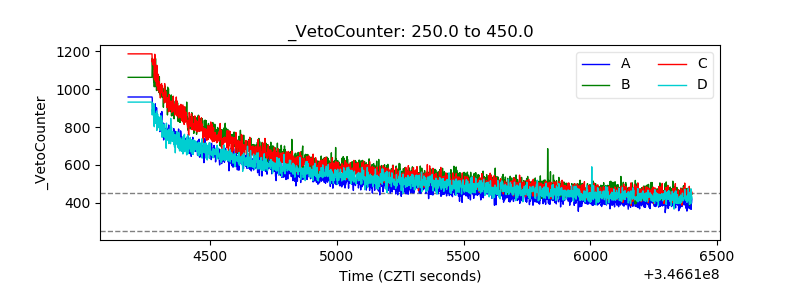 |