| Param | Original file | Final file |
|---|---|---|
| Filename | modeM0/AS1A10_101T02_9000004084_28356cztM0_level2.evt | modeM0/AS1A10_101T02_9000004084_28356cztM0_level2_quad_clean.evt |
| Size (bytes) | 508,057,920 | 96,024,960 |
| Size | 484.5 MB | 91.6 MB |
| Events in quadrant A | 3,286,829 | 639,248 |
| Events in quadrant B | 3,478,729 | 663,433 |
| Events in quadrant C | 3,286,617 | 612,992 |
| Events in quadrant D | 4,917,955 | 563,482 |
| Mode M0 | |||
|---|---|---|---|
| Quadrant | BADHDUFLAG | Total packets | Discarded packets |
| A | 0 | 13415 | 0 |
| B | 0 | 14053 | 0 |
| C | 0 | 13322 | 0 |
| D | 0 | 18619 | 0 |
| Mode M9 | |||
|---|---|---|---|
| Quadrant | BADHDUFLAG | Total packets | Discarded packets |
| A | 0 | 21 | 0 |
| B | 0 | 22 | 0 |
| C | 0 | 22 | 0 |
| D | 0 | 22 | 0 |
| Quadrant | Total seconds | Saturated seconds | Saturation percentage |
|---|---|---|---|
| A | 6139 | 47 | 0.765597% |
| B | 6139 | 70 | 1.140251% |
| C | 6138 | 91 | 1.482568% |
| D | 6138 | 359 | 5.848811% |
Noise dominated data is calculated using 1-second bins in cleaned event files. If a bin has >2000 counts, and if more than 50% of those come from <1% of pixels, then it is considered to be noise-dominated and hence unusable.
| Quadrant | # 1 sec bins | Bins with >0 counts | Bins with >2000 counts | High rate bins dominated by noise | Noise dominated (total time) | Noise dominated (detector-on time) | Marked lightcurve |
|---|---|---|---|---|---|---|---|
| A | 7494 | 6140 | 3 | 3 | 0.04% | 0.05% |  |
| B | 7494 | 6140 | 7 | 7 | 0.09% | 0.11% |  |
| C | 7493 | 6139 | 0 | 0 | 0.00% | 0.00% |  |
| D | 7493 | 6139 | 308 | 308 | 4.11% | 5.02% |  |
Top three noisy pixels from each quadrant. If the there are fewer than three noisy pixels in the level2.evt file, extra rows are filled as -1
| Pixel properties | Quadrant properties | ||||||
|---|---|---|---|---|---|---|---|
| Quadrant | DetID | PixID | Counts | Sigma | Mean | Median | Sigma |
| A | 15 | 174 | 65011 | 390.75 | 830 | 816 | 164.3 |
| A | 12 | 96 | 14576 | 83.76 | 830 | 816 | 164.3 |
| A | 13 | 254 | 10493 | 58.9 | 830 | 816 | 164.3 |
| B | 10 | 245 | 109342 | 696.42 | 837 | 818 | 155.8 |
| B | 12 | 16 | 34005 | 212.97 | 837 | 818 | 155.8 |
| B | 0 | 230 | 22467 | 138.93 | 837 | 818 | 155.8 |
| C | 14 | 238 | 130809 | 699.85 | 799 | 807 | 185.8 |
| C | 3 | 233 | 35860 | 188.7 | 799 | 807 | 185.8 |
| C | 0 | 10 | 8075 | 39.13 | 799 | 807 | 185.8 |
| D | 1 | 52 | 914004 | 4957.38 | 781 | 762 | 184.2 |
| D | 2 | 250 | 498311 | 2700.86 | 781 | 762 | 184.2 |
| D | 8 | 195 | 265369 | 1436.38 | 781 | 762 | 184.2 |
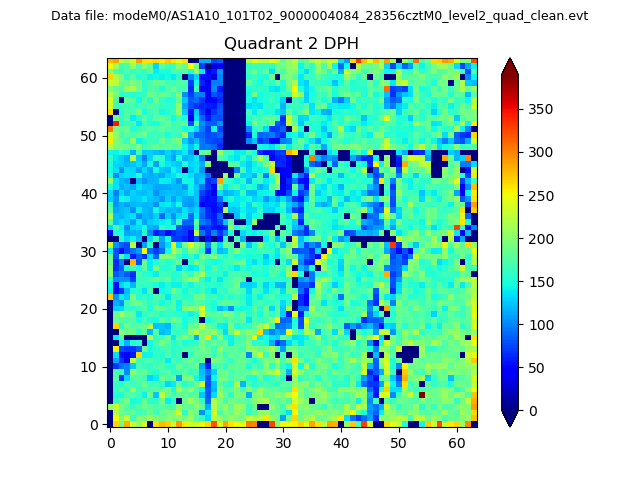
Histogram calculated using DETX and DETY for each event in the final _common_clean file
| Quadrant A | 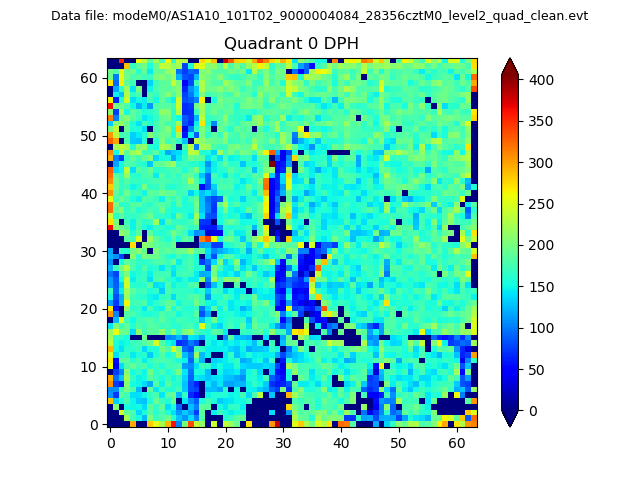 |
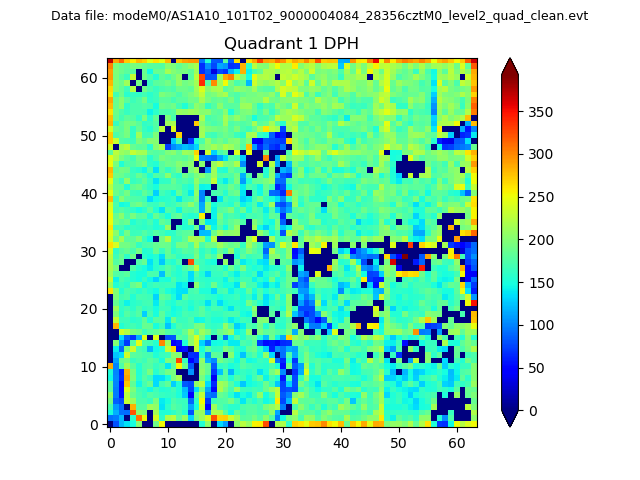 |
Quadrant B |
|---|---|---|---|
| Quadrant D | 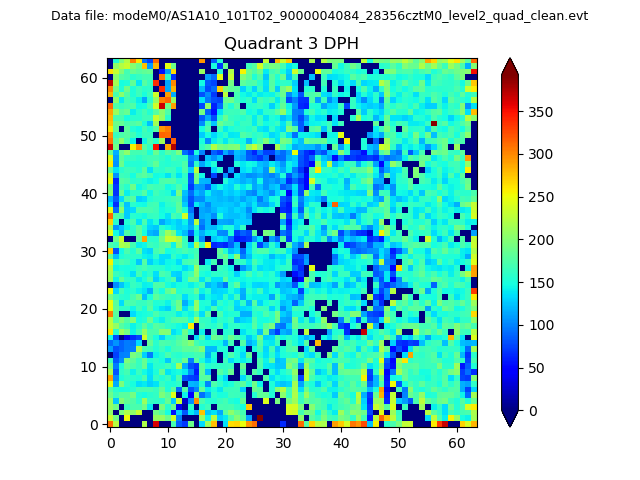 |
 |
Quadrant C |
| Plot type | Count rate plots | Images |
|---|---|---|
| Comparison with Poisson distribution Blue bars denote a histogram of data divided into 1 sec bins. Red curve is a Poisson curve with rate = median count rate of data. |
 |
 |
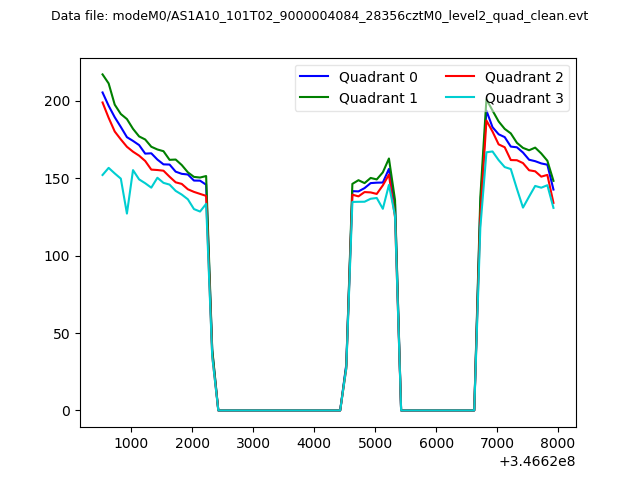
| Quadrant-wise count rates Data is divided into 100 sec bins |
 |
|
| Module-wise count rates for Quadrant A Data is divided into 100 sec bins |
 |
 |
| Module-wise count rates for Quadrant B Data is divided into 100 sec bins |
 |
 |
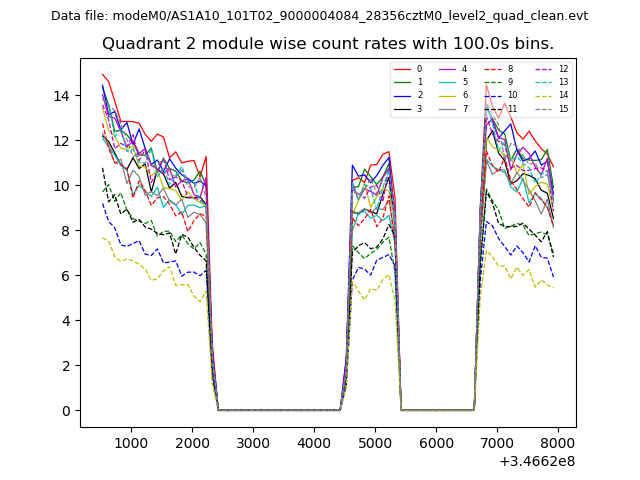
| Module-wise count rates for Quadrant C Data is divided into 100 sec bins |
 |
 |
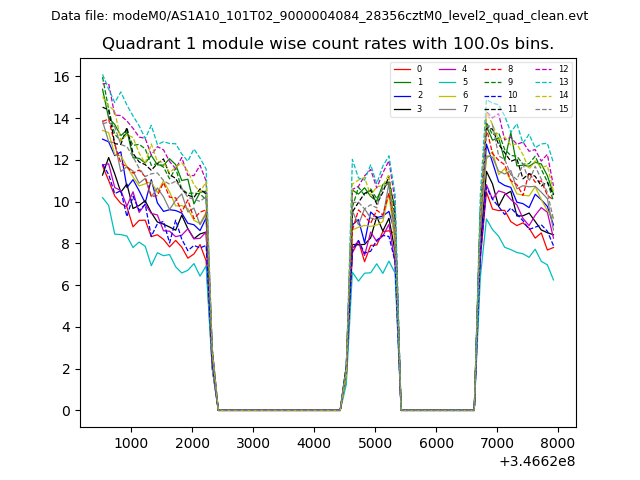
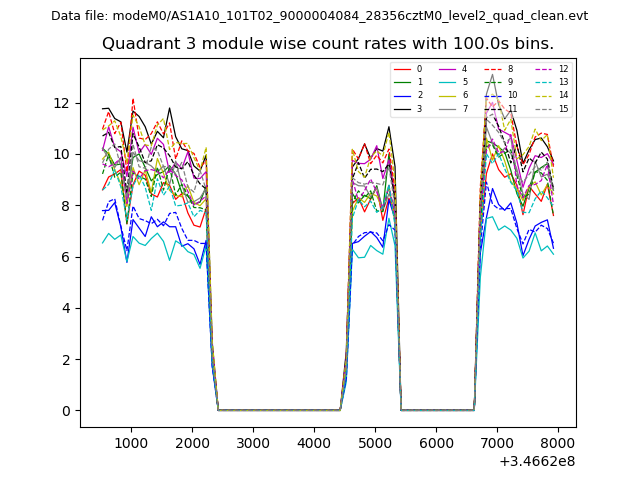
| Module-wise count rates for Quadrant D Data is divided into 100 sec bins |
 |
 |
| Parameter | Plot |
|---|---|
| CZT HV Monitor |  |
| D_VDD | 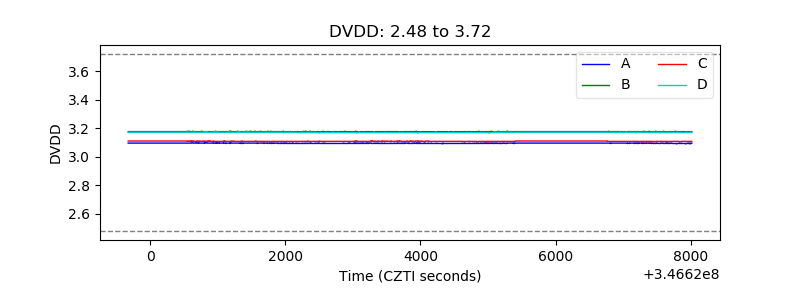 |
| Temperature 1 | 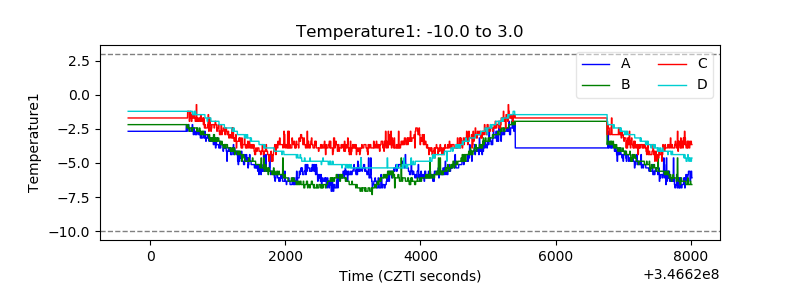 |
| Veto HV Monitor | 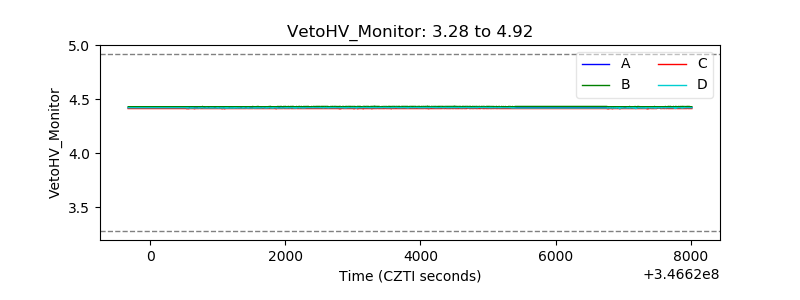 |
| Veto LLD | 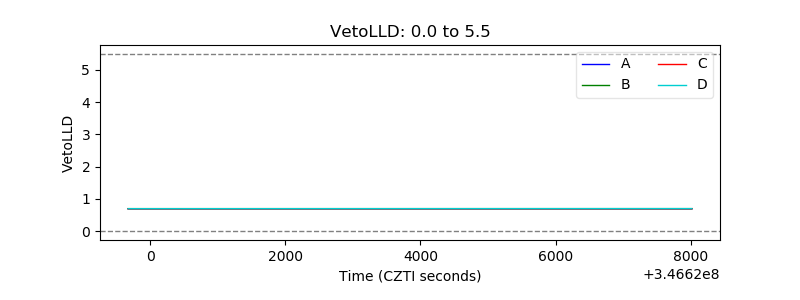 |
| Alpha Counter | 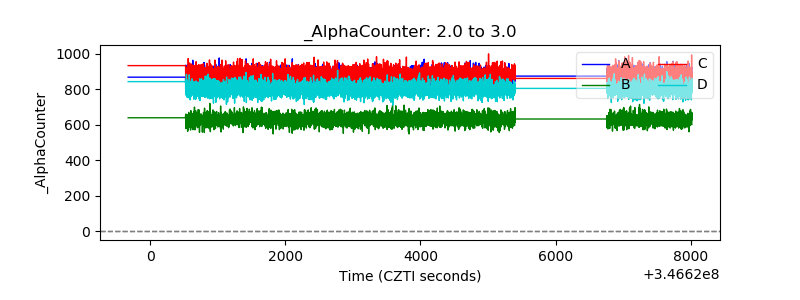 |
| _CPM_Rate | 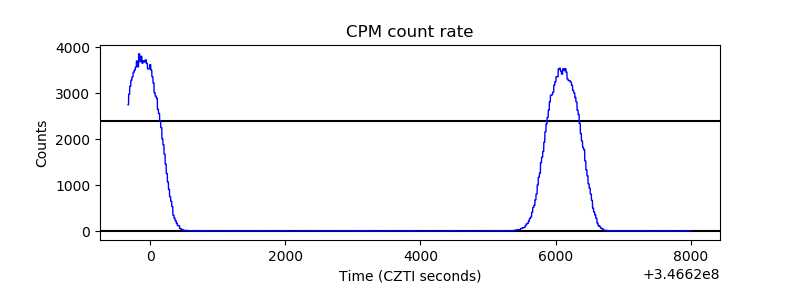 |
| CZT Counter | 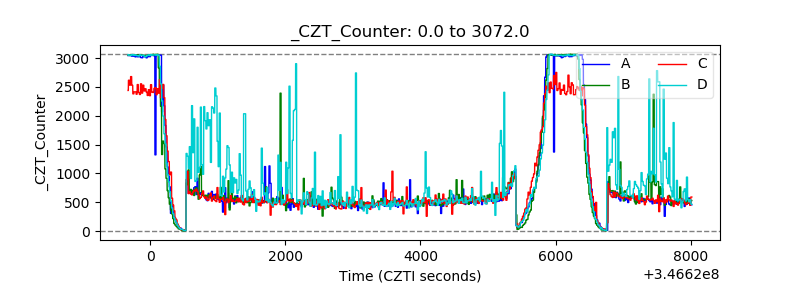 |
| +2.5 Volts monitor |  |
| +5 Volts monitor | 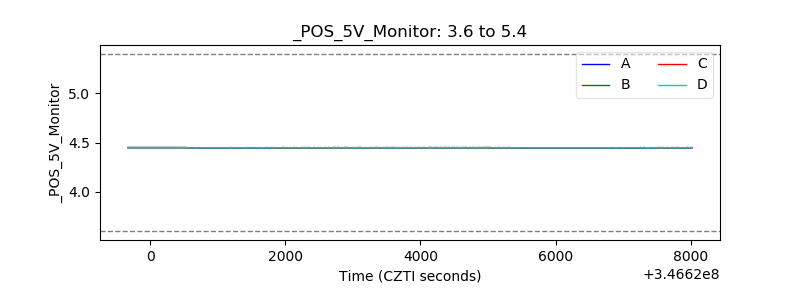 |
| _ROLL_ROT | 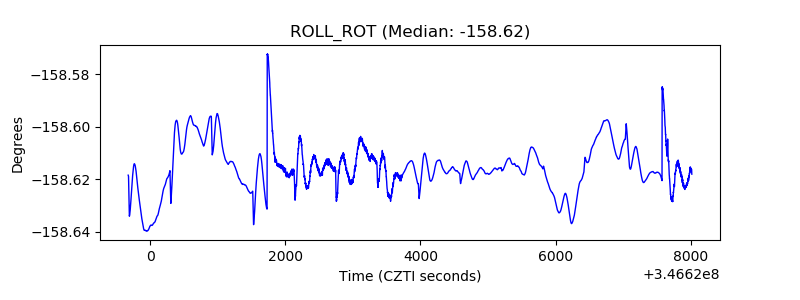 |
| _Roll_DEC | 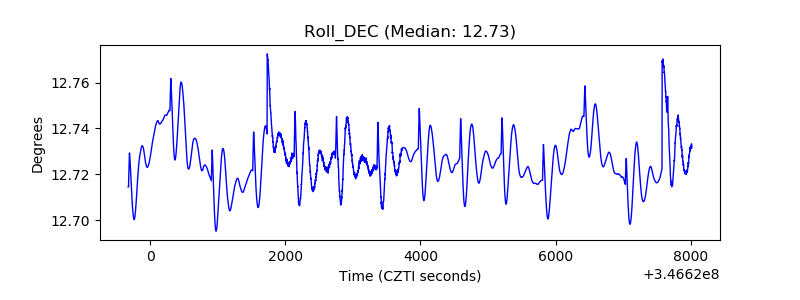 |
| _Roll_RA | 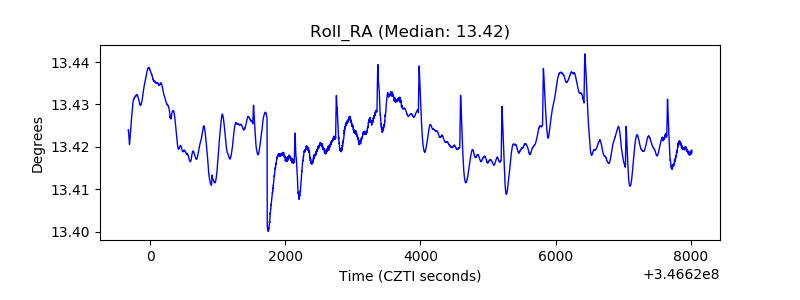 |
| Veto Counter |  |