| Param | Original file | Final file |
|---|---|---|
| Filename | modeM0/AS1A10_101T02_9000004084_28357cztM0_level2.evt | modeM0/AS1A10_101T02_9000004084_28357cztM0_level2_quad_clean.evt |
| Size (bytes) | 496,414,080 | 89,472,960 |
| Size | 473.4 MB | 85.3 MB |
| Events in quadrant A | 3,197,131 | 584,904 |
| Events in quadrant B | 3,408,945 | 606,421 |
| Events in quadrant C | 3,528,521 | 554,839 |
| Events in quadrant D | 4,477,621 | 529,184 |
| Mode M0 | |||
|---|---|---|---|
| Quadrant | BADHDUFLAG | Total packets | Discarded packets |
| A | 0 | 13114 | 0 |
| B | 0 | 13855 | 0 |
| C | 0 | 14061 | 0 |
| D | 0 | 17399 | 0 |
| Mode M9 | |||
|---|---|---|---|
| Quadrant | BADHDUFLAG | Total packets | Discarded packets |
| A | 0 | 18 | 0 |
| B | 0 | 19 | 0 |
| C | 0 | 19 | 0 |
| D | 0 | 19 | 0 |
| Quadrant | Total seconds | Saturated seconds | Saturation percentage |
|---|---|---|---|
| A | 6219 | 23 | 0.369834% |
| B | 6219 | 53 | 0.852227% |
| C | 6219 | 200 | 3.215951% |
| D | 6219 | 181 | 2.910436% |
Noise dominated data is calculated using 1-second bins in cleaned event files. If a bin has >2000 counts, and if more than 50% of those come from <1% of pixels, then it is considered to be noise-dominated and hence unusable.
| Quadrant | # 1 sec bins | Bins with >0 counts | Bins with >2000 counts | High rate bins dominated by noise | Noise dominated (total time) | Noise dominated (detector-on time) | Marked lightcurve |
|---|---|---|---|---|---|---|---|
| A | 7574 | 6220 | 0 | 0 | 0.00% | 0.00% | 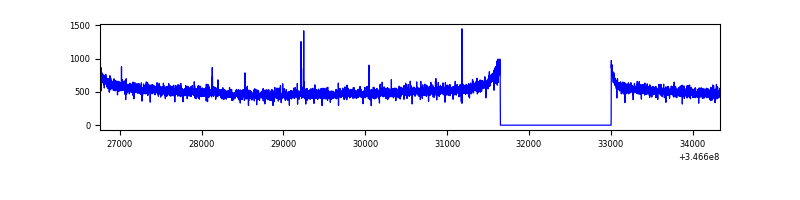 |
| B | 7574 | 6220 | 2 | 2 | 0.03% | 0.03% | 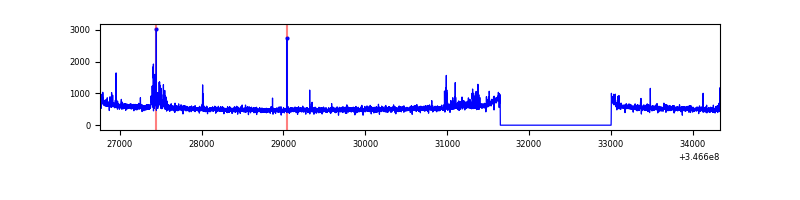 |
| C | 7574 | 6220 | 97 | 97 | 1.28% | 1.56% | 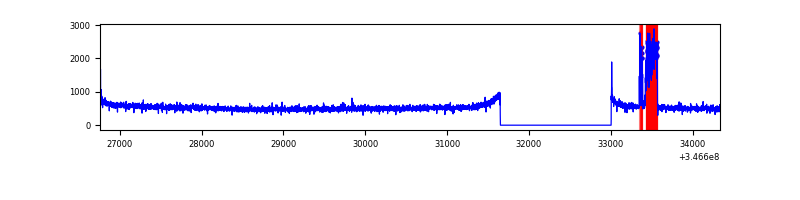 |
| D | 7574 | 6220 | 133 | 133 | 1.76% | 2.14% | 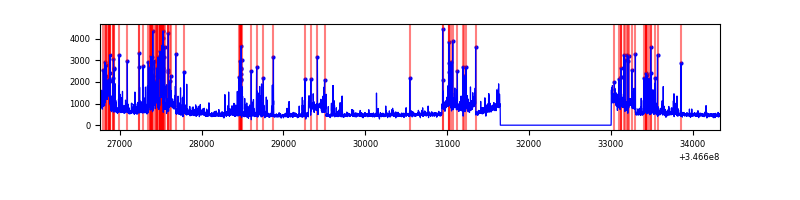 |
Top three noisy pixels from each quadrant. If the there are fewer than three noisy pixels in the level2.evt file, extra rows are filled as -1
| Pixel properties | Quadrant properties | ||||||
|---|---|---|---|---|---|---|---|
| Quadrant | DetID | PixID | Counts | Sigma | Mean | Median | Sigma |
| A | 12 | 96 | 14049 | 80.6 | 825 | 810 | 164.2 |
| A | 13 | 254 | 10746 | 60.49 | 825 | 810 | 164.2 |
| A | 3 | 137 | 7667 | 41.75 | 825 | 810 | 164.2 |
| B | 10 | 245 | 58475 | 372.2 | 834 | 816 | 154.9 |
| B | 0 | 230 | 40036 | 253.17 | 834 | 816 | 154.9 |
| B | 10 | 246 | 24075 | 150.14 | 834 | 816 | 154.9 |
| C | 3 | 233 | 301533 | 1621.54 | 793 | 802 | 185.5 |
| C | 14 | 238 | 129413 | 693.47 | 793 | 802 | 185.5 |
| C | 0 | 10 | 7130 | 34.12 | 793 | 802 | 185.5 |
| D | 1 | 52 | 727228 | 3877.58 | 788 | 769 | 187.3 |
| D | 8 | 195 | 652032 | 3476.21 | 788 | 769 | 187.3 |
| D | 2 | 250 | 93804 | 496.59 | 788 | 769 | 187.3 |
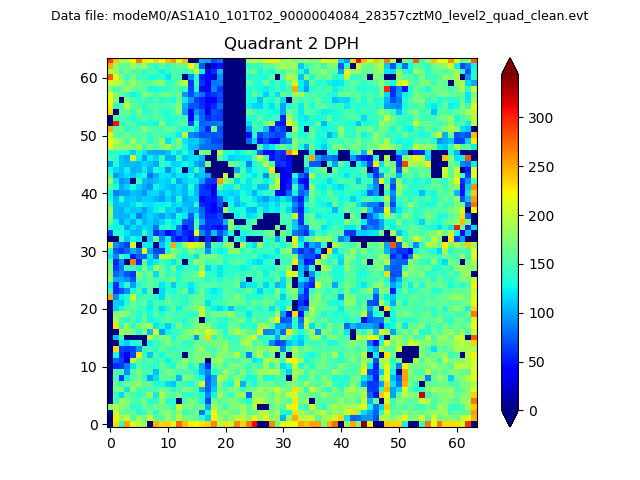
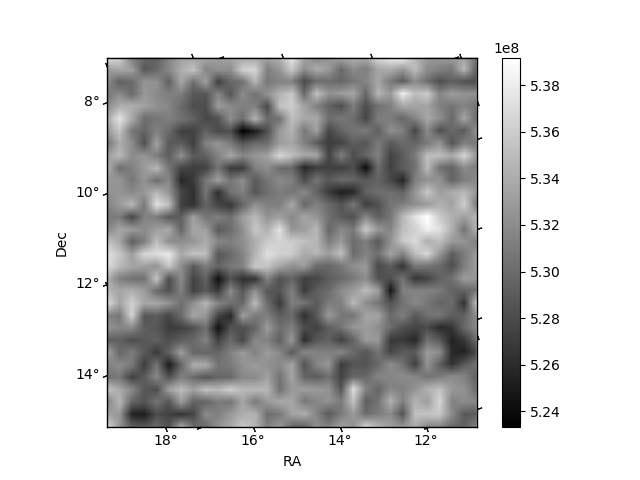
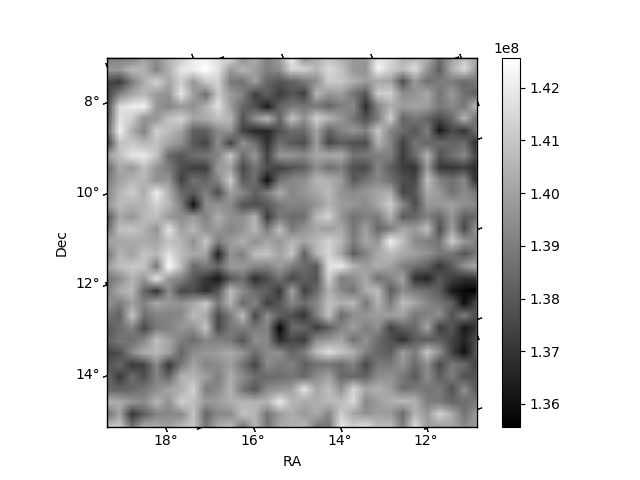
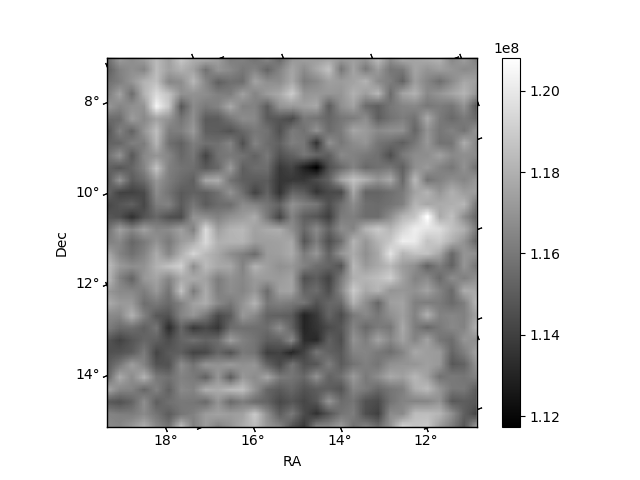
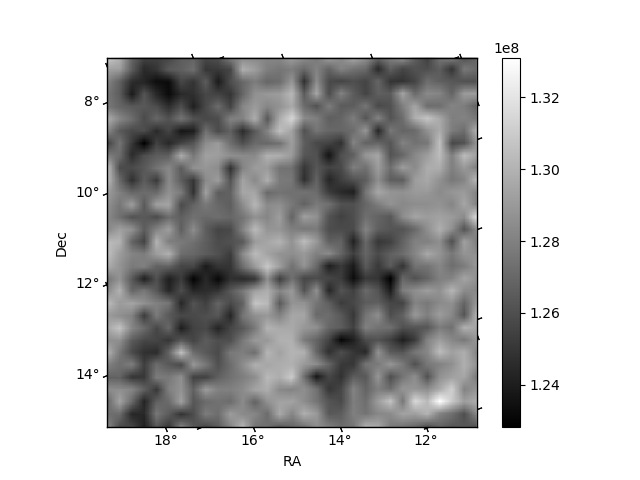
Histogram calculated using DETX and DETY for each event in the final _common_clean file
| Quadrant A | 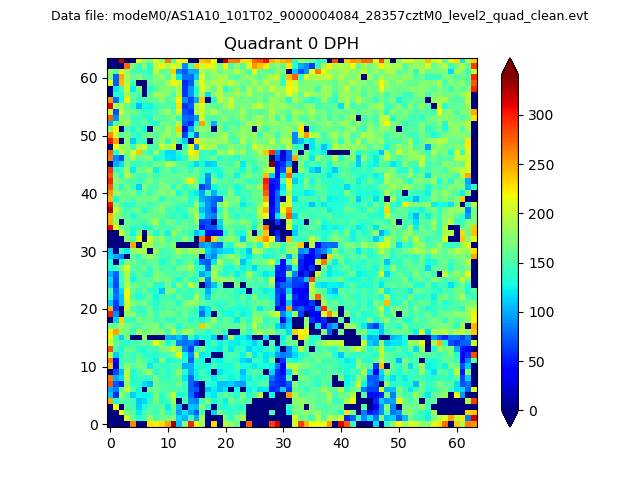 |
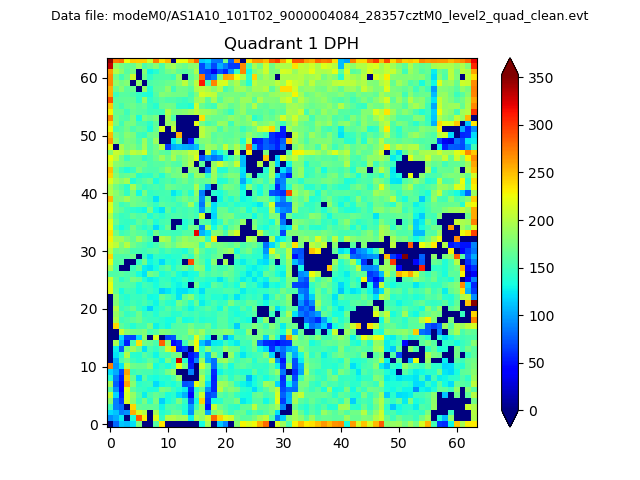 |
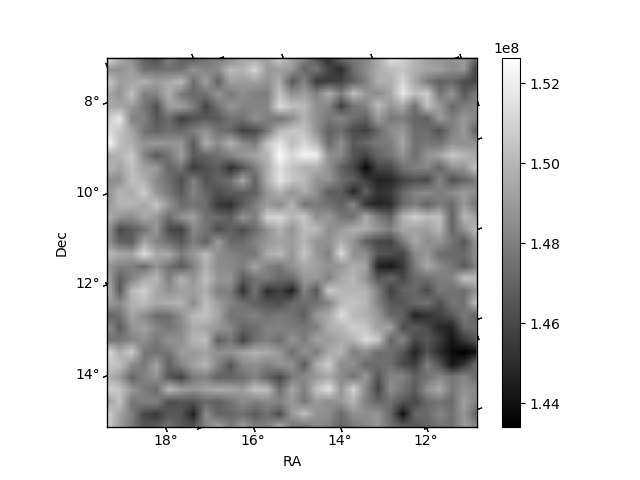
Quadrant B |
|---|---|---|---|
| Quadrant D | 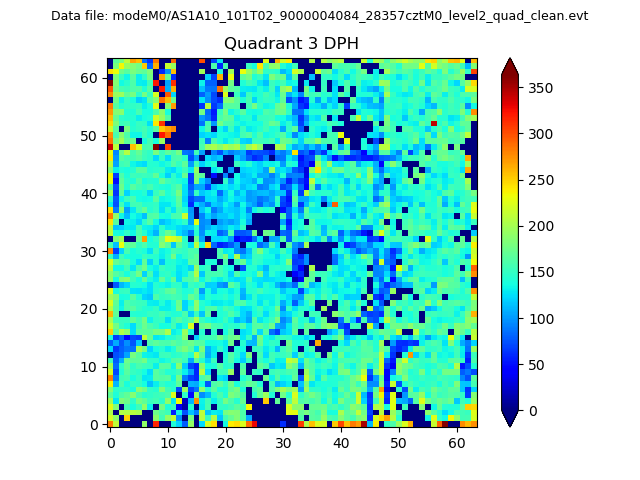 |
 |
Quadrant C |
| Plot type | Count rate plots | Images |
|---|---|---|
| Comparison with Poisson distribution Blue bars denote a histogram of data divided into 1 sec bins. Red curve is a Poisson curve with rate = median count rate of data. |
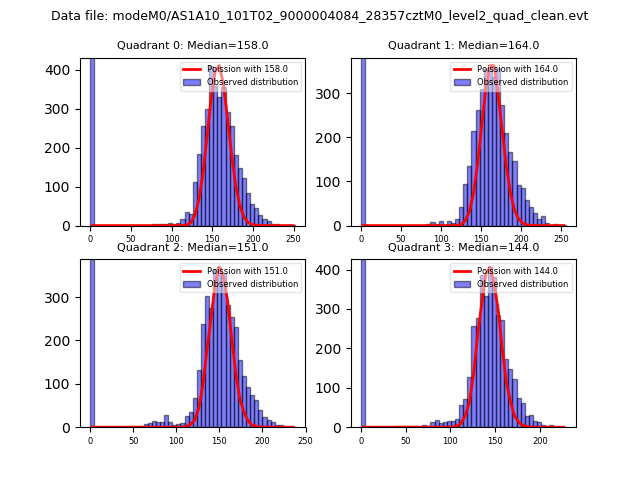 |
 |
| Quadrant-wise count rates Data is divided into 100 sec bins |
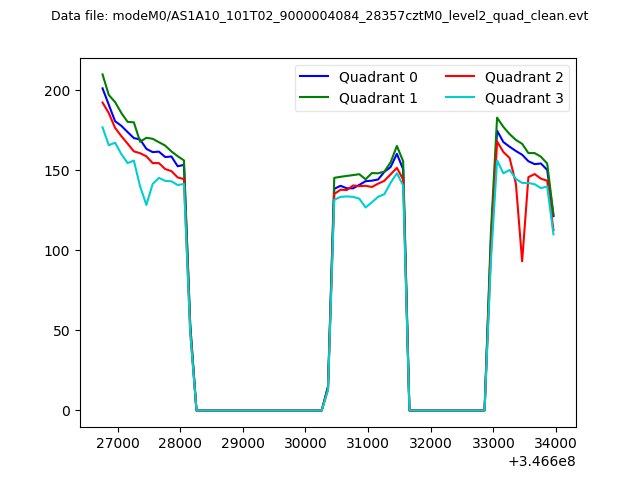 |
|
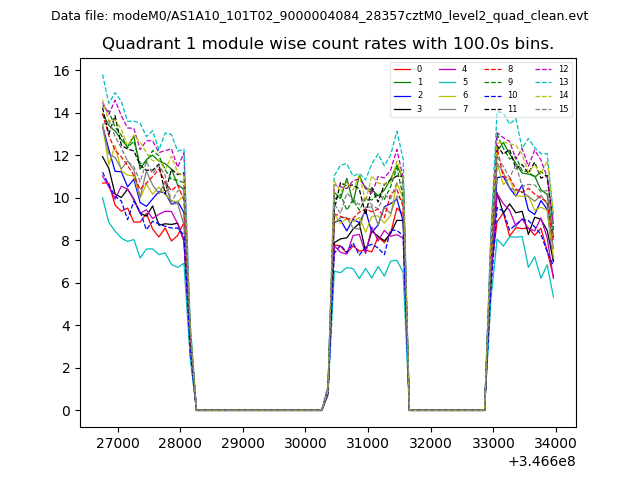
| Module-wise count rates for Quadrant A Data is divided into 100 sec bins |
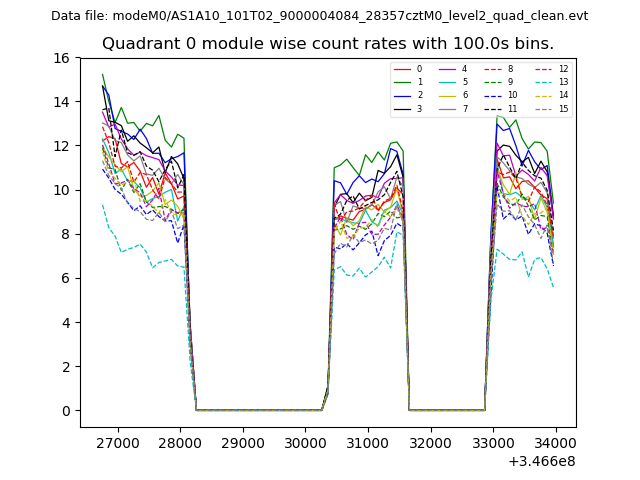 |
 |
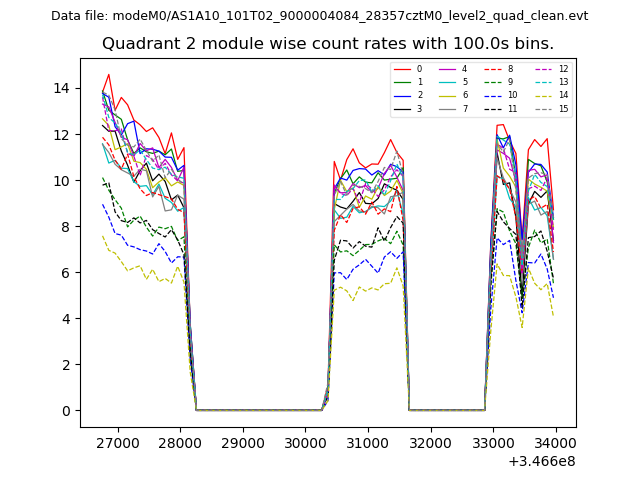
| Module-wise count rates for Quadrant B Data is divided into 100 sec bins |
 |
 |
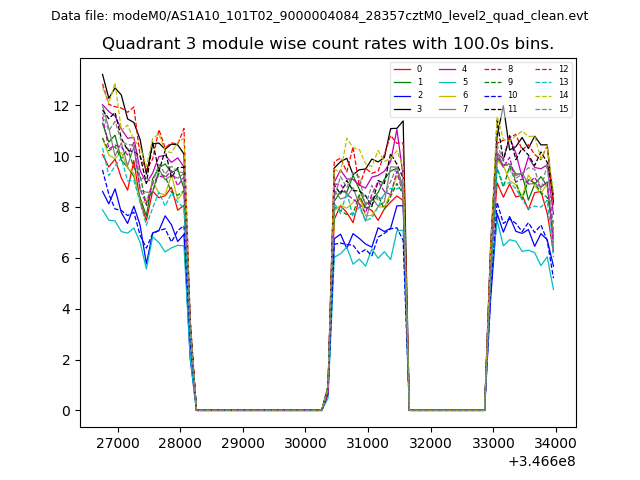
| Module-wise count rates for Quadrant C Data is divided into 100 sec bins |
 |
 |
| Module-wise count rates for Quadrant D Data is divided into 100 sec bins |
 |
 |
| Parameter | Plot |
|---|---|
| CZT HV Monitor | 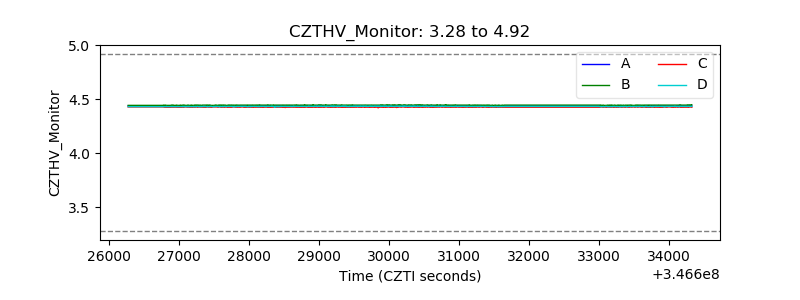 |
| D_VDD | 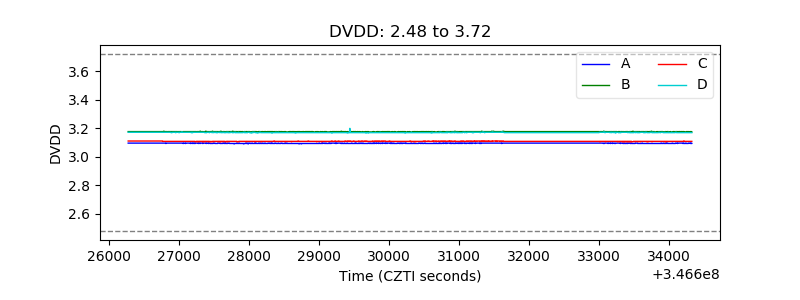 |
| Temperature 1 | 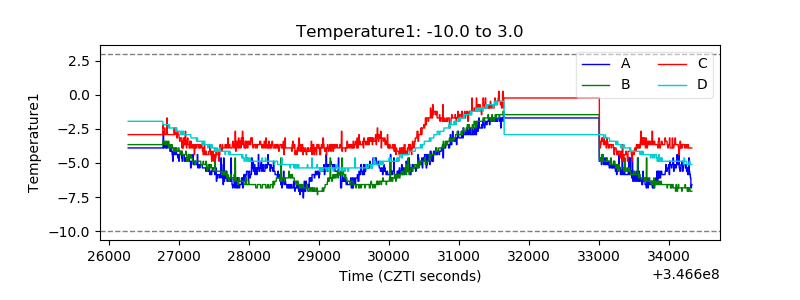 |
| Veto HV Monitor | 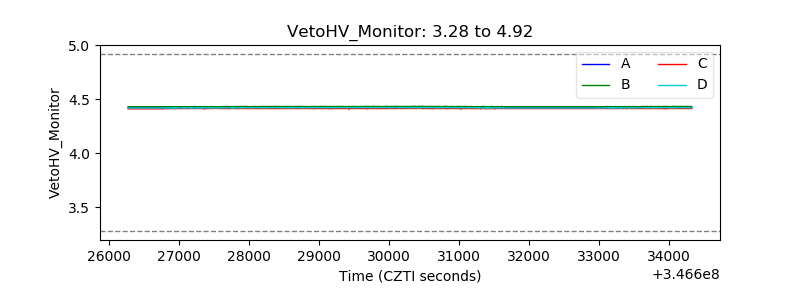 |
| Veto LLD | 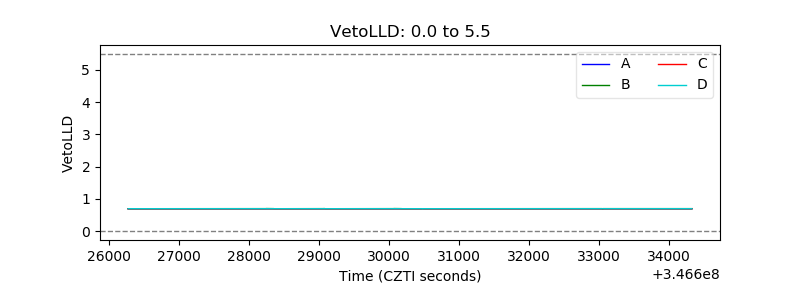 |
| Alpha Counter | 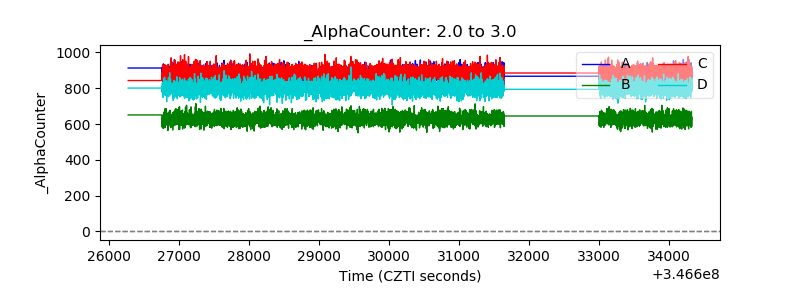 |
| _CPM_Rate | 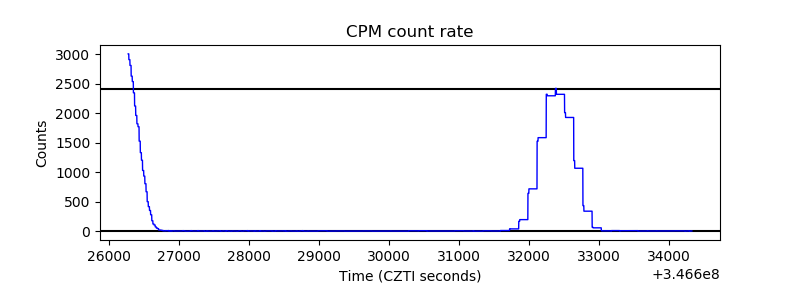 |
| CZT Counter | 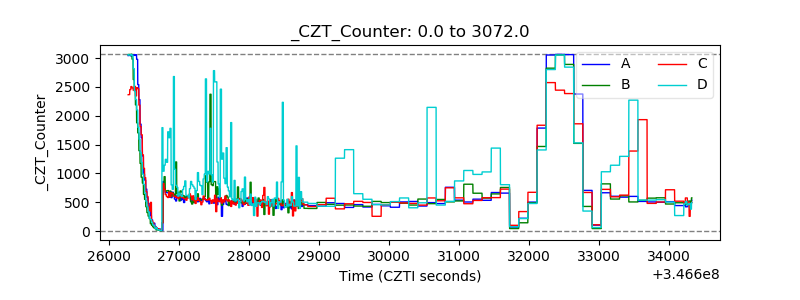 |
| +2.5 Volts monitor |  |
| +5 Volts monitor | 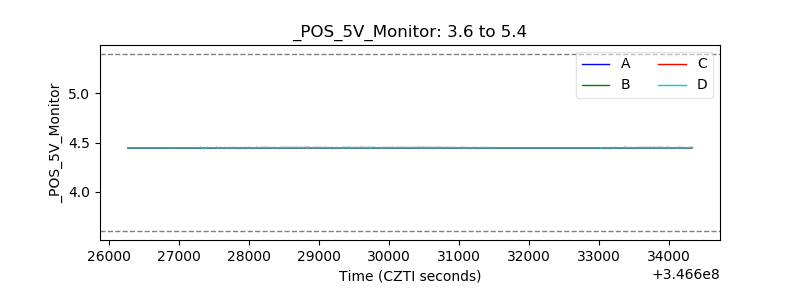 |
| _ROLL_ROT | 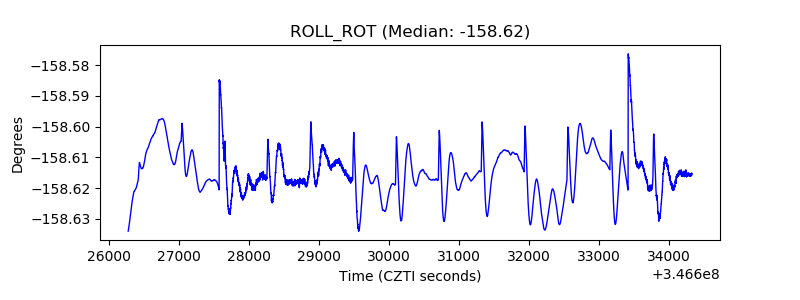 |
| _Roll_DEC | 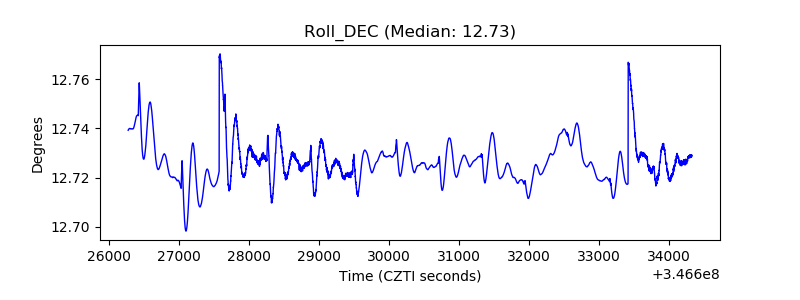 |
| _Roll_RA |  |
| Veto Counter | 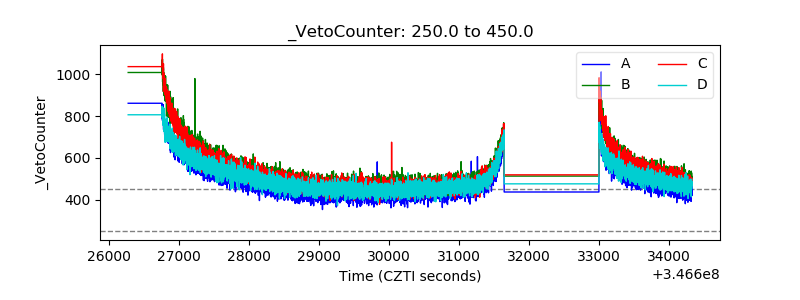 |