| Param | Original file | Final file |
|---|---|---|
| Filename | modeM0/AS1A10_101T02_9000004084_28358cztM0_level2.evt | modeM0/AS1A10_101T02_9000004084_28358cztM0_level2_quad_clean.evt |
| Size (bytes) | 495,112,320 | 79,954,560 |
| Size | 472.2 MB | 76.3 MB |
| Events in quadrant A | 3,240,730 | 503,582 |
| Events in quadrant B | 3,420,662 | 519,721 |
| Events in quadrant C | 3,597,666 | 477,048 |
| Events in quadrant D | 4,288,581 | 461,538 |
| Mode M0 | |||
|---|---|---|---|
| Quadrant | BADHDUFLAG | Total packets | Discarded packets |
| A | 0 | 13596 | 0 |
| B | 0 | 14015 | 0 |
| C | 0 | 14533 | 0 |
| D | 0 | 17091 | 0 |
| Mode M9 | |||
|---|---|---|---|
| Quadrant | BADHDUFLAG | Total packets | Discarded packets |
| A | 0 | 24 | 0 |
| B | 0 | 25 | 0 |
| C | 0 | 25 | 0 |
| D | 0 | 25 | 0 |
| Quadrant | Total seconds | Saturated seconds | Saturation percentage |
|---|---|---|---|
| A | 6581 | 14 | 0.212734% |
| B | 6581 | 27 | 0.410272% |
| C | 6581 | 185 | 2.811123% |
| D | 6581 | 135 | 2.051360% |
Noise dominated data is calculated using 1-second bins in cleaned event files. If a bin has >2000 counts, and if more than 50% of those come from <1% of pixels, then it is considered to be noise-dominated and hence unusable.
| Quadrant | # 1 sec bins | Bins with >0 counts | Bins with >2000 counts | High rate bins dominated by noise | Noise dominated (total time) | Noise dominated (detector-on time) | Marked lightcurve |
|---|---|---|---|---|---|---|---|
| A | 7826 | 6582 | 0 | 0 | 0.00% | 0.00% | 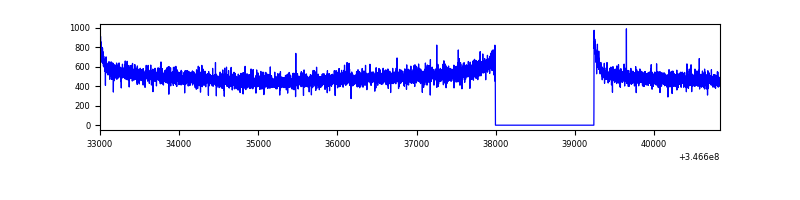 |
| B | 7826 | 6582 | 1 | 1 | 0.01% | 0.02% | 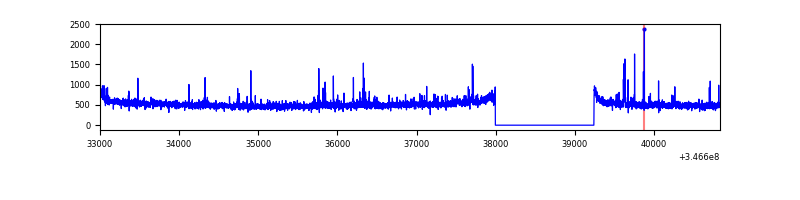 |
| C | 7826 | 6582 | 97 | 97 | 1.24% | 1.47% | 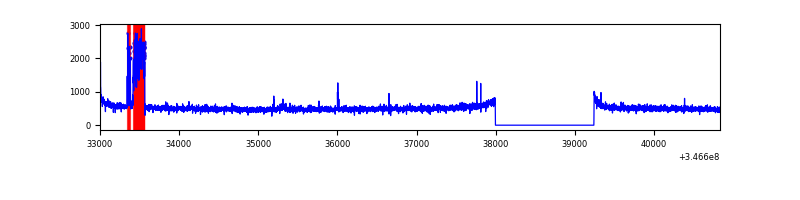 |
| D | 7826 | 6582 | 101 | 101 | 1.29% | 1.53% | 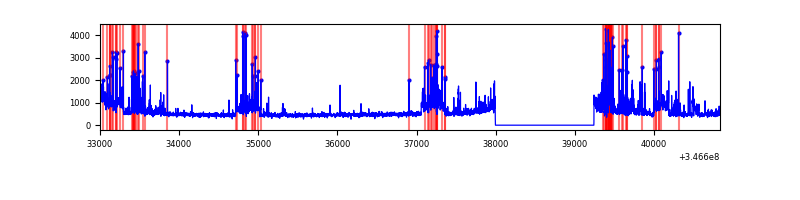 |
Top three noisy pixels from each quadrant. If the there are fewer than three noisy pixels in the level2.evt file, extra rows are filled as -1
| Pixel properties | Quadrant properties | ||||||
|---|---|---|---|---|---|---|---|
| Quadrant | DetID | PixID | Counts | Sigma | Mean | Median | Sigma |
| A | 13 | 254 | 11081 | 60.51 | 840 | 823 | 169.5 |
| A | 3 | 137 | 7983 | 42.23 | 840 | 823 | 169.5 |
| A | 0 | 226 | 7096 | 37.0 | 840 | 823 | 169.5 |
| B | 10 | 246 | 42804 | 262.85 | 847 | 827 | 159.7 |
| B | 10 | 245 | 23321 | 140.85 | 847 | 827 | 159.7 |
| B | 0 | 230 | 22742 | 137.23 | 847 | 827 | 159.7 |
| C | 3 | 233 | 311164 | 1635.27 | 809 | 815 | 189.8 |
| C | 14 | 238 | 130798 | 684.9 | 809 | 815 | 189.8 |
| C | 13 | 61 | 5517 | 24.78 | 809 | 815 | 189.8 |
| D | 8 | 195 | 599285 | 3093.22 | 807 | 784 | 193.5 |
| D | 1 | 52 | 513280 | 2648.72 | 807 | 784 | 193.5 |
| D | 2 | 250 | 81124 | 415.22 | 807 | 784 | 193.5 |
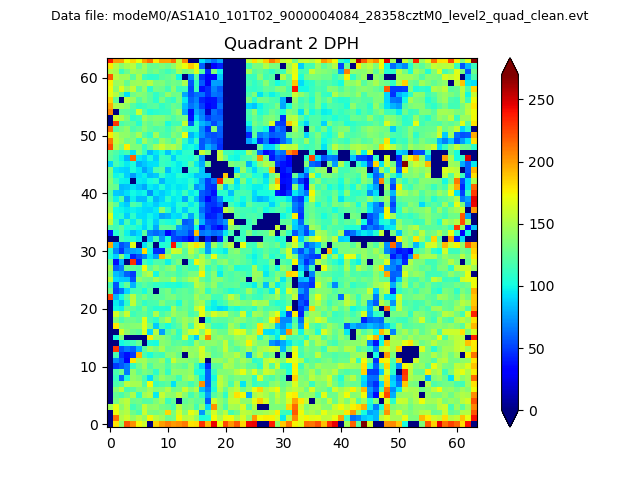
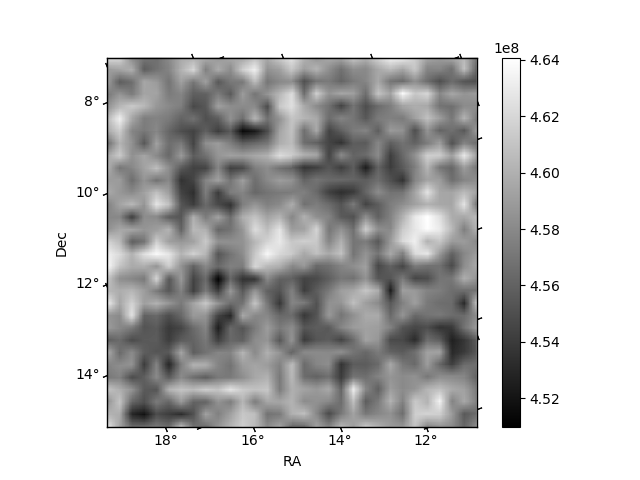
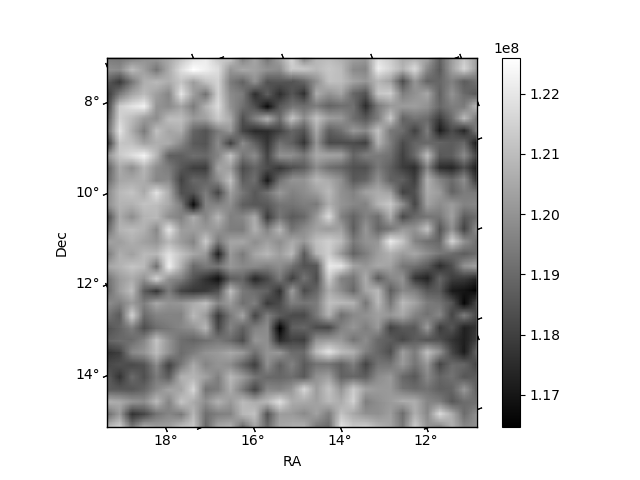
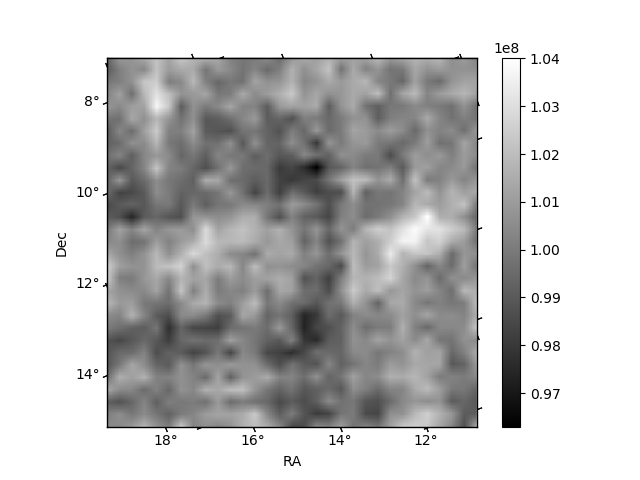
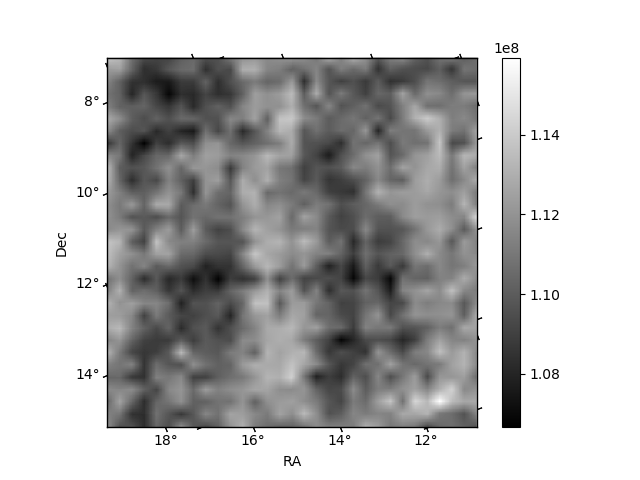
Histogram calculated using DETX and DETY for each event in the final _common_clean file
| Quadrant A | 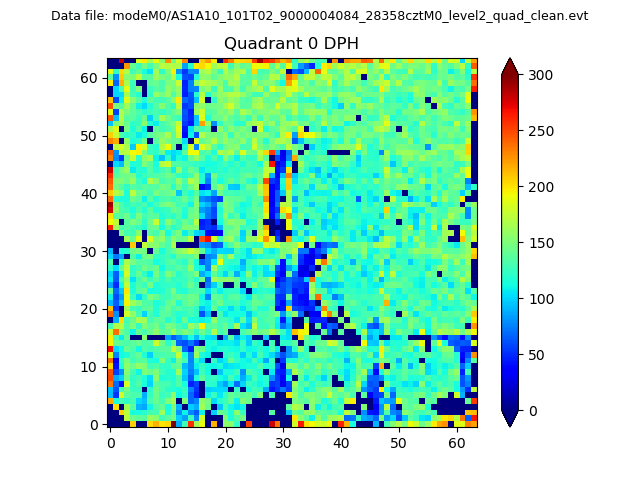 |
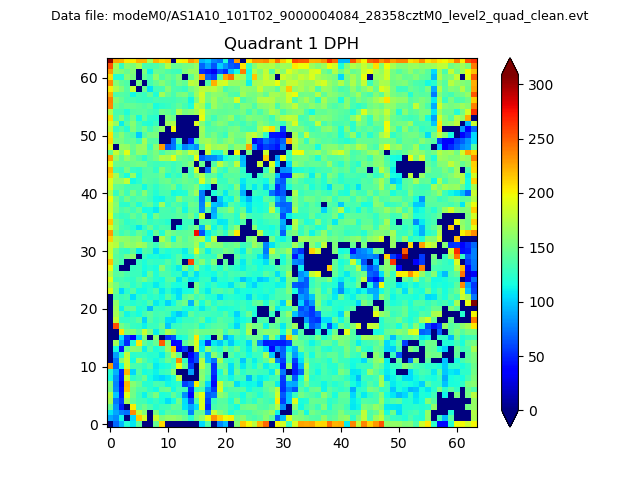 |
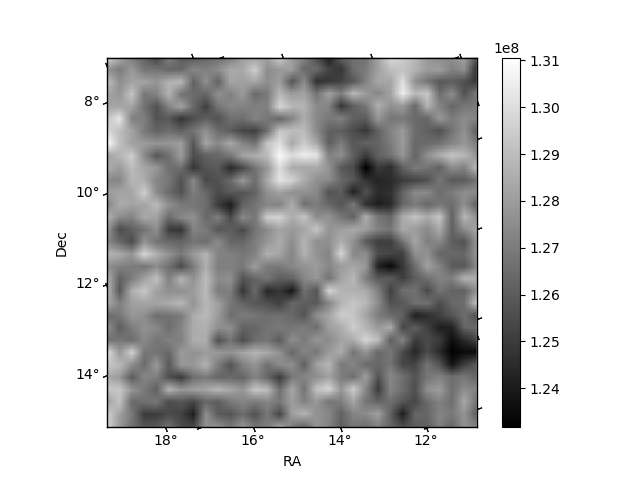
Quadrant B |
|---|---|---|---|
| Quadrant D | 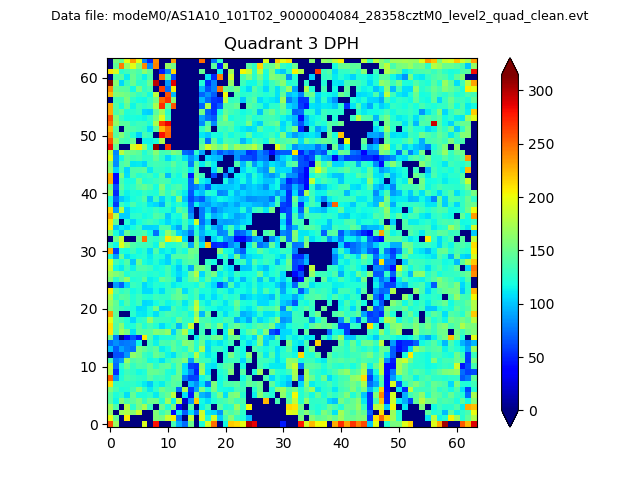 |
 |
Quadrant C |
| Plot type | Count rate plots | Images |
|---|---|---|
| Comparison with Poisson distribution Blue bars denote a histogram of data divided into 1 sec bins. Red curve is a Poisson curve with rate = median count rate of data. |
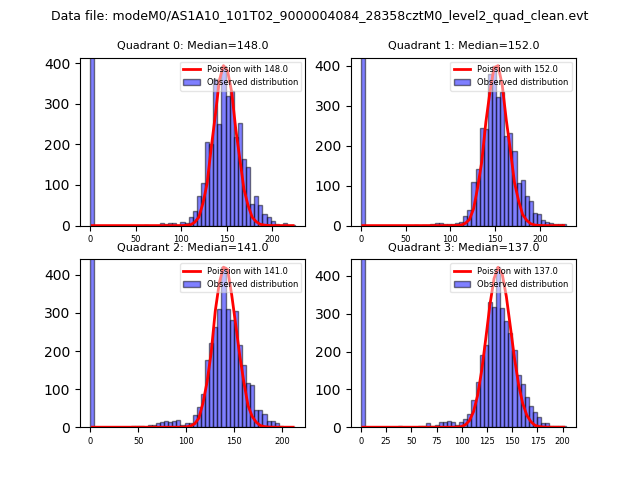 |
 |
| Quadrant-wise count rates Data is divided into 100 sec bins |
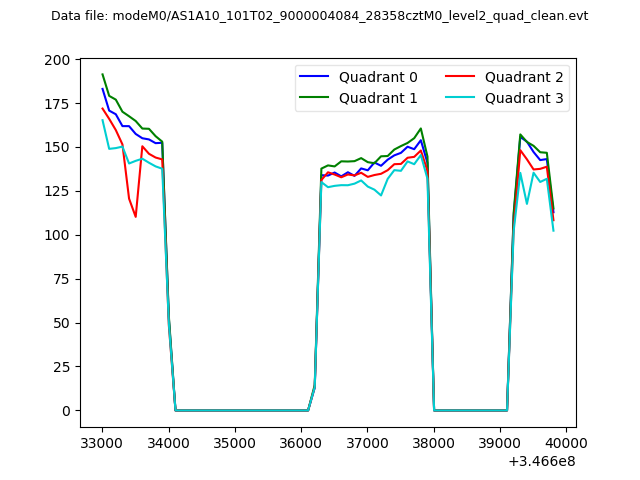 |
|
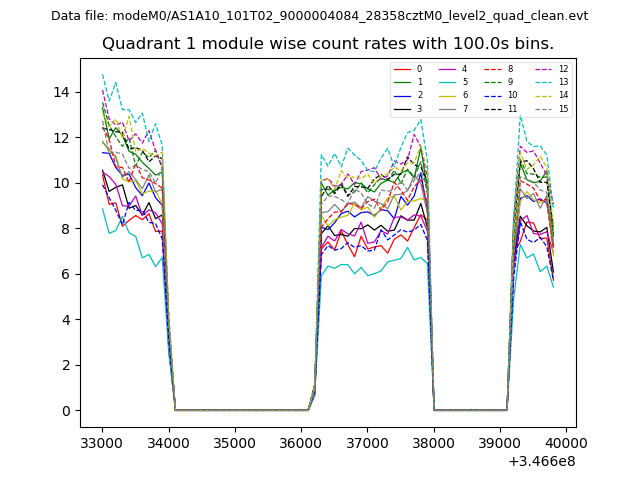
| Module-wise count rates for Quadrant A Data is divided into 100 sec bins |
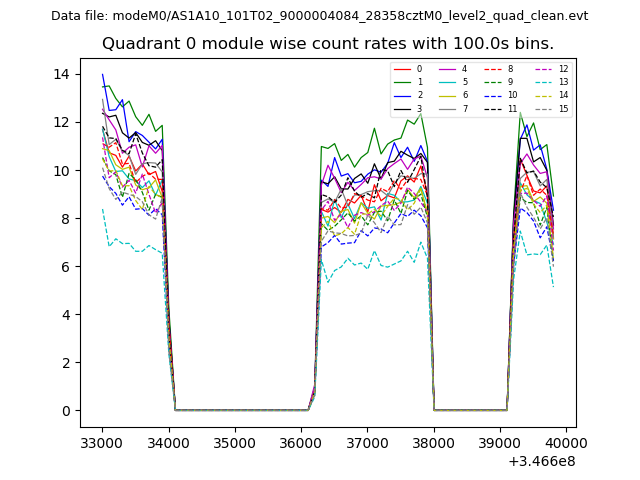 |
 |
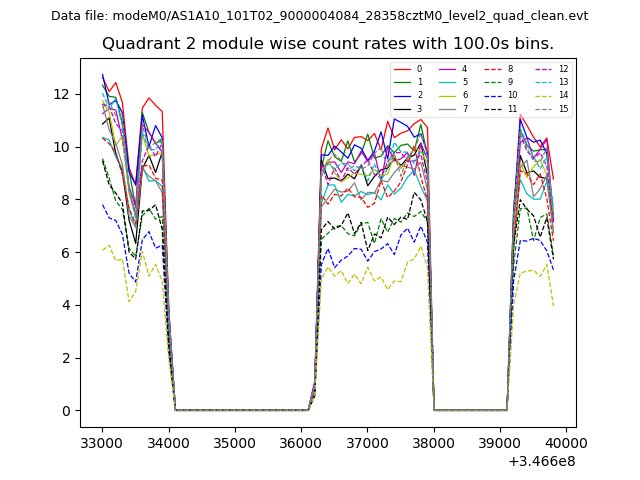
| Module-wise count rates for Quadrant B Data is divided into 100 sec bins |
 |
 |
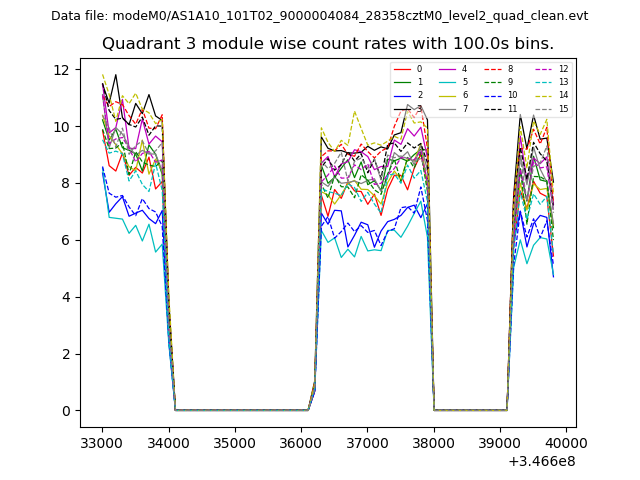
| Module-wise count rates for Quadrant C Data is divided into 100 sec bins |
 |
 |
| Module-wise count rates for Quadrant D Data is divided into 100 sec bins |
 |
 |
| Parameter | Plot |
|---|---|
| CZT HV Monitor | 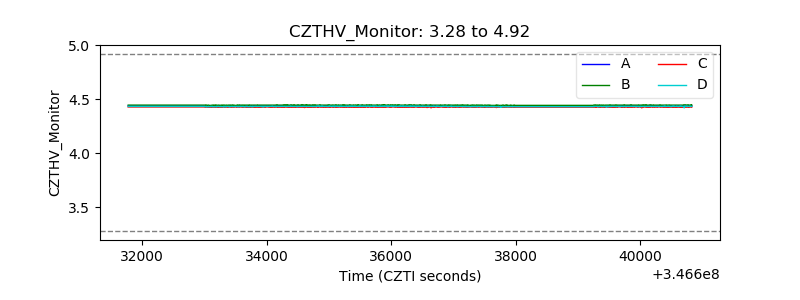 |
| D_VDD | 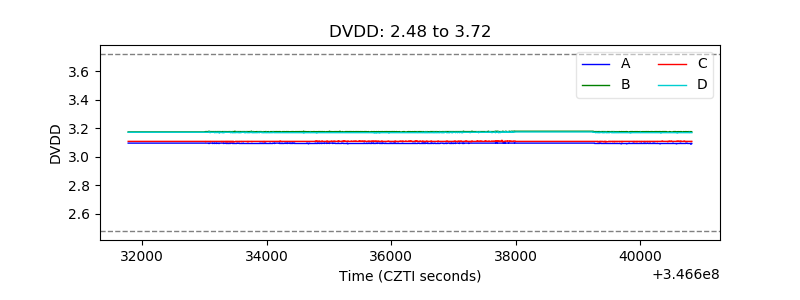 |
| Temperature 1 | 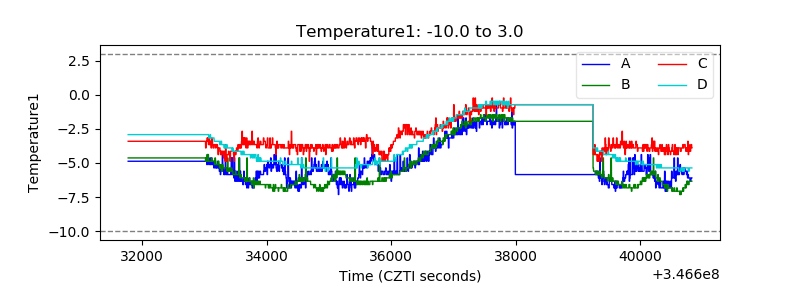 |
| Veto HV Monitor | 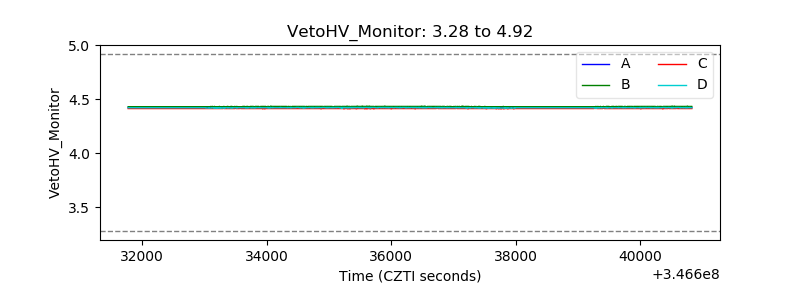 |
| Veto LLD | 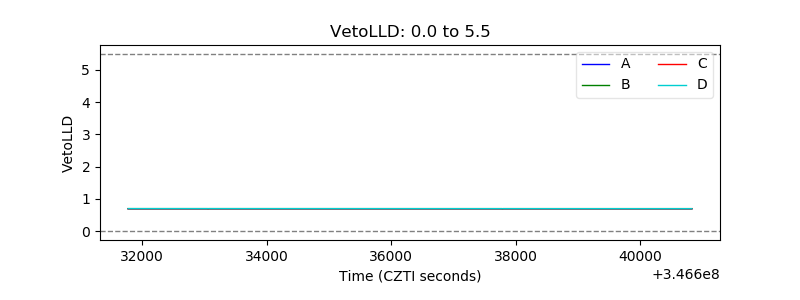 |
| Alpha Counter | 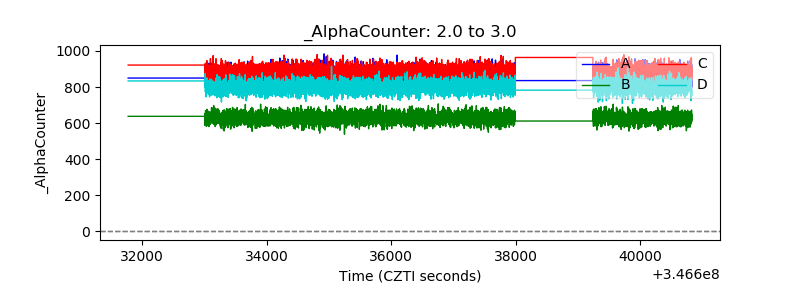 |
| _CPM_Rate | 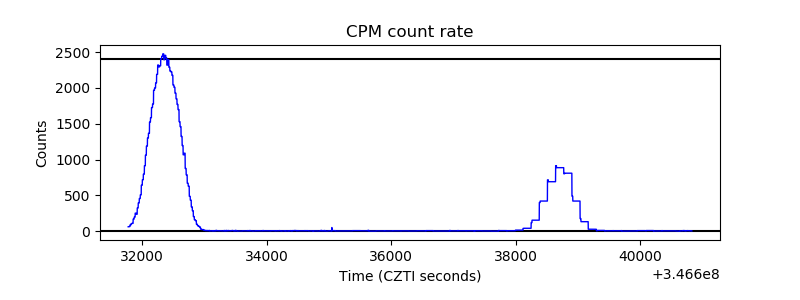 |
| CZT Counter | 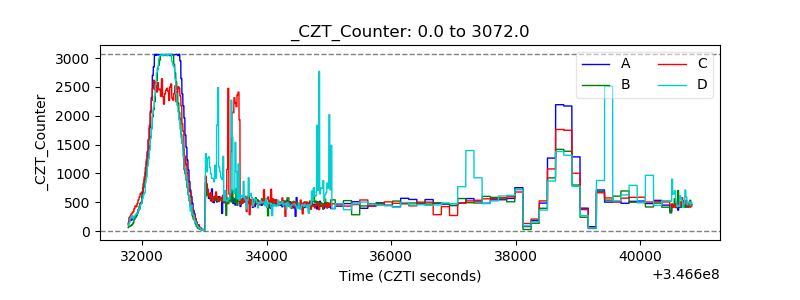 |
| +2.5 Volts monitor |  |
| +5 Volts monitor |  |
| _ROLL_ROT | 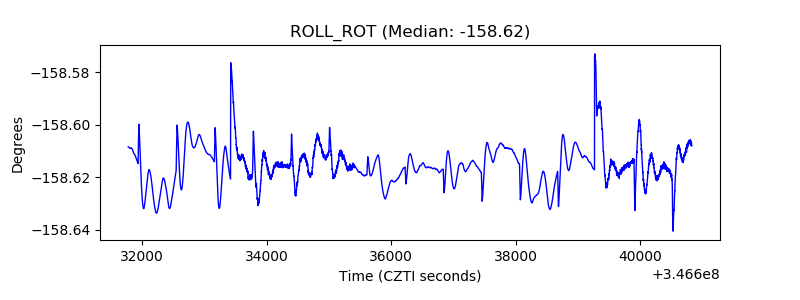 |
| _Roll_DEC | 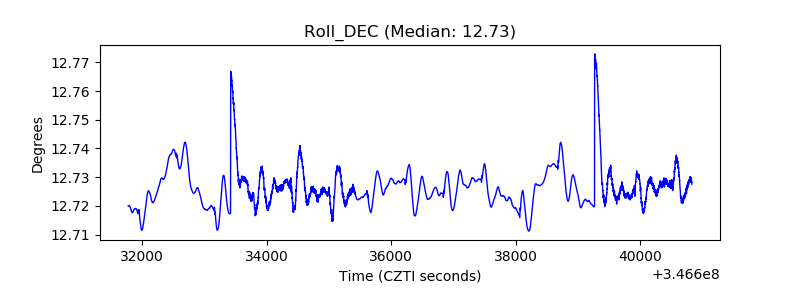 |
| _Roll_RA | 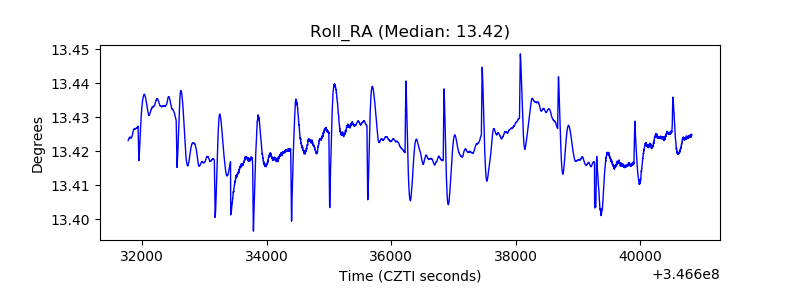 |
| Veto Counter | 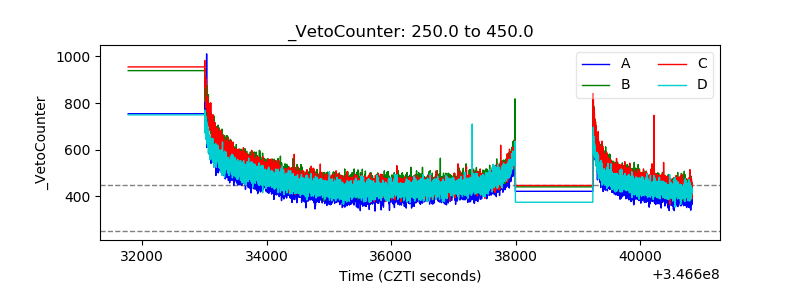 |