| Param | Original file | Final file |
|---|---|---|
| Filename | modeM0/AS1A10_101T02_9000004084_28359cztM0_level2.evt | modeM0/AS1A10_101T02_9000004084_28359cztM0_level2_quad_clean.evt |
| Size (bytes) | 569,972,160 | 77,348,160 |
| Size | 543.6 MB | 73.8 MB |
| Events in quadrant A | 3,409,305 | 479,967 |
| Events in quadrant B | 3,571,114 | 489,807 |
| Events in quadrant C | 3,656,720 | 459,140 |
| Events in quadrant D | 6,151,778 | 426,995 |
| Mode M0 | |||
|---|---|---|---|
| Quadrant | BADHDUFLAG | Total packets | Discarded packets |
| A | 0 | 14457 | 0 |
| B | 0 | 14728 | 0 |
| C | 0 | 15044 | 0 |
| D | 0 | 22922 | 0 |
| Mode M9 | |||
|---|---|---|---|
| Quadrant | BADHDUFLAG | Total packets | Discarded packets |
| A | 0 | 13 | 0 |
| B | 0 | 14 | 0 |
| C | 0 | 14 | 0 |
| D | 0 | 14 | 0 |
| Quadrant | Total seconds | Saturated seconds | Saturation percentage |
|---|---|---|---|
| A | 6975 | 72 | 1.032258% |
| B | 6975 | 107 | 1.534050% |
| C | 6975 | 197 | 2.824373% |
| D | 6975 | 482 | 6.910394% |
Noise dominated data is calculated using 1-second bins in cleaned event files. If a bin has >2000 counts, and if more than 50% of those come from <1% of pixels, then it is considered to be noise-dominated and hence unusable.
| Quadrant | # 1 sec bins | Bins with >0 counts | Bins with >2000 counts | High rate bins dominated by noise | Noise dominated (total time) | Noise dominated (detector-on time) | Marked lightcurve |
|---|---|---|---|---|---|---|---|
| A | 7770 | 6976 | 4 | 4 | 0.05% | 0.06% | 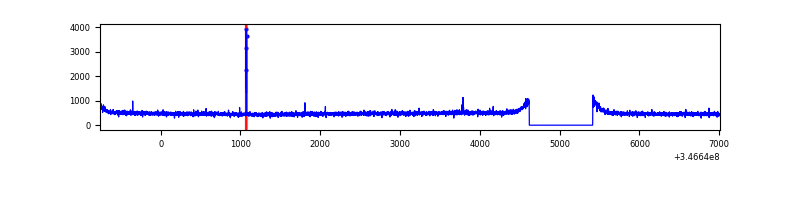 |
| B | 7770 | 6976 | 2 | 2 | 0.03% | 0.03% | 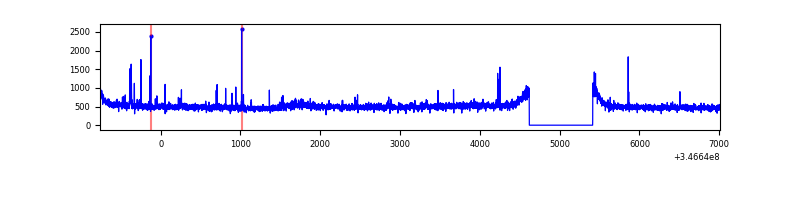 |
| C | 7770 | 6976 | 43 | 43 | 0.55% | 0.62% | 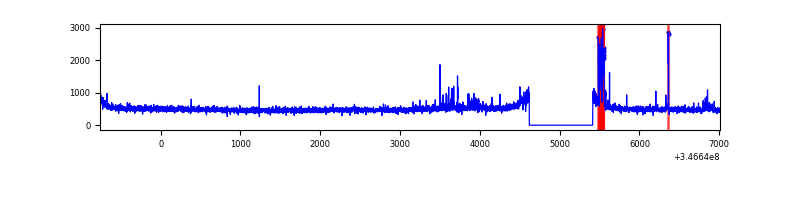 |
| D | 7770 | 6975 | 310 | 310 | 3.99% | 4.44% | 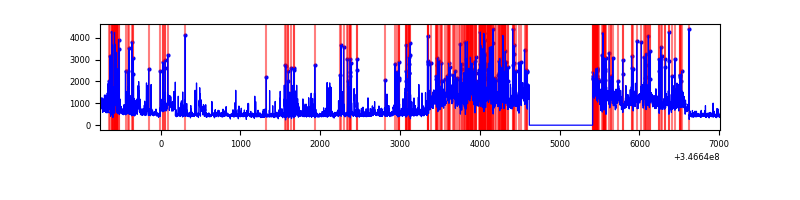 |
Top three noisy pixels from each quadrant. If the there are fewer than three noisy pixels in the level2.evt file, extra rows are filled as -1
| Pixel properties | Quadrant properties | ||||||
|---|---|---|---|---|---|---|---|
| Quadrant | DetID | PixID | Counts | Sigma | Mean | Median | Sigma |
| A | 12 | 96 | 19562 | 105.26 | 877 | 858 | 177.7 |
| A | 13 | 254 | 11213 | 58.27 | 877 | 858 | 177.7 |
| A | 3 | 137 | 8674 | 43.99 | 877 | 858 | 177.7 |
| B | 10 | 245 | 66885 | 388.31 | 878 | 855 | 170.0 |
| B | 10 | 246 | 25623 | 145.66 | 878 | 855 | 170.0 |
| B | 0 | 230 | 24371 | 138.29 | 878 | 855 | 170.0 |
| C | 3 | 233 | 236830 | 1189.13 | 842 | 848 | 198.4 |
| C | 14 | 238 | 134024 | 671.08 | 842 | 848 | 198.4 |
| C | 14 | 128 | 6355 | 27.75 | 842 | 848 | 198.4 |
| D | 8 | 195 | 1622336 | 8143.22 | 827 | 806 | 199.1 |
| D | 1 | 52 | 1231440 | 6180.17 | 827 | 806 | 199.1 |
| D | 2 | 250 | 119211 | 594.62 | 827 | 806 | 199.1 |
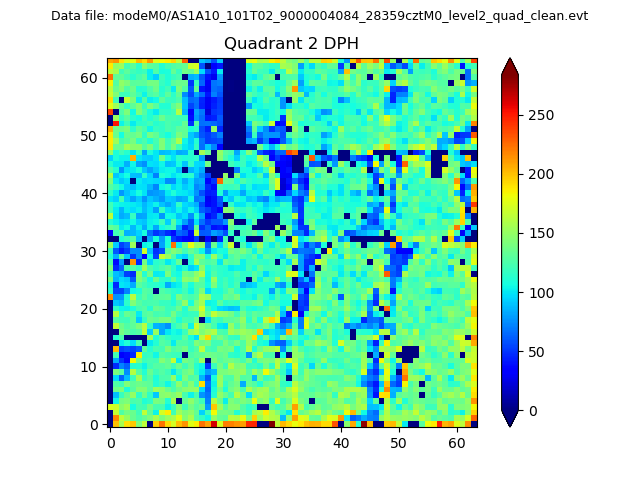
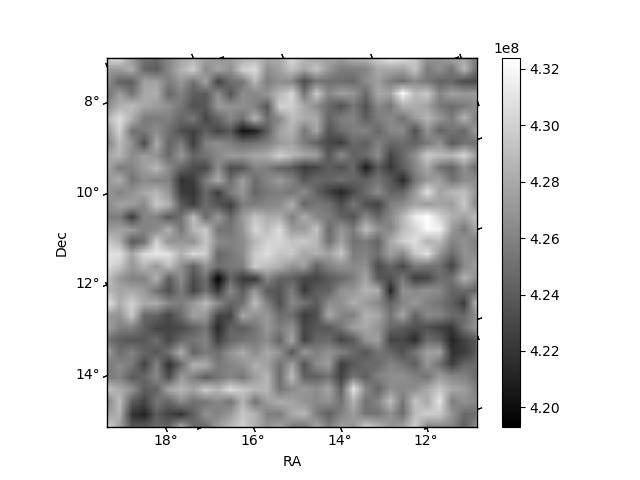
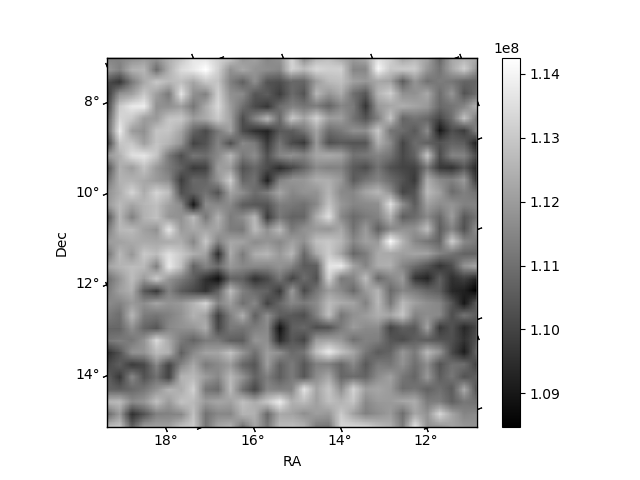
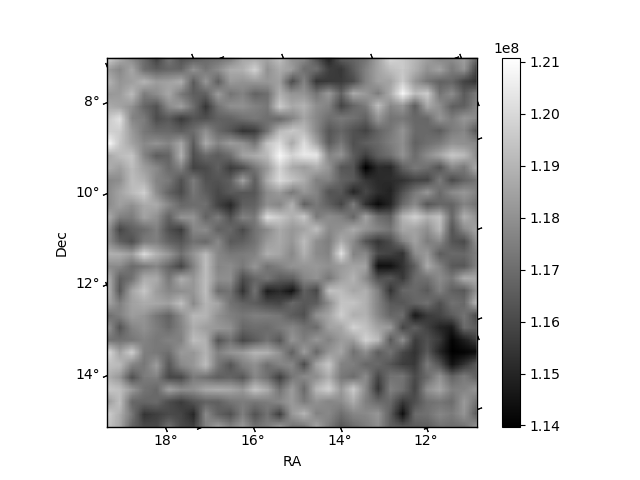
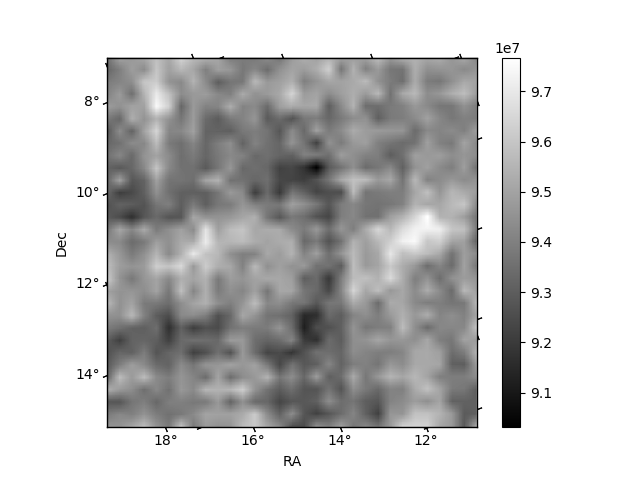
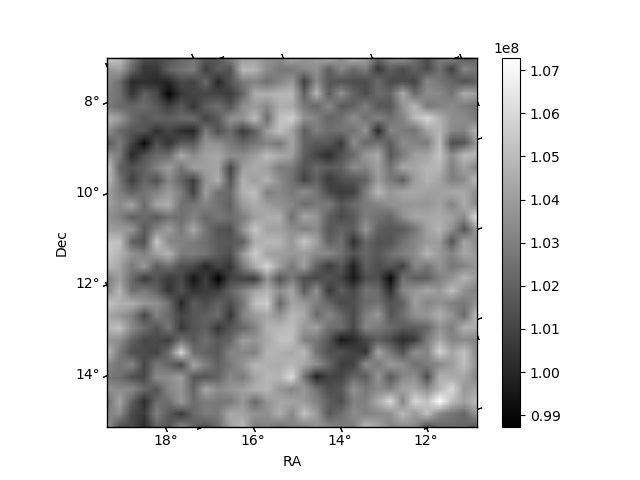
Histogram calculated using DETX and DETY for each event in the final _common_clean file
| Quadrant A | 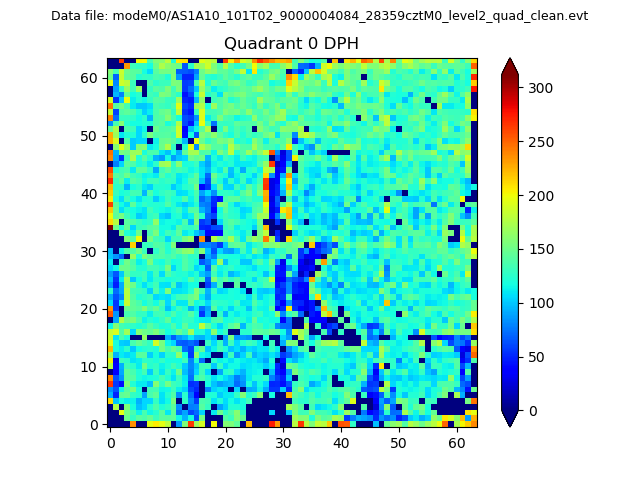 |
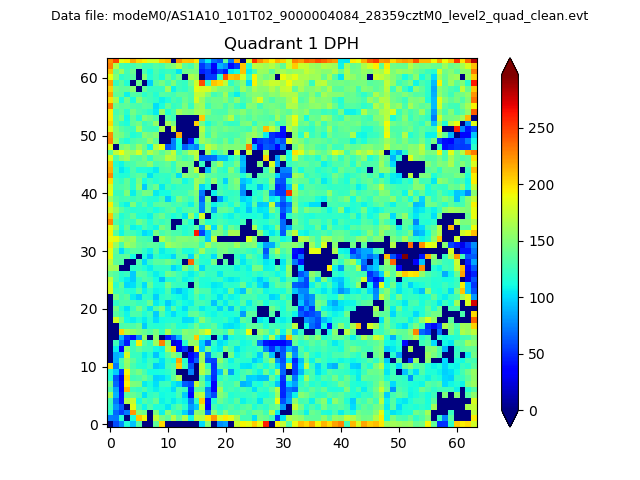 |
Quadrant B |
|---|---|---|---|
| Quadrant D | 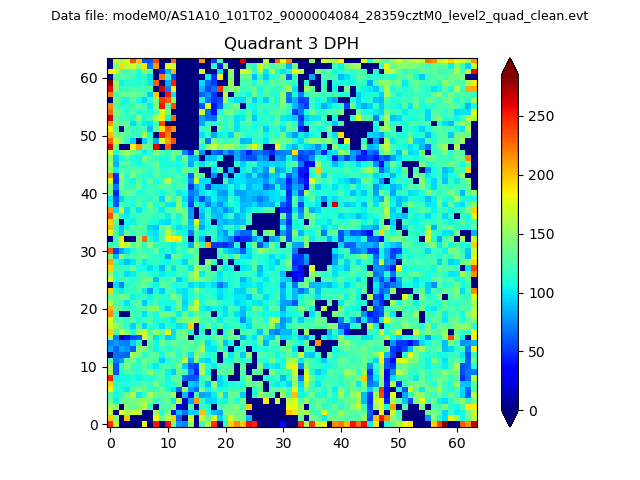 |
 |
Quadrant C |
| Plot type | Count rate plots | Images |
|---|---|---|
| Comparison with Poisson distribution Blue bars denote a histogram of data divided into 1 sec bins. Red curve is a Poisson curve with rate = median count rate of data. |
 |
 |
| Quadrant-wise count rates Data is divided into 100 sec bins |
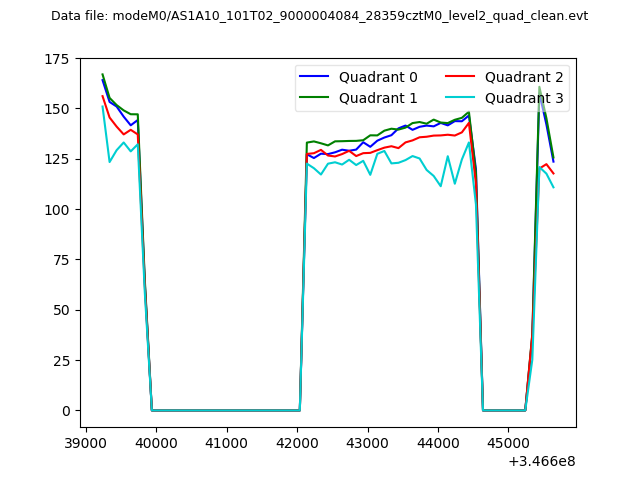 |
|
| Module-wise count rates for Quadrant A Data is divided into 100 sec bins |
 |
 |
| Module-wise count rates for Quadrant B Data is divided into 100 sec bins |
 |
 |
| Module-wise count rates for Quadrant C Data is divided into 100 sec bins |
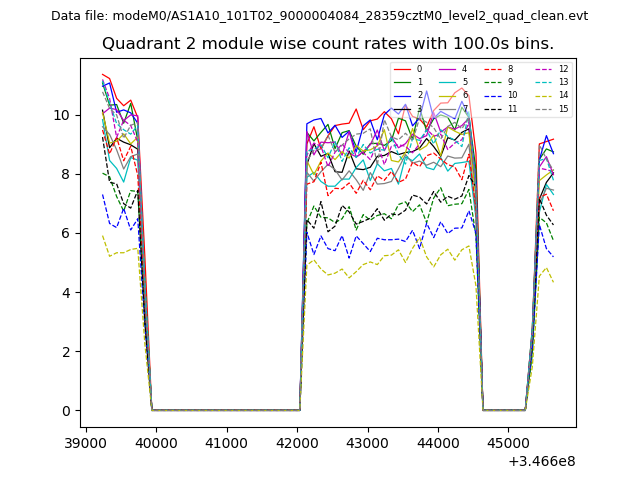 |
 |
| Module-wise count rates for Quadrant D Data is divided into 100 sec bins |
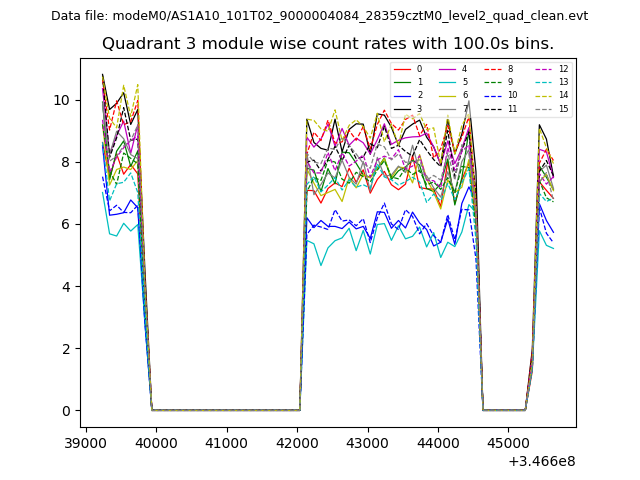 |
 |
| Parameter | Plot |
|---|---|
| CZT HV Monitor |  |
| D_VDD | 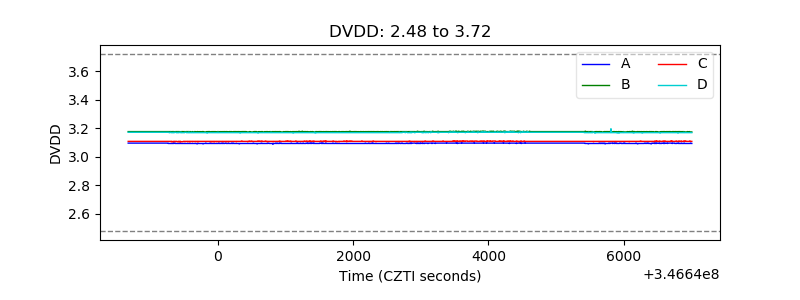 |
| Temperature 1 | 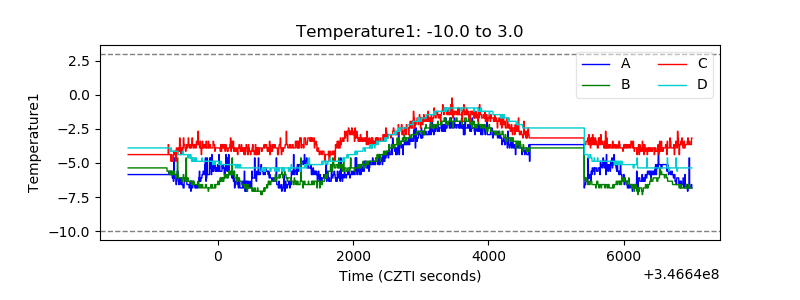 |
| Veto HV Monitor | 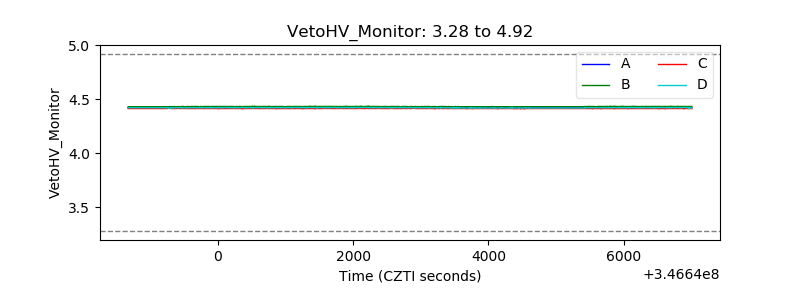 |
| Veto LLD | 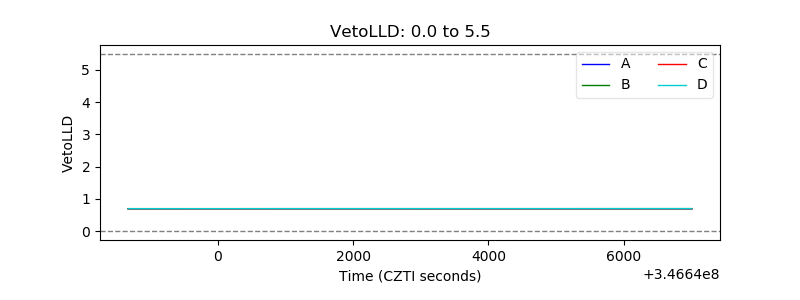 |
| Alpha Counter | 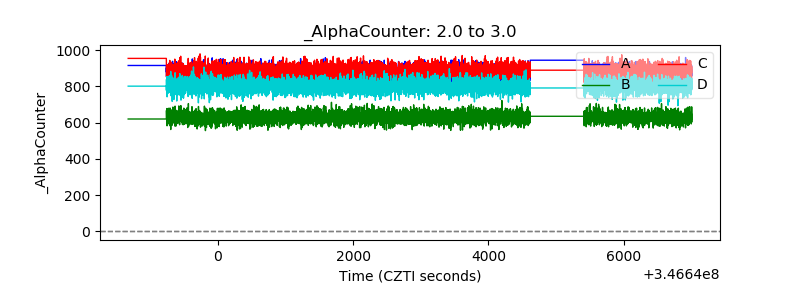 |
| _CPM_Rate | 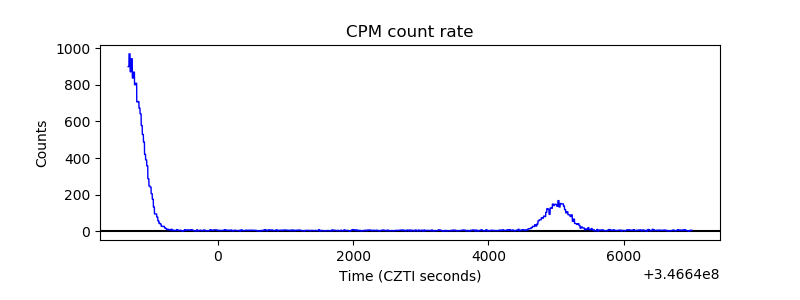 |
| CZT Counter | 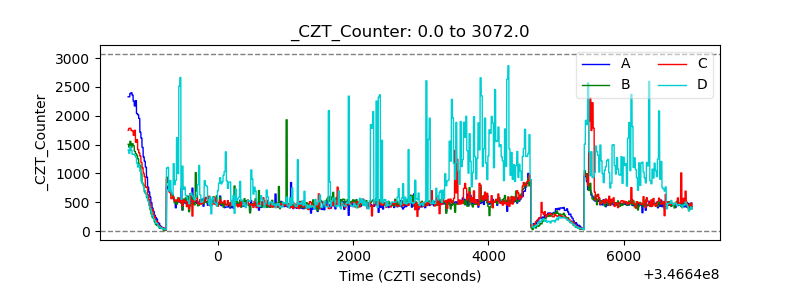 |
| +2.5 Volts monitor |  |
| +5 Volts monitor |  |
| _ROLL_ROT | 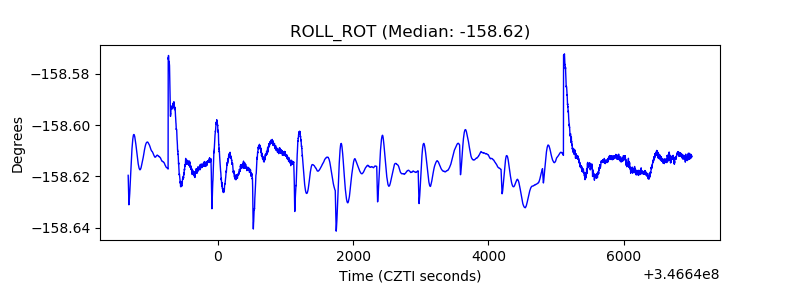 |
| _Roll_DEC | 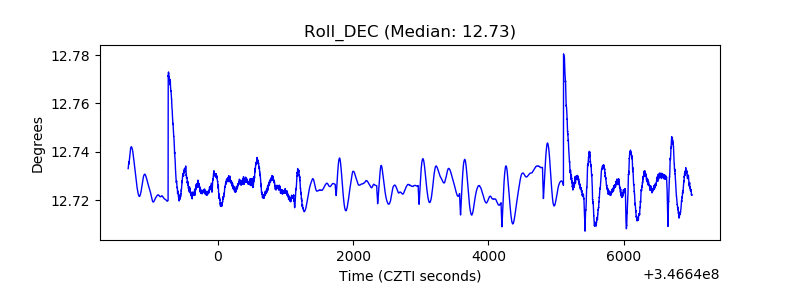 |
| _Roll_RA | 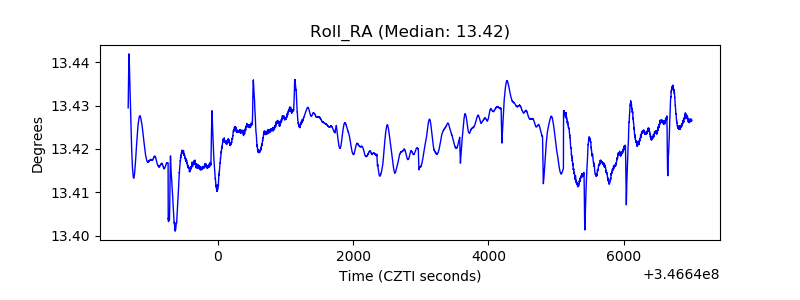 |
| Veto Counter | 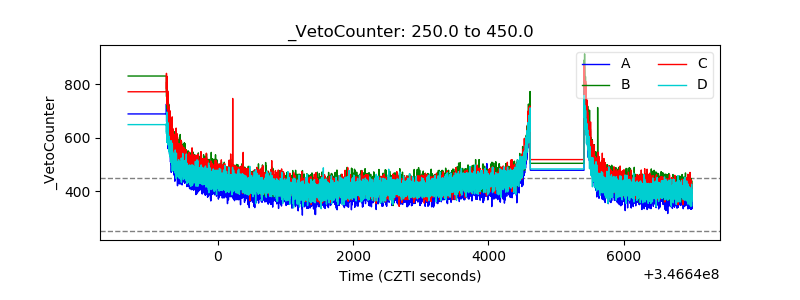 |