| Param | Original file | Final file |
|---|---|---|
| Filename | modeM0/AS1A10_101T02_9000004084_28360cztM0_level2.evt | modeM0/AS1A10_101T02_9000004084_28360cztM0_level2_quad_clean.evt |
| Size (bytes) | 580,475,520 | 72,694,080 |
| Size | 553.6 MB | 69.3 MB |
| Events in quadrant A | 3,407,888 | 438,701 |
| Events in quadrant B | 3,670,500 | 445,362 |
| Events in quadrant C | 3,523,329 | 425,098 |
| Events in quadrant D | 6,498,600 | 399,177 |
| Mode M0 | |||
|---|---|---|---|
| Quadrant | BADHDUFLAG | Total packets | Discarded packets |
| A | 0 | 14678 | 0 |
| B | 0 | 15274 | 0 |
| C | 0 | 14801 | 0 |
| D | 0 | 24200 | 0 |
| Mode M9 | |||
|---|---|---|---|
| Quadrant | BADHDUFLAG | Total packets | Discarded packets |
| A | 0 | 3 | 0 |
| B | 0 | 3 | 0 |
| C | 0 | 3 | 0 |
| D | 0 | 3 | 0 |
| Quadrant | Total seconds | Saturated seconds | Saturation percentage |
|---|---|---|---|
| A | 7080 | 138 | 1.949153% |
| B | 7080 | 186 | 2.627119% |
| C | 7080 | 185 | 2.612994% |
| D | 7080 | 510 | 7.203390% |
Noise dominated data is calculated using 1-second bins in cleaned event files. If a bin has >2000 counts, and if more than 50% of those come from <1% of pixels, then it is considered to be noise-dominated and hence unusable.
| Quadrant | # 1 sec bins | Bins with >0 counts | Bins with >2000 counts | High rate bins dominated by noise | Noise dominated (total time) | Noise dominated (detector-on time) | Marked lightcurve |
|---|---|---|---|---|---|---|---|
| A | 7380 | 7081 | 0 | 0 | 0.00% | 0.00% | 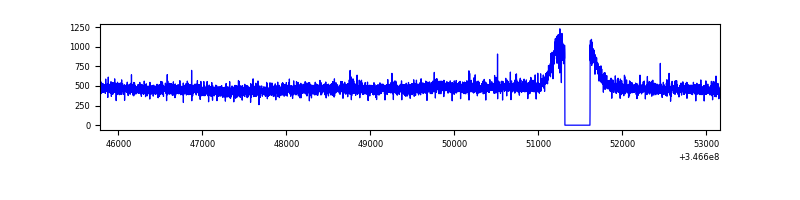 |
| B | 7380 | 7081 | 6 | 6 | 0.08% | 0.08% | 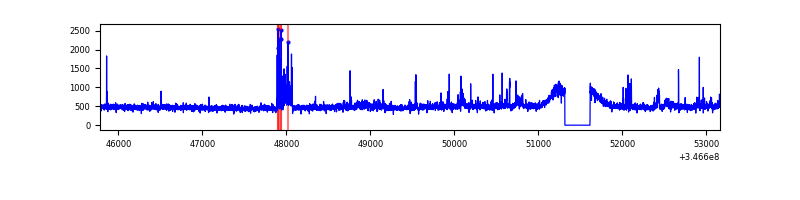 |
| C | 7380 | 7080 | 3 | 3 | 0.04% | 0.04% | 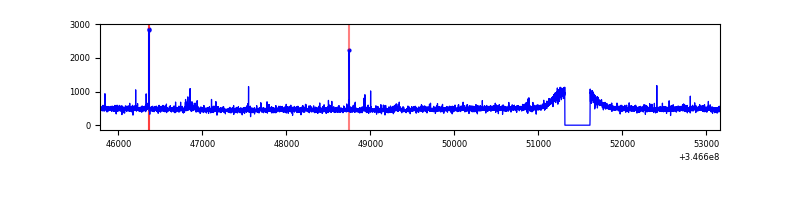 |
| D | 7379 | 7079 | 295 | 295 | 4.00% | 4.17% | 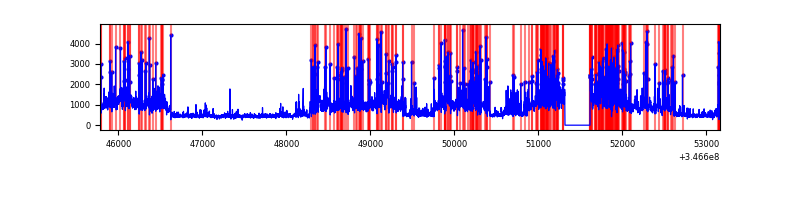 |
Top three noisy pixels from each quadrant. If the there are fewer than three noisy pixels in the level2.evt file, extra rows are filled as -1
| Pixel properties | Quadrant properties | ||||||
|---|---|---|---|---|---|---|---|
| Quadrant | DetID | PixID | Counts | Sigma | Mean | Median | Sigma |
| A | 13 | 254 | 12567 | 65.01 | 882 | 863 | 180.0 |
| A | 3 | 137 | 8961 | 44.98 | 882 | 863 | 180.0 |
| A | 0 | 226 | 7434 | 36.5 | 882 | 863 | 180.0 |
| B | 10 | 245 | 146313 | 841.11 | 877 | 850 | 172.9 |
| B | 10 | 246 | 43911 | 248.99 | 877 | 850 | 172.9 |
| B | 0 | 230 | 35688 | 201.44 | 877 | 850 | 172.9 |
| C | 14 | 238 | 134170 | 661.35 | 849 | 856 | 201.6 |
| C | 3 | 233 | 73610 | 360.92 | 849 | 856 | 201.6 |
| C | 13 | 61 | 5714 | 24.1 | 849 | 856 | 201.6 |
| D | 8 | 195 | 2312424 | 11585.99 | 828 | 807 | 199.5 |
| D | 1 | 52 | 907738 | 4545.6 | 828 | 807 | 199.5 |
| D | 13 | 104 | 58814 | 290.74 | 828 | 807 | 199.5 |
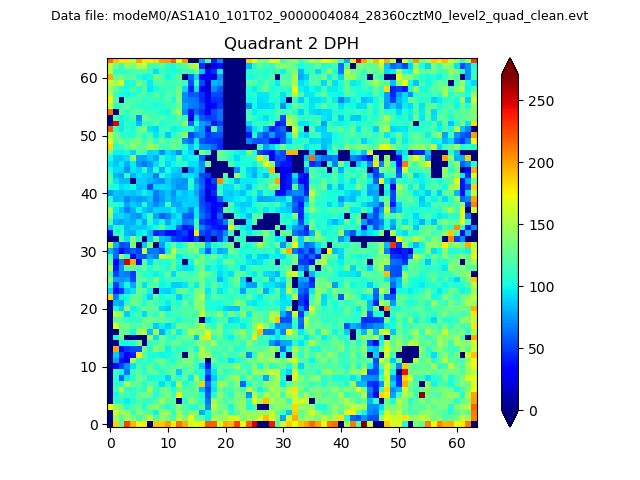
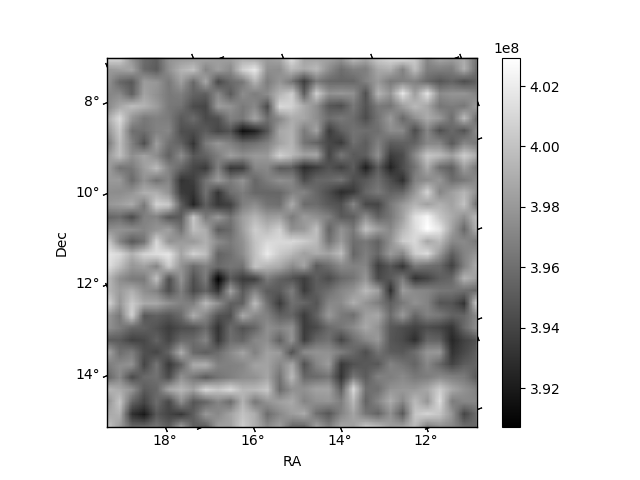
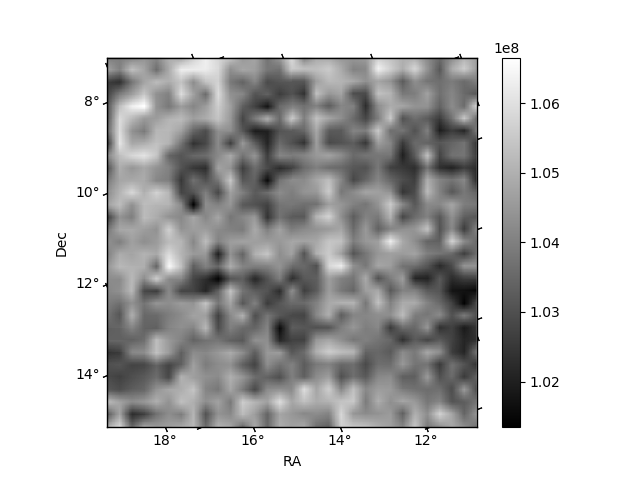
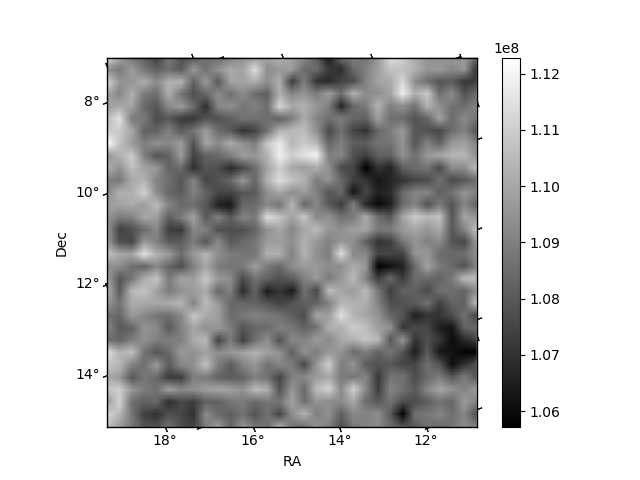
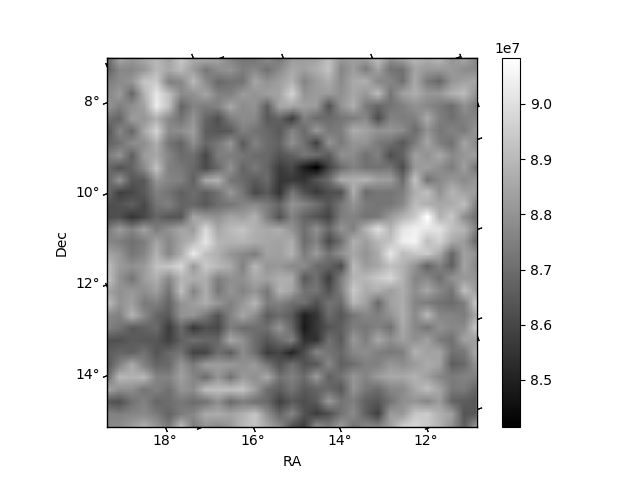
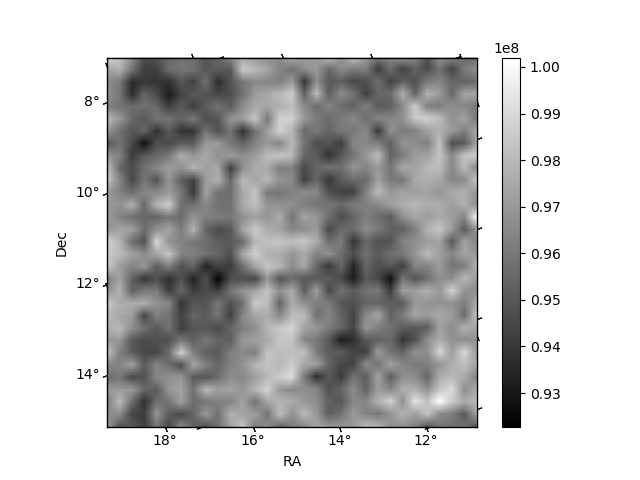
Histogram calculated using DETX and DETY for each event in the final _common_clean file
| Quadrant A | 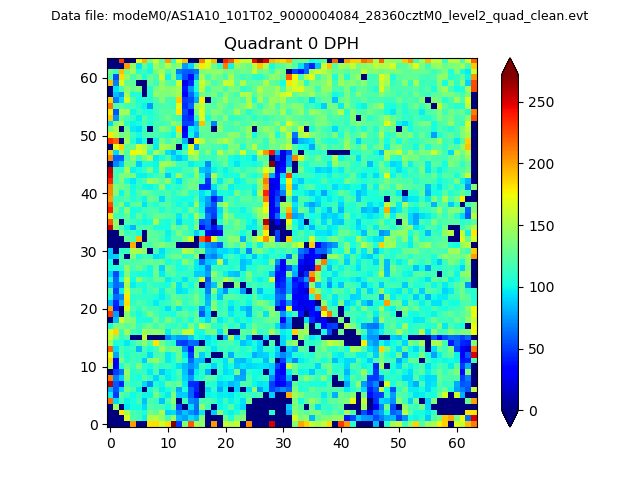 |
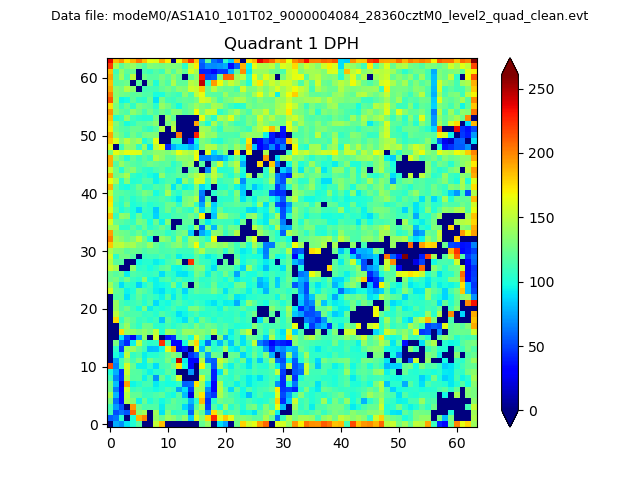 |
Quadrant B |
|---|---|---|---|
| Quadrant D | 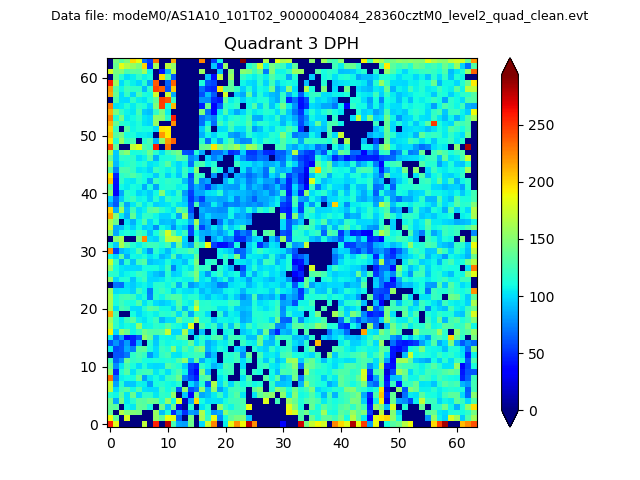 |
 |
Quadrant C |
| Plot type | Count rate plots | Images |
|---|---|---|
| Comparison with Poisson distribution Blue bars denote a histogram of data divided into 1 sec bins. Red curve is a Poisson curve with rate = median count rate of data. |
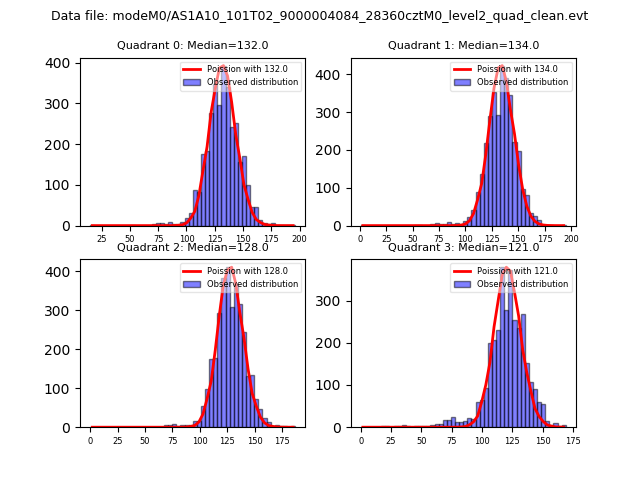 |
 |
| Quadrant-wise count rates Data is divided into 100 sec bins |
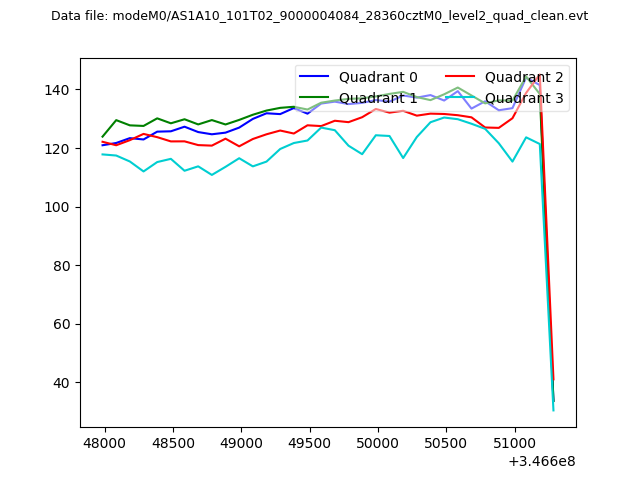 |
|
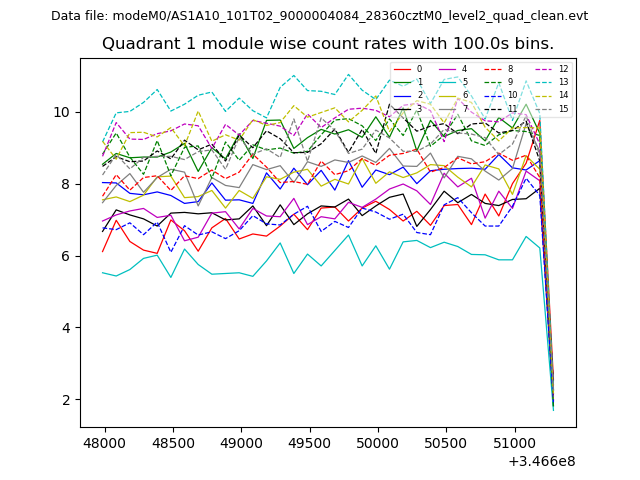
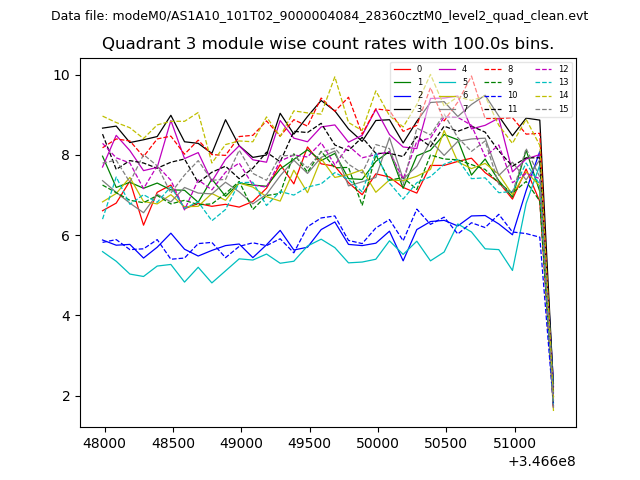
| Module-wise count rates for Quadrant A Data is divided into 100 sec bins |
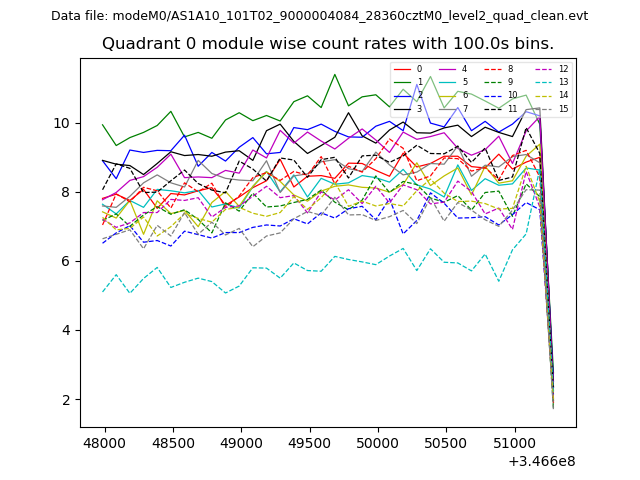 |
 |
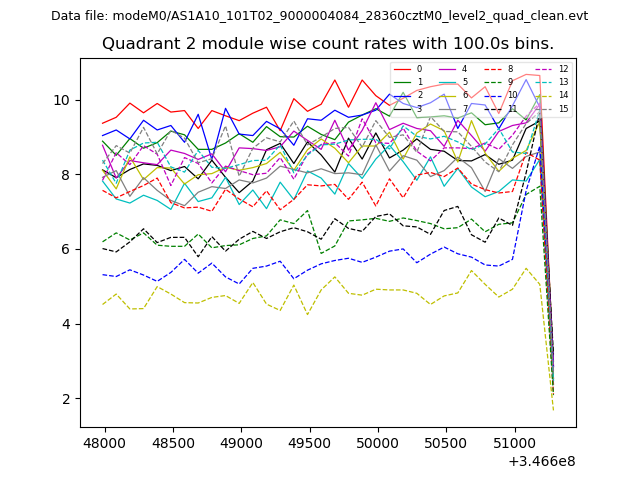
| Module-wise count rates for Quadrant B Data is divided into 100 sec bins |
 |
 |
| Module-wise count rates for Quadrant C Data is divided into 100 sec bins |
 |
 |
| Module-wise count rates for Quadrant D Data is divided into 100 sec bins |
 |
 |
| Parameter | Plot |
|---|---|
| CZT HV Monitor | 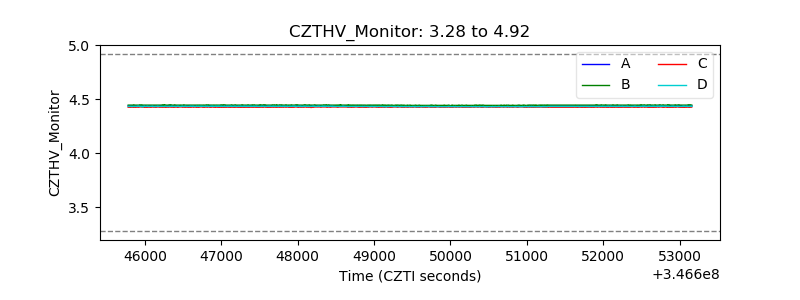 |
| D_VDD | 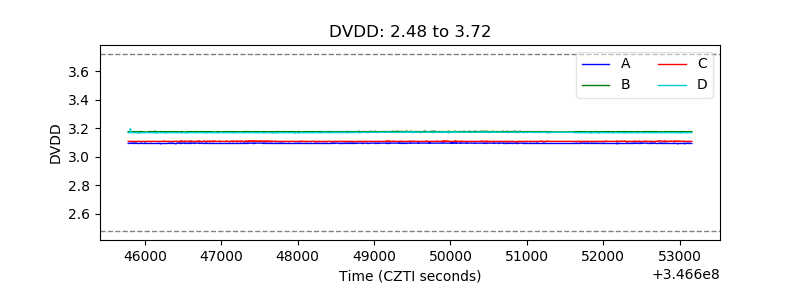 |
| Temperature 1 | 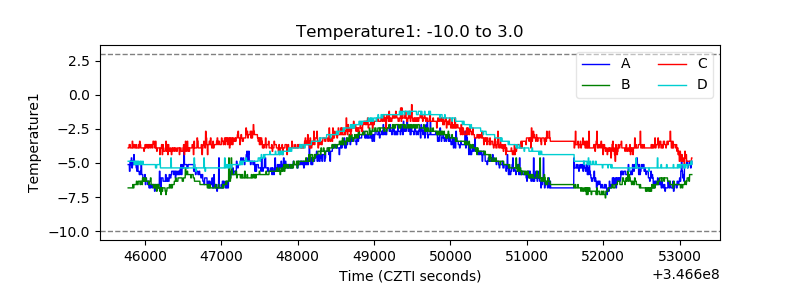 |
| Veto HV Monitor | 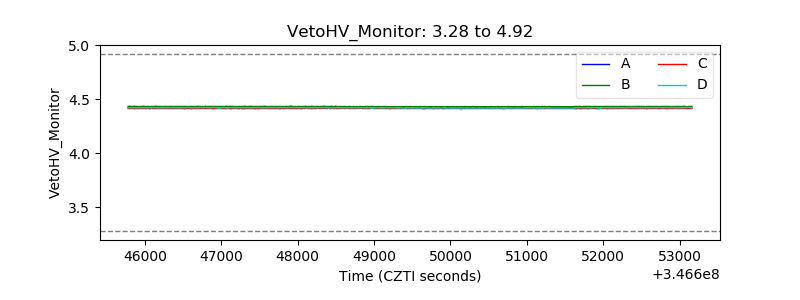 |
| Veto LLD | 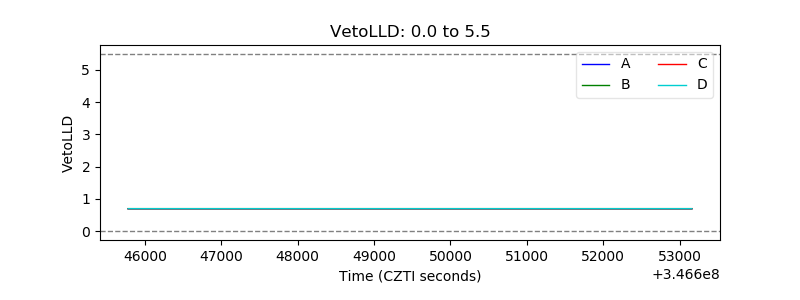 |
| Alpha Counter | 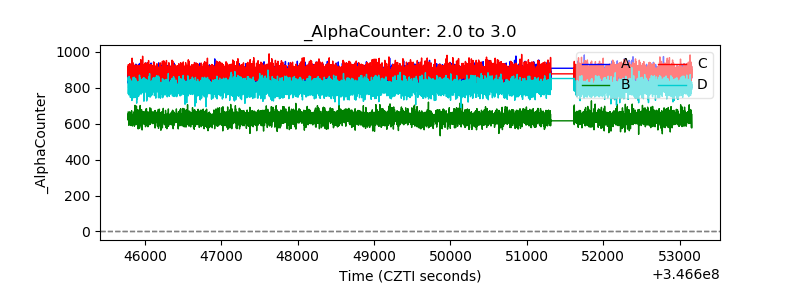 |
| _CPM_Rate | 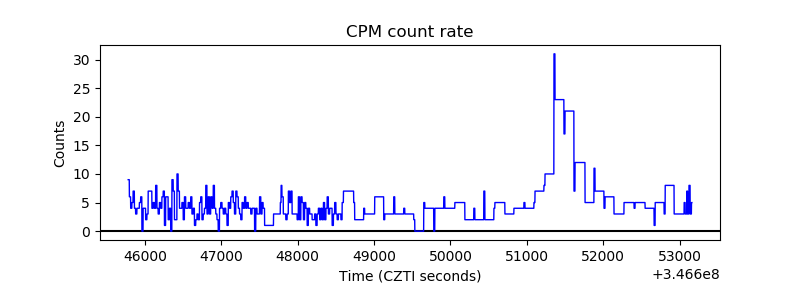 |
| CZT Counter | 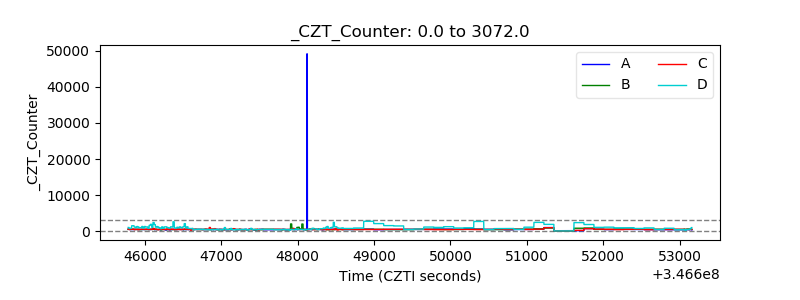 |
| +2.5 Volts monitor |  |
| +5 Volts monitor |  |
| _ROLL_ROT |  |
| _Roll_DEC | 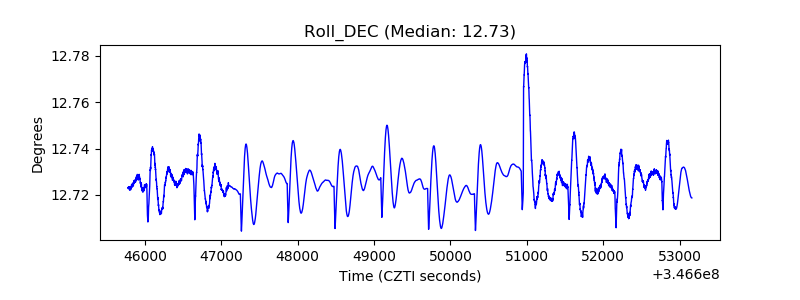 |
| _Roll_RA | 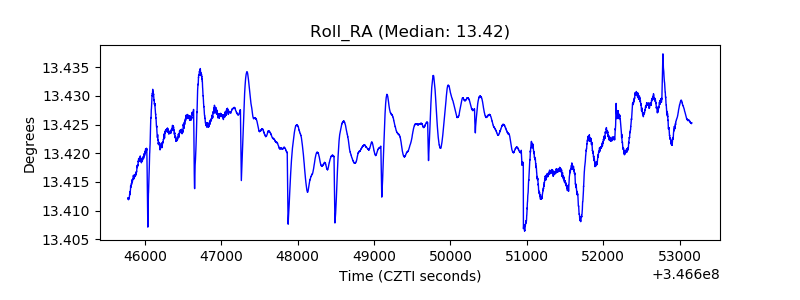 |
| Veto Counter | 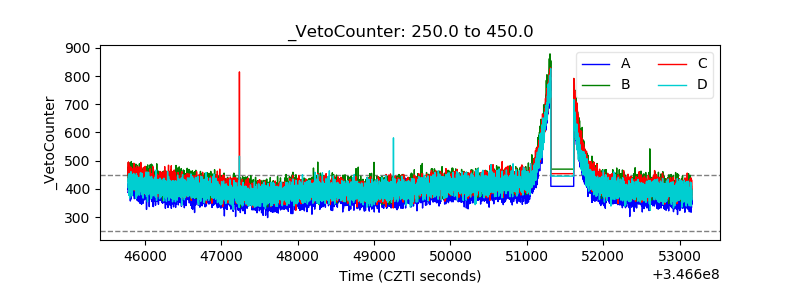 |