| Param | Original file | Final file |
|---|---|---|
| Filename | modeM0/AS1A10_101T02_9000004084_28361cztM0_level2.evt | modeM0/AS1A10_101T02_9000004084_28361cztM0_level2_quad_clean.evt |
| Size (bytes) | 651,502,080 | 76,308,480 |
| Size | 621.3 MB | 72.8 MB |
| Events in quadrant A | 3,620,757 | 460,232 |
| Events in quadrant B | 4,785,721 | 461,320 |
| Events in quadrant C | 3,690,247 | 446,288 |
| Events in quadrant D | 7,125,951 | 420,569 |
| Mode M0 | |||
|---|---|---|---|
| Quadrant | BADHDUFLAG | Total packets | Discarded packets |
| A | 0 | 15590 | 0 |
| B | 0 | 18987 | 0 |
| C | 0 | 15645 | 0 |
| D | 0 | 26303 | 0 |
| Quadrant | Total seconds | Saturated seconds | Saturation percentage |
|---|---|---|---|
| A | 7503 | 206 | 2.745568% |
| B | 7503 | 363 | 4.838065% |
| C | 7503 | 223 | 2.972144% |
| D | 7503 | 934 | 12.448354% |
Noise dominated data is calculated using 1-second bins in cleaned event files. If a bin has >2000 counts, and if more than 50% of those come from <1% of pixels, then it is considered to be noise-dominated and hence unusable.
| Quadrant | # 1 sec bins | Bins with >0 counts | Bins with >2000 counts | High rate bins dominated by noise | Noise dominated (total time) | Noise dominated (detector-on time) | Marked lightcurve |
|---|---|---|---|---|---|---|---|
| A | 7503 | 7503 | 1 | 1 | 0.01% | 0.01% | 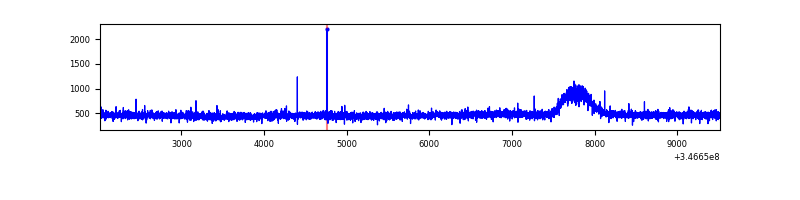 |
| B | 7503 | 7503 | 38 | 38 | 0.51% | 0.51% | 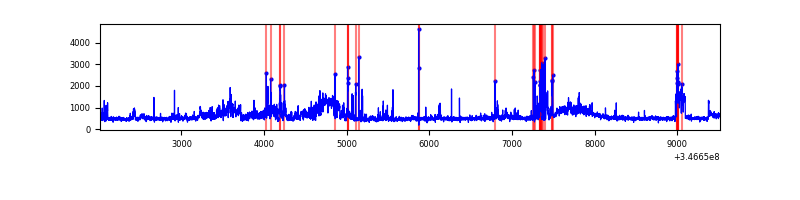 |
| C | 7503 | 7503 | 0 | 0 | 0.00% | 0.00% | 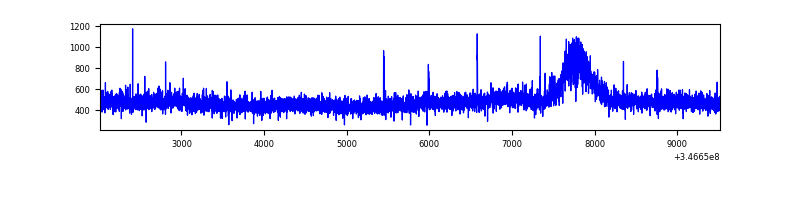 |
| D | 7503 | 7503 | 581 | 581 | 7.74% | 7.74% | 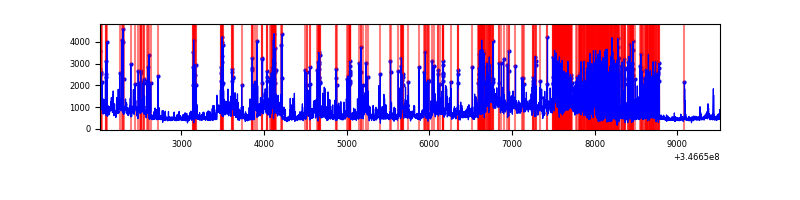 |
Top three noisy pixels from each quadrant. If the there are fewer than three noisy pixels in the level2.evt file, extra rows are filled as -1
| Pixel properties | Quadrant properties | ||||||
|---|---|---|---|---|---|---|---|
| Quadrant | DetID | PixID | Counts | Sigma | Mean | Median | Sigma |
| A | 13 | 254 | 13269 | 64.91 | 937 | 912 | 190.4 |
| A | 3 | 137 | 9606 | 45.67 | 937 | 912 | 190.4 |
| A | 0 | 226 | 7821 | 36.29 | 937 | 912 | 190.4 |
| B | 10 | 245 | 1026938 | 5720.94 | 924 | 898 | 179.3 |
| B | 10 | 246 | 102712 | 567.69 | 924 | 898 | 179.3 |
| B | 0 | 230 | 25445 | 136.87 | 924 | 898 | 179.3 |
| C | 14 | 238 | 141875 | 661.75 | 901 | 908 | 213.0 |
| C | 3 | 233 | 29023 | 131.98 | 901 | 908 | 213.0 |
| C | 13 | 61 | 6228 | 24.97 | 901 | 908 | 213.0 |
| D | 1 | 52 | 2565645 | 12515.03 | 848 | 825 | 204.9 |
| D | 8 | 195 | 1094229 | 5335.26 | 848 | 825 | 204.9 |
| D | 13 | 104 | 133872 | 649.2 | 848 | 825 | 204.9 |
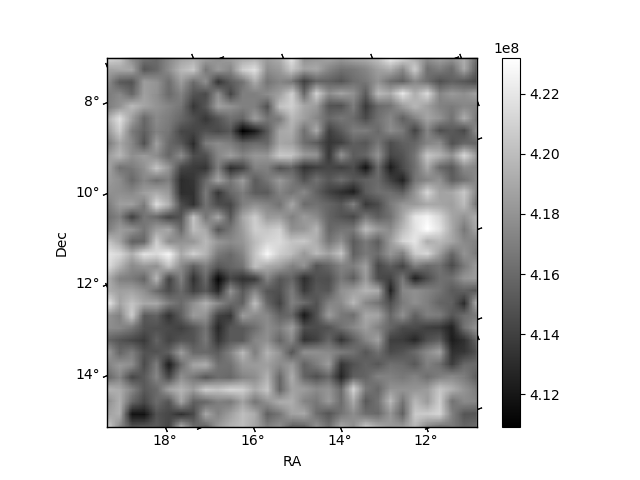
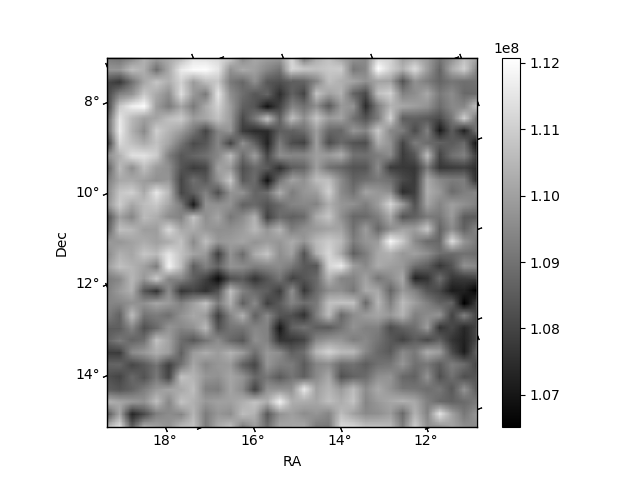
Histogram calculated using DETX and DETY for each event in the final _common_clean file
| Quadrant A | 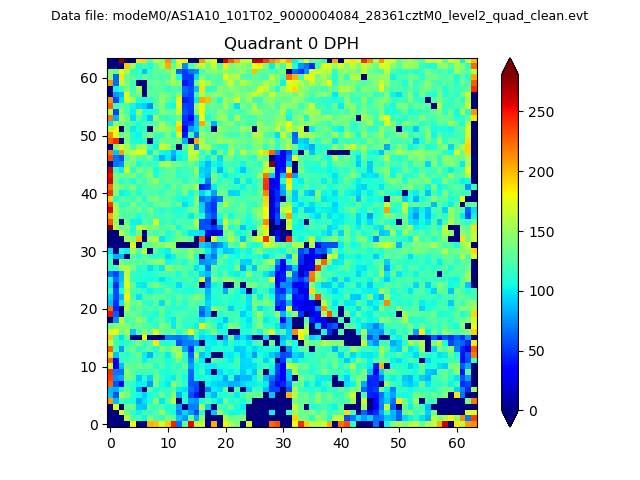 |
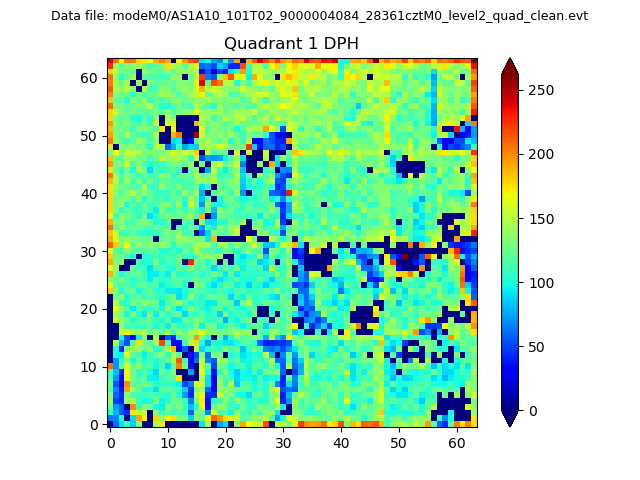 |
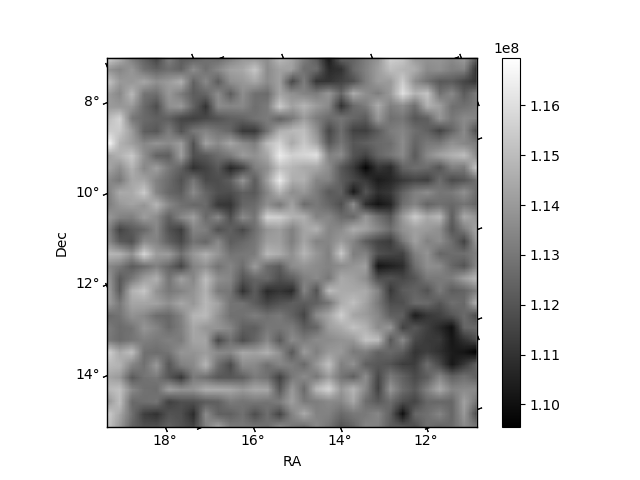
Quadrant B |
|---|---|---|---|
| Quadrant D | 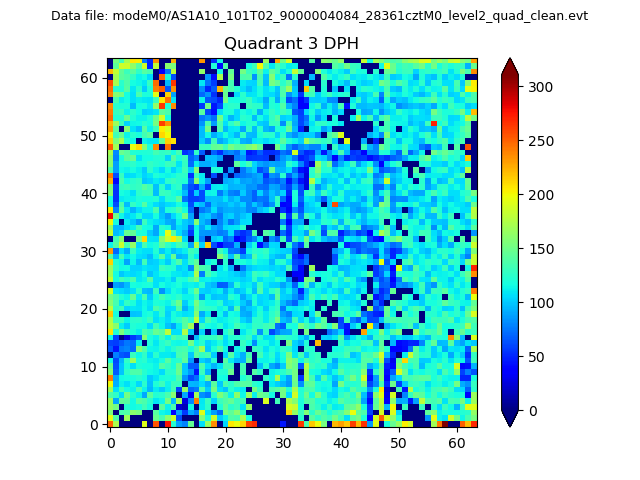 |
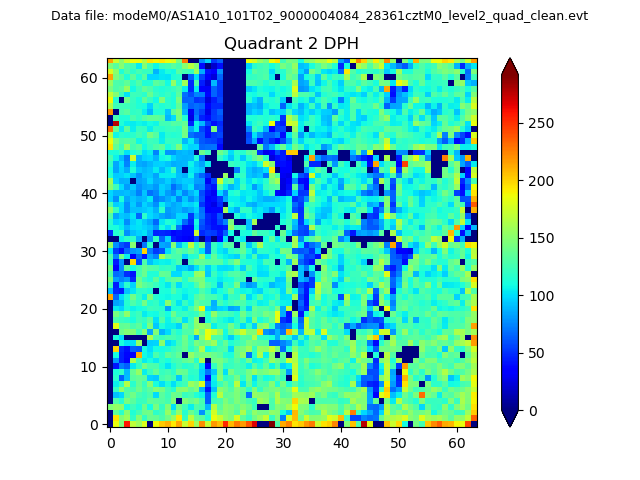 |
Quadrant C |
| Plot type | Count rate plots | Images |
|---|---|---|
| Comparison with Poisson distribution Blue bars denote a histogram of data divided into 1 sec bins. Red curve is a Poisson curve with rate = median count rate of data. |
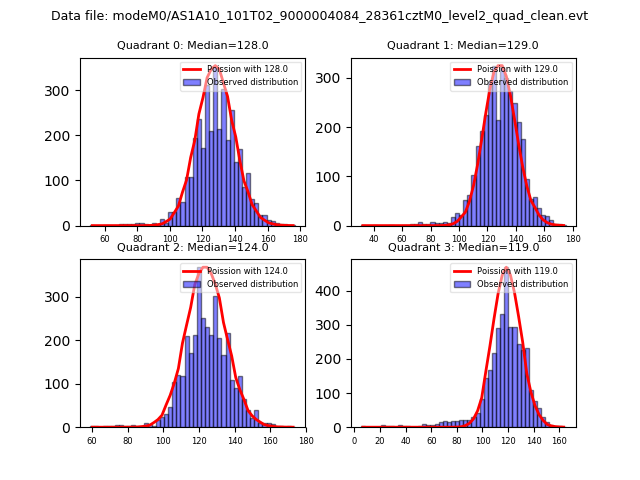 |
 |
| Quadrant-wise count rates Data is divided into 100 sec bins |
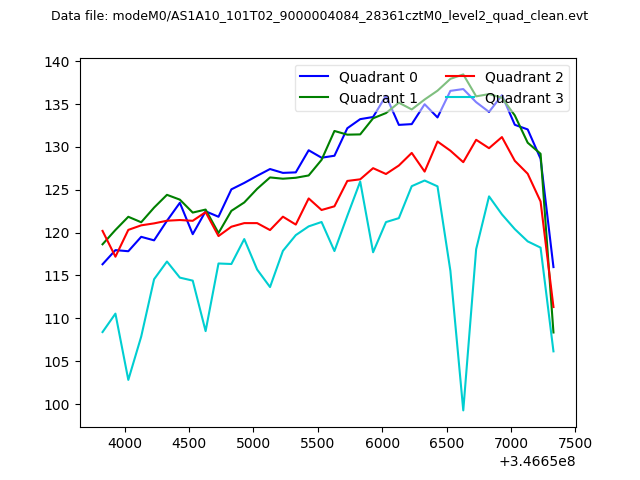 |
|
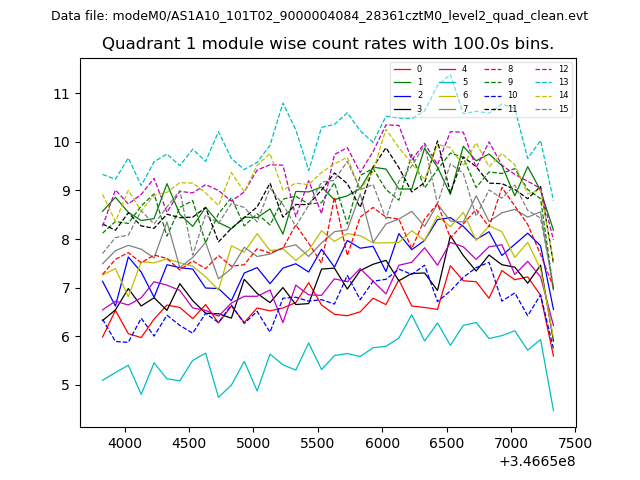
| Module-wise count rates for Quadrant A Data is divided into 100 sec bins |
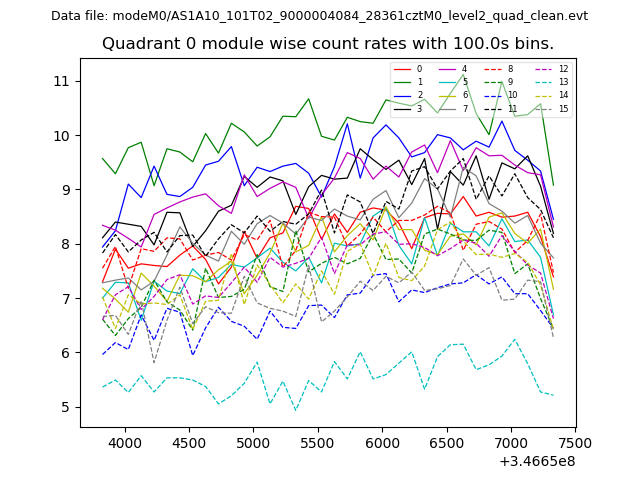 |
 |
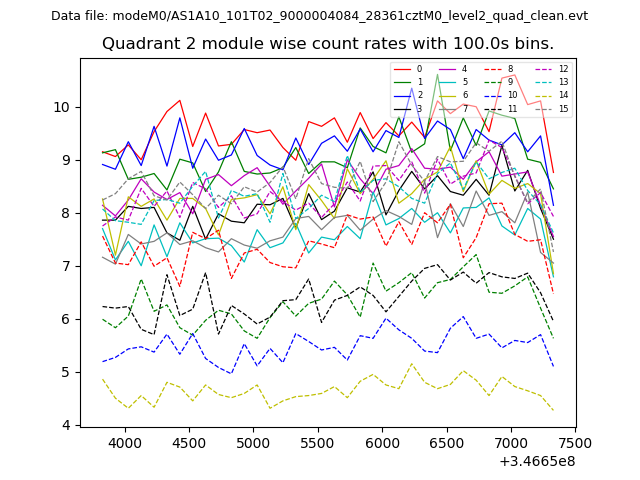
| Module-wise count rates for Quadrant B Data is divided into 100 sec bins |
 |
 |
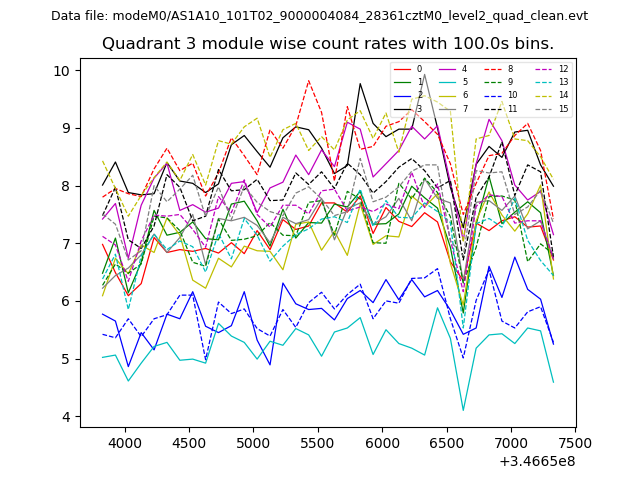
| Module-wise count rates for Quadrant C Data is divided into 100 sec bins |
 |
 |
| Module-wise count rates for Quadrant D Data is divided into 100 sec bins |
 |
 |
| Parameter | Plot |
|---|---|
| CZT HV Monitor | 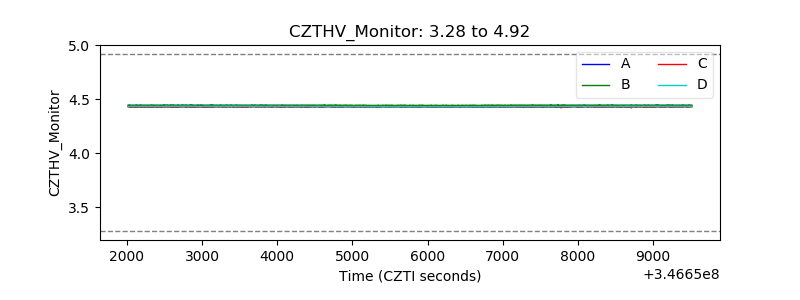 |
| D_VDD | 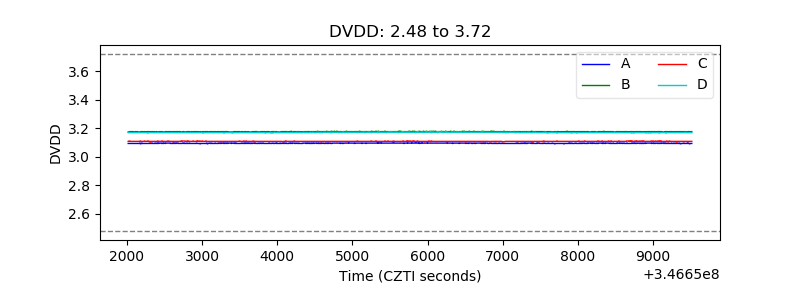 |
| Temperature 1 | 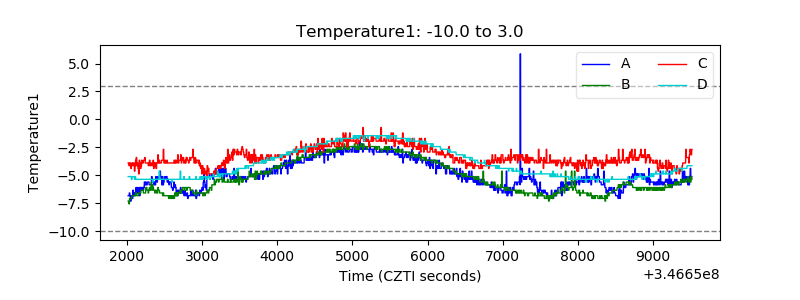 |
| Veto HV Monitor | 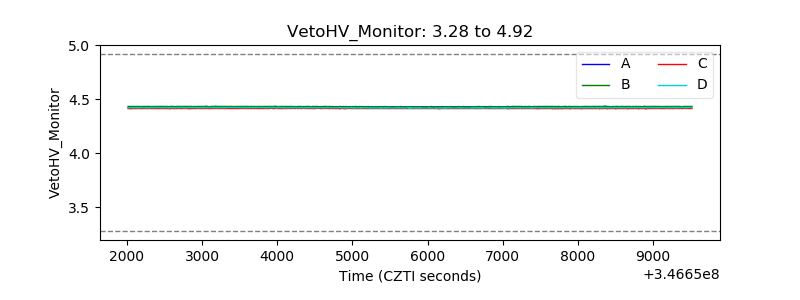 |
| Veto LLD | 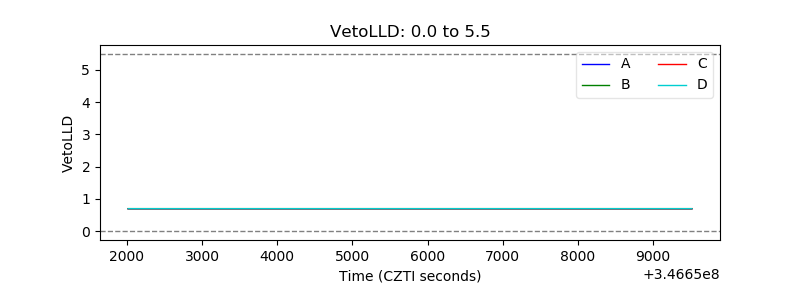 |
| Alpha Counter | 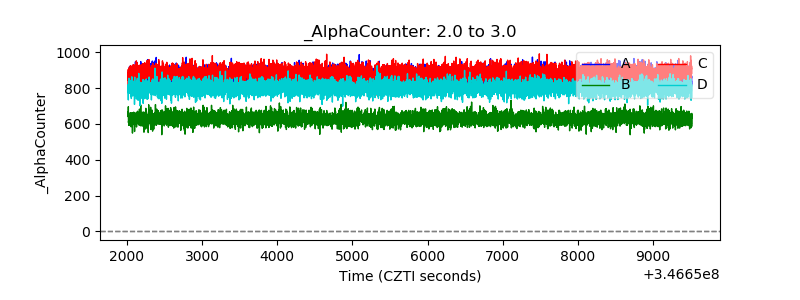 |
| _CPM_Rate | 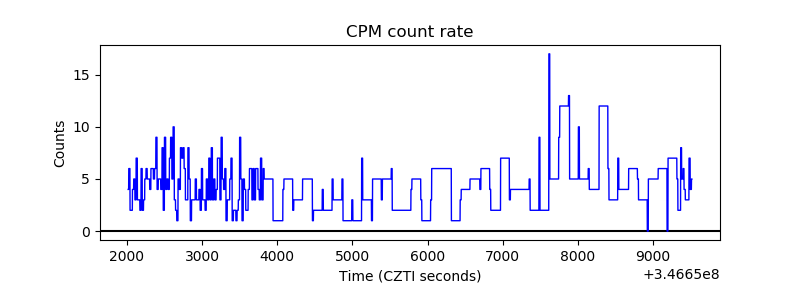 |
| CZT Counter | 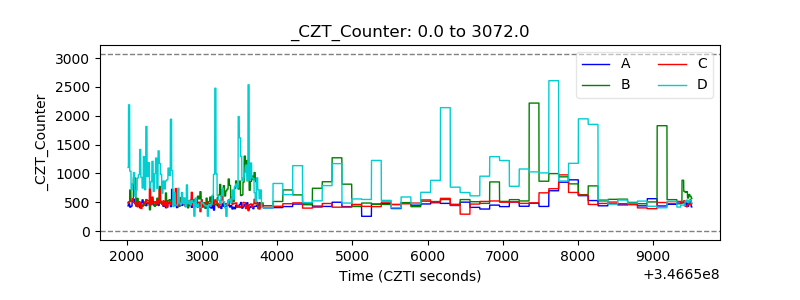 |
| +2.5 Volts monitor |  |
| +5 Volts monitor | 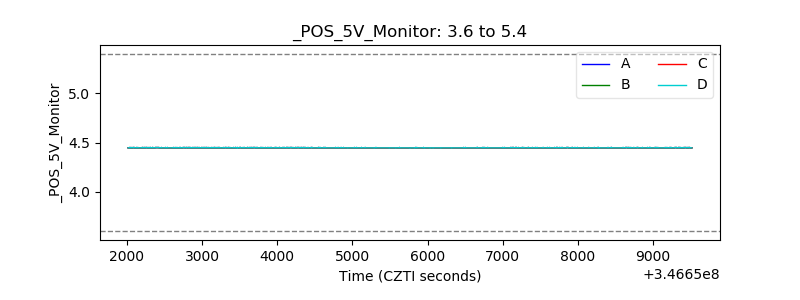 |
| _ROLL_ROT | 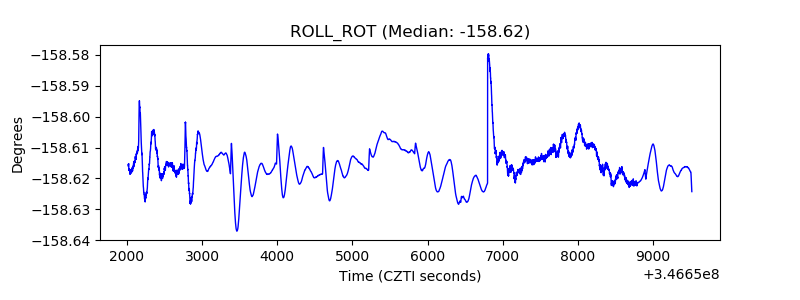 |
| _Roll_DEC | 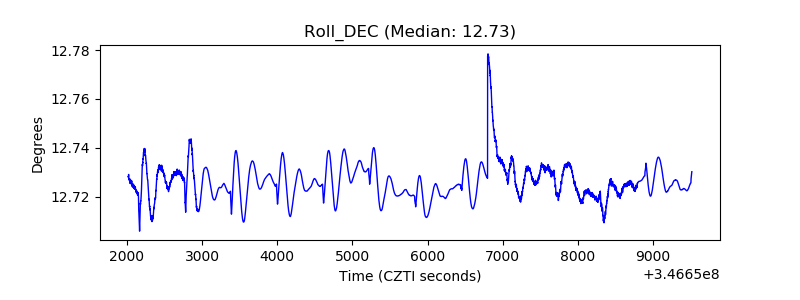 |
| _Roll_RA | 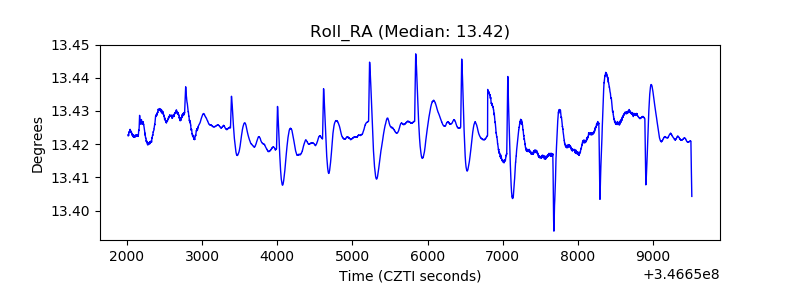 |
| Veto Counter | 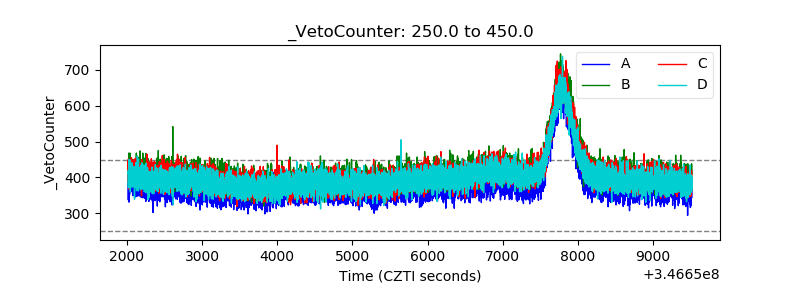 |