| Param | Original file | Final file |
|---|---|---|
| Filename | modeM0/AS1A10_101T02_9000004084_28362cztM0_level2.evt | modeM0/AS1A10_101T02_9000004084_28362cztM0_level2_quad_clean.evt |
| Size (bytes) | 651,041,280 | 81,429,120 |
| Size | 620.9 MB | 77.7 MB |
| Events in quadrant A | 3,540,635 | 501,299 |
| Events in quadrant B | 4,524,268 | 503,590 |
| Events in quadrant C | 3,623,975 | 486,172 |
| Events in quadrant D | 7,516,627 | 448,934 |
| Mode M0 | |||
|---|---|---|---|
| Quadrant | BADHDUFLAG | Total packets | Discarded packets |
| A | 0 | 15385 | 0 |
| B | 0 | 18080 | 0 |
| C | 0 | 15447 | 0 |
| D | 0 | 27476 | 0 |
| Mode M9 | |||
|---|---|---|---|
| Quadrant | BADHDUFLAG | Total packets | Discarded packets |
| A | 0 | 2 | 0 |
| B | 0 | 2 | 0 |
| C | 0 | 2 | 0 |
| D | 0 | 2 | 0 |
| Quadrant | Total seconds | Saturated seconds | Saturation percentage |
|---|---|---|---|
| A | 7549 | 117 | 1.549874% |
| B | 7550 | 273 | 3.615894% |
| C | 7550 | 150 | 1.986755% |
| D | 7550 | 821 | 10.874172% |
Noise dominated data is calculated using 1-second bins in cleaned event files. If a bin has >2000 counts, and if more than 50% of those come from <1% of pixels, then it is considered to be noise-dominated and hence unusable.
| Quadrant | # 1 sec bins | Bins with >0 counts | Bins with >2000 counts | High rate bins dominated by noise | Noise dominated (total time) | Noise dominated (detector-on time) | Marked lightcurve |
|---|---|---|---|---|---|---|---|
| A | 7799 | 7549 | 0 | 0 | 0.00% | 0.00% | 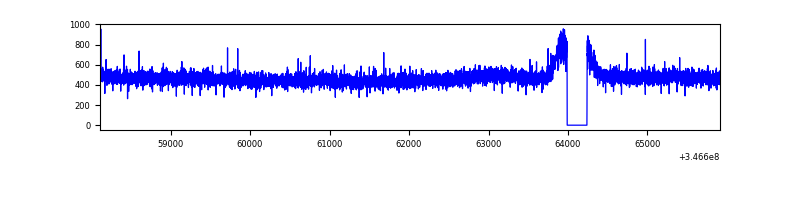 |
| B | 7800 | 7550 | 97 | 97 | 1.24% | 1.28% | 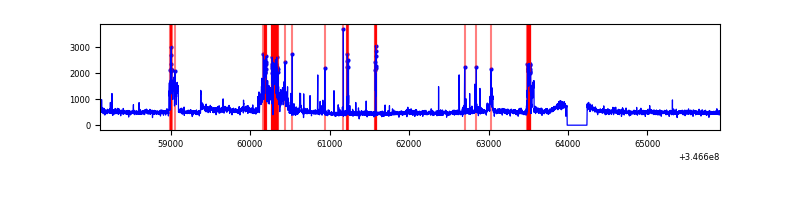 |
| C | 7800 | 7551 | 0 | 0 | 0.00% | 0.00% | 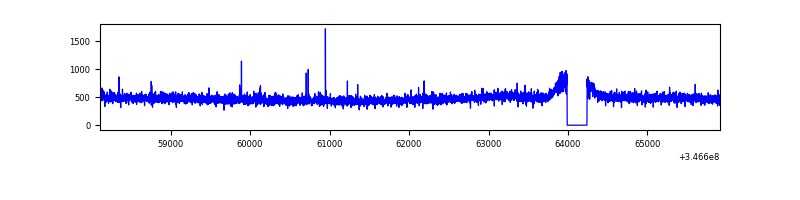 |
| D | 7800 | 7551 | 643 | 643 | 8.24% | 8.52% | 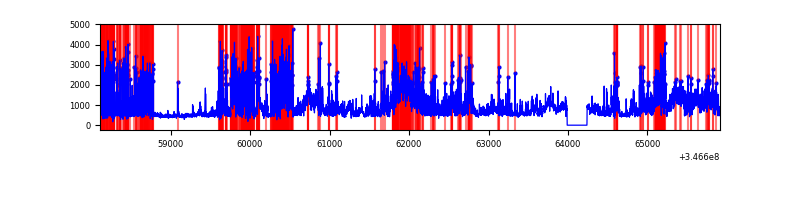 |
Top three noisy pixels from each quadrant. If the there are fewer than three noisy pixels in the level2.evt file, extra rows are filled as -1
| Pixel properties | Quadrant properties | ||||||
|---|---|---|---|---|---|---|---|
| Quadrant | DetID | PixID | Counts | Sigma | Mean | Median | Sigma |
| A | 13 | 254 | 11919 | 58.99 | 918 | 897 | 186.9 |
| A | 3 | 137 | 9590 | 46.52 | 918 | 897 | 186.9 |
| A | 0 | 226 | 7640 | 36.09 | 918 | 897 | 186.9 |
| B | 10 | 245 | 785068 | 4389.31 | 912 | 886 | 178.7 |
| B | 10 | 246 | 110588 | 614.04 | 912 | 886 | 178.7 |
| B | 0 | 230 | 25290 | 136.6 | 912 | 886 | 178.7 |
| C | 14 | 238 | 141009 | 669.83 | 888 | 891 | 209.2 |
| C | 3 | 233 | 20366 | 93.1 | 888 | 891 | 209.2 |
| C | 13 | 61 | 6190 | 25.33 | 888 | 891 | 209.2 |
| D | 1 | 52 | 3591160 | 17430.09 | 858 | 833 | 206.0 |
| D | 8 | 195 | 332163 | 1608.52 | 858 | 833 | 206.0 |
| D | 7 | 238 | 146122 | 705.34 | 858 | 833 | 206.0 |
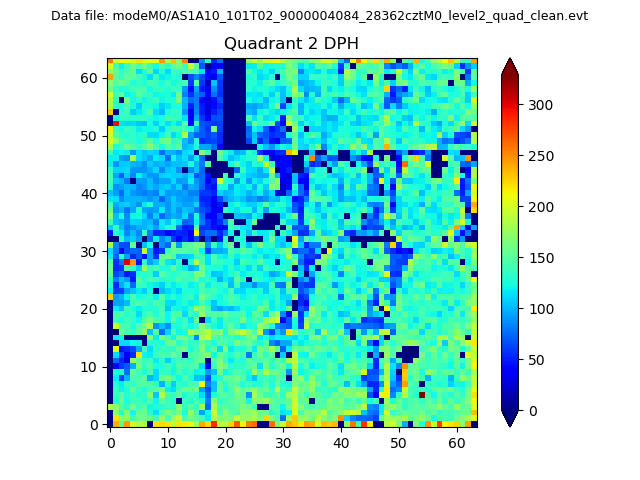
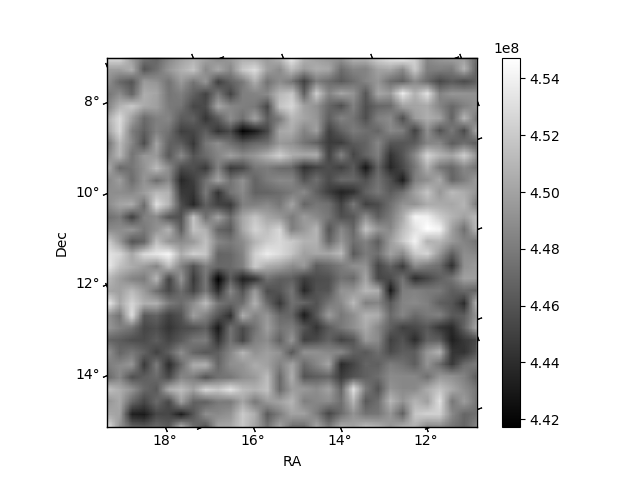
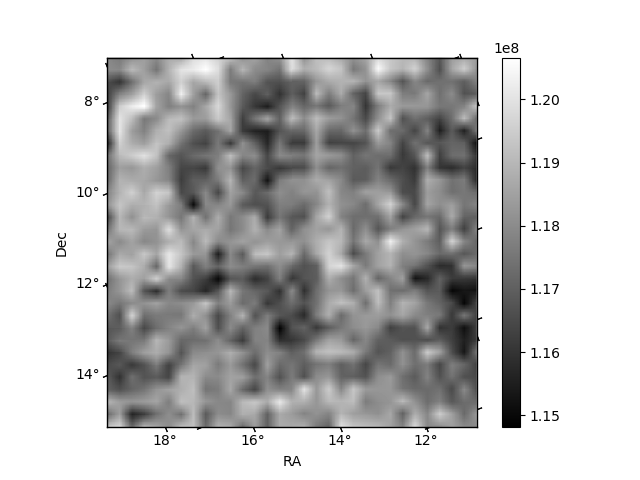
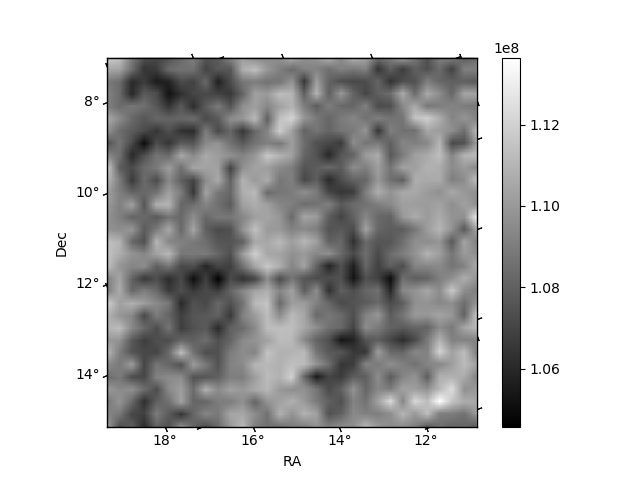
Histogram calculated using DETX and DETY for each event in the final _common_clean file
| Quadrant A | 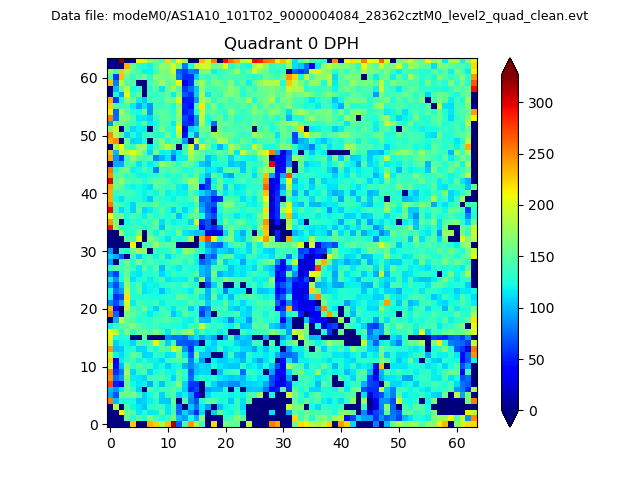 |
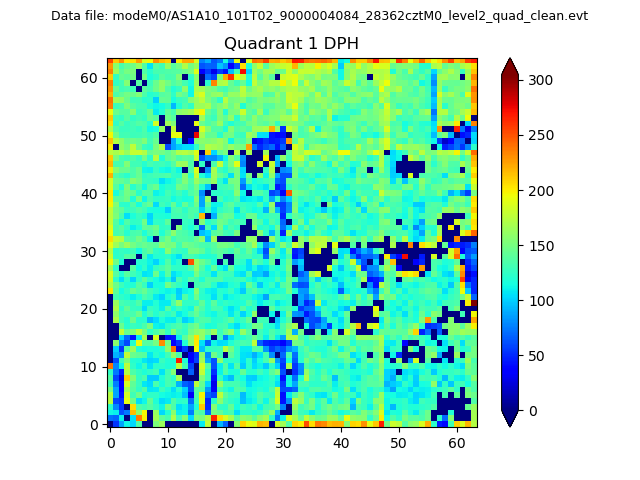 |
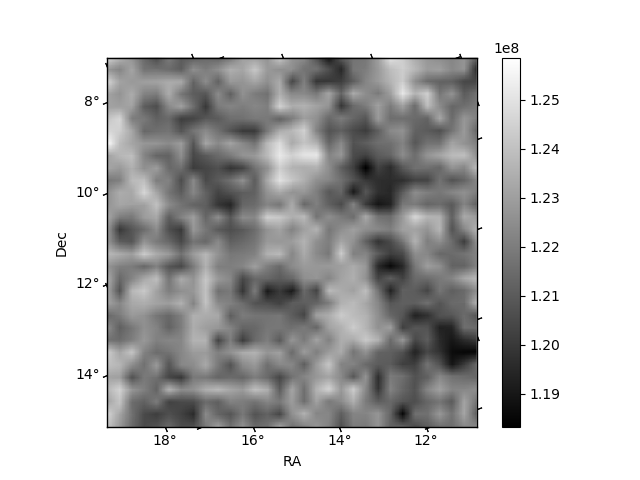
Quadrant B |
|---|---|---|---|
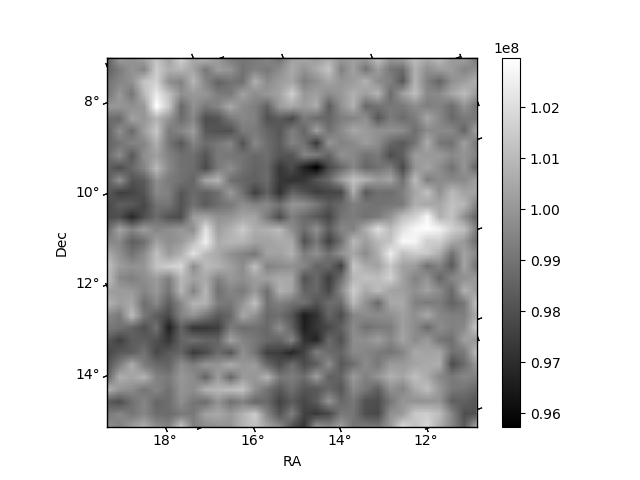
| Quadrant D | 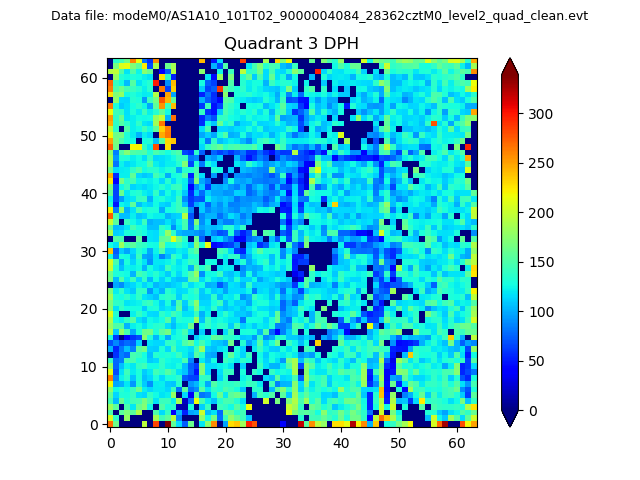 |
 |
Quadrant C |
| Plot type | Count rate plots | Images |
|---|---|---|
| Comparison with Poisson distribution Blue bars denote a histogram of data divided into 1 sec bins. Red curve is a Poisson curve with rate = median count rate of data. |
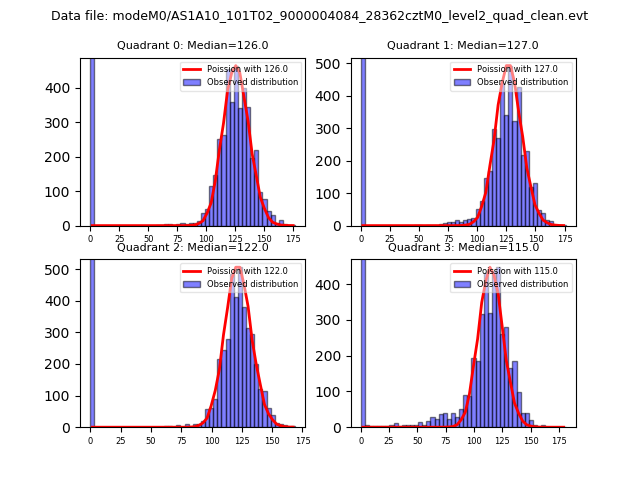 |
 |
| Quadrant-wise count rates Data is divided into 100 sec bins |
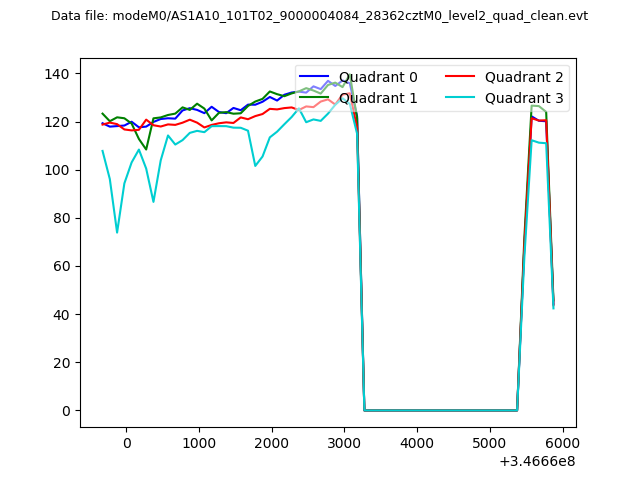 |
|
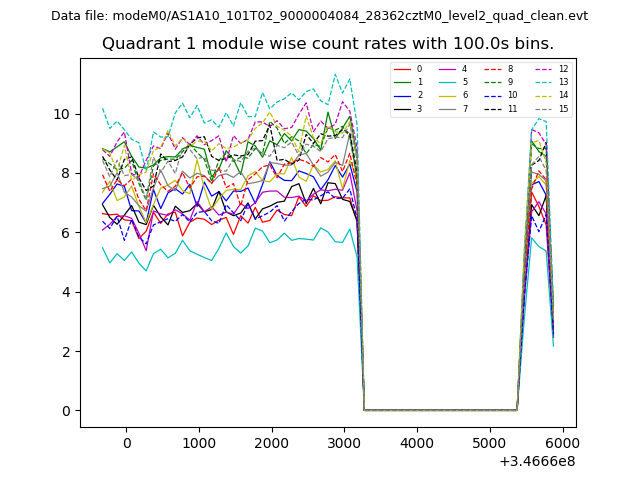
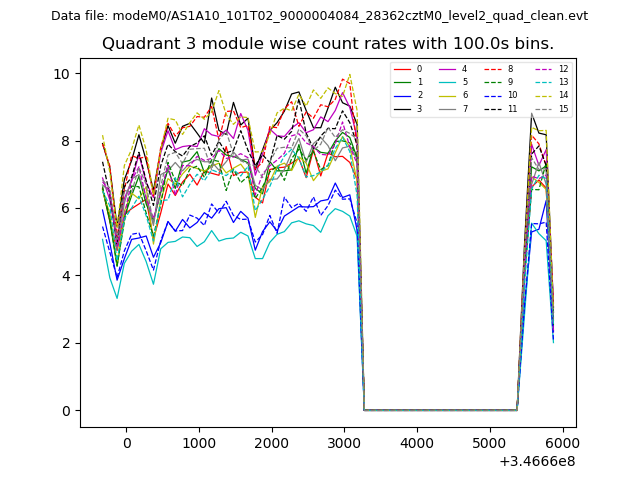
| Module-wise count rates for Quadrant A Data is divided into 100 sec bins |
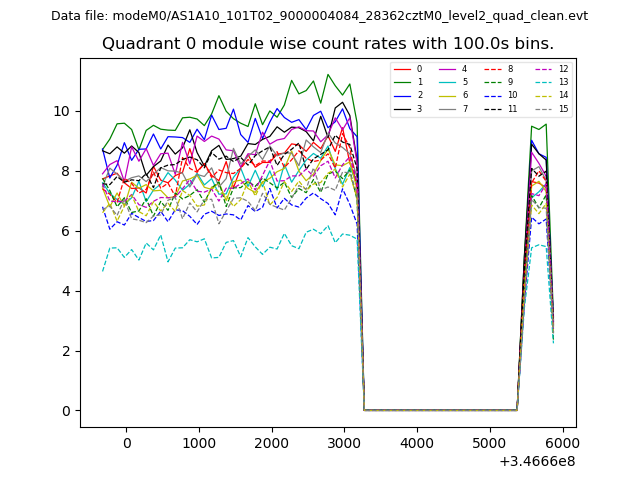 |
 |
| Module-wise count rates for Quadrant B Data is divided into 100 sec bins |
 |
 |
| Module-wise count rates for Quadrant C Data is divided into 100 sec bins |
 |
 |
| Module-wise count rates for Quadrant D Data is divided into 100 sec bins |
 |
 |
| Parameter | Plot |
|---|---|
| CZT HV Monitor | 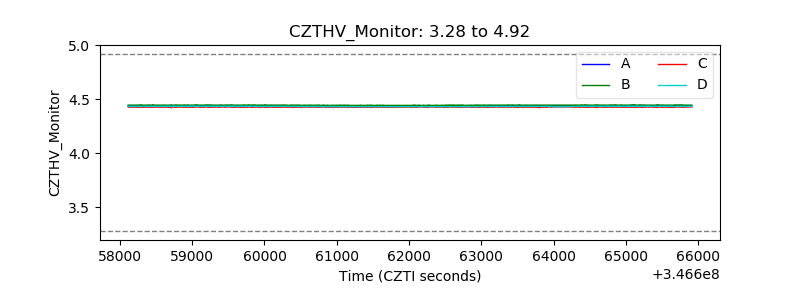 |
| D_VDD | 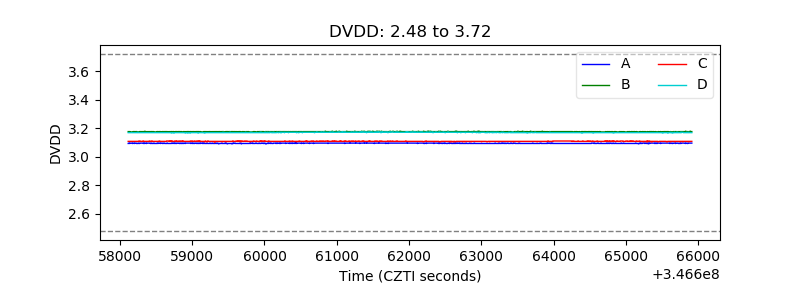 |
| Temperature 1 | 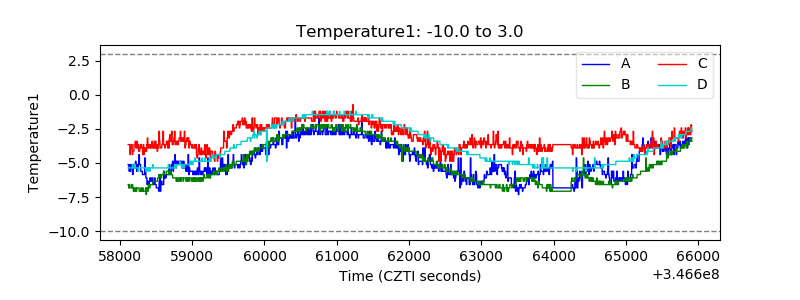 |
| Veto HV Monitor | 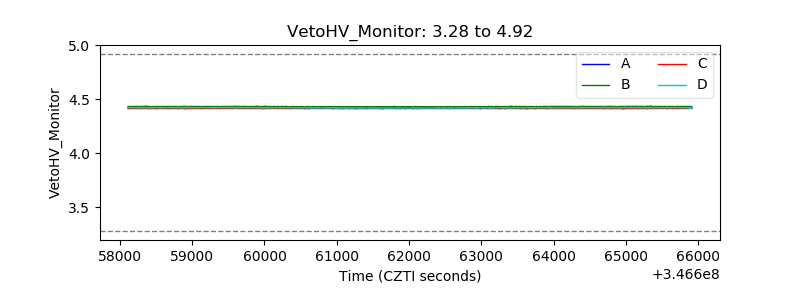 |
| Veto LLD | 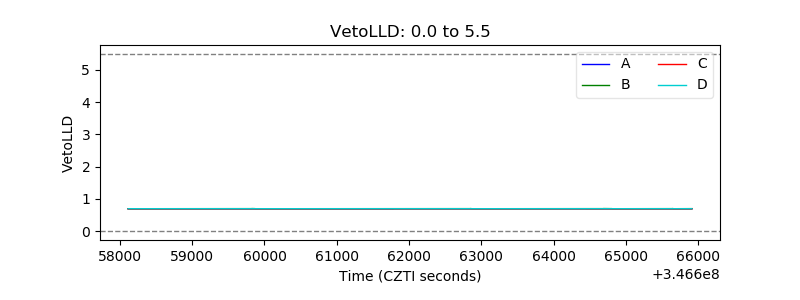 |
| Alpha Counter | 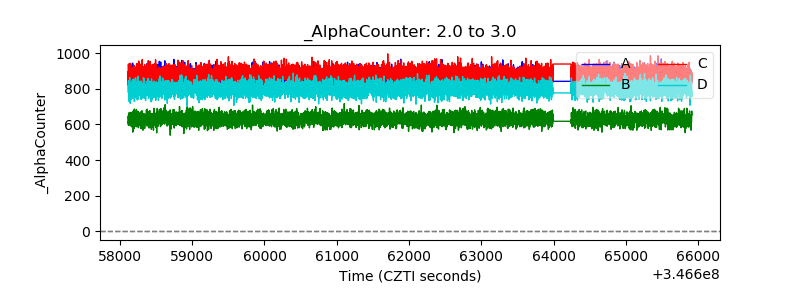 |
| _CPM_Rate | 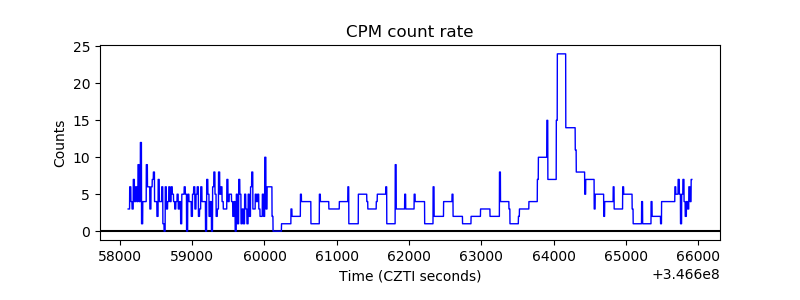 |
| CZT Counter | 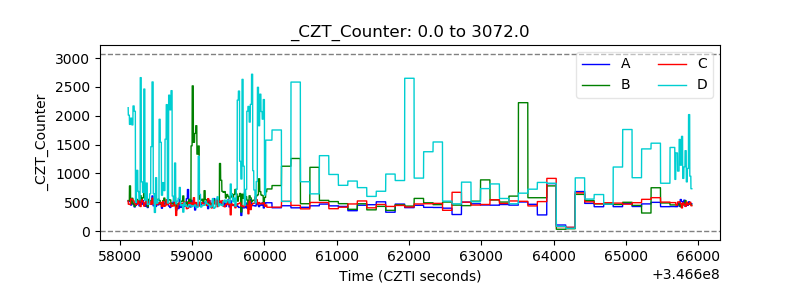 |
| +2.5 Volts monitor |  |
| +5 Volts monitor |  |
| _ROLL_ROT | 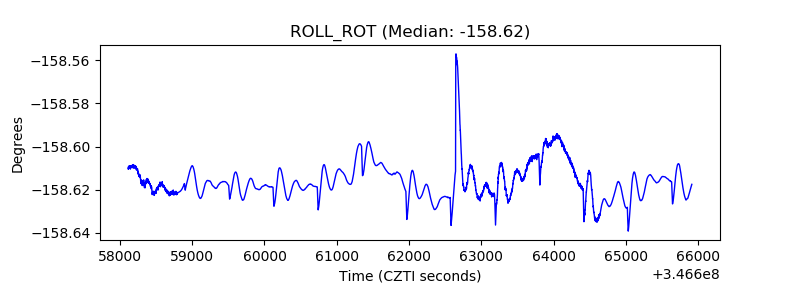 |
| _Roll_DEC | 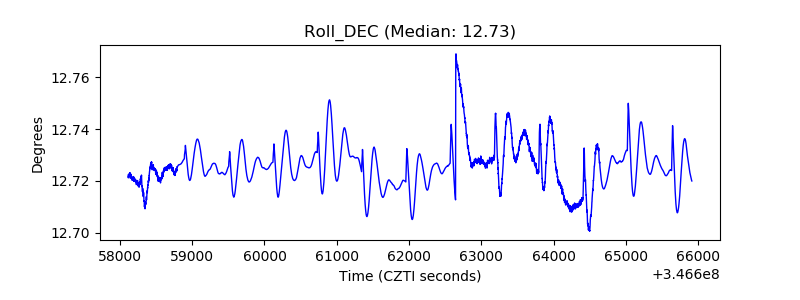 |
| _Roll_RA | 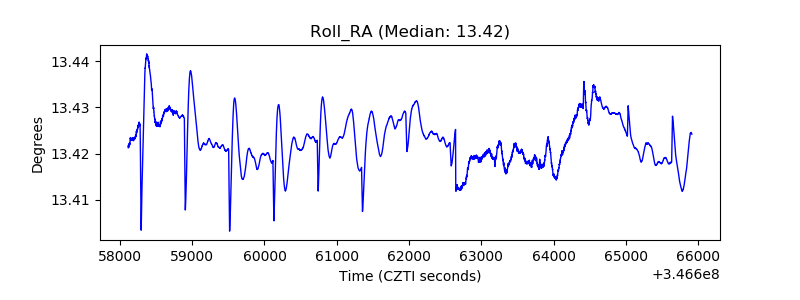 |
| Veto Counter | 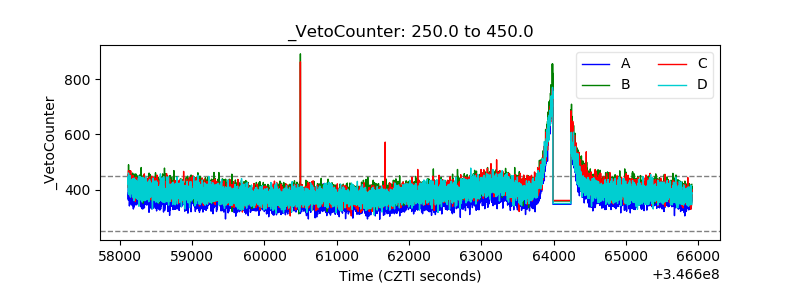 |