| Param | Original file | Final file |
|---|---|---|
| Filename | modeM0/AS1A10_101T02_9000004084_28364cztM0_level2.evt | modeM0/AS1A10_101T02_9000004084_28364cztM0_level2_quad_clean.evt |
| Size (bytes) | 1,174,294,080 | 163,607,040 |
| Size | 1.1 GB | 156.0 MB |
| Events in quadrant A | 6,114,845 | 1,050,937 |
| Events in quadrant B | 6,833,555 | 1,062,446 |
| Events in quadrant C | 6,203,795 | 1,014,436 |
| Events in quadrant D | 15,533,253 | 926,985 |
| Mode M0 | |||
|---|---|---|---|
| Quadrant | BADHDUFLAG | Total packets | Discarded packets |
| A | 0 | 26518 | 0 |
| B | 0 | 28454 | 0 |
| C | 0 | 26624 | 0 |
| D | 0 | 55392 | 0 |
| Mode M9 | |||
|---|---|---|---|
| Quadrant | BADHDUFLAG | Total packets | Discarded packets |
| A | 0 | 12 | 0 |
| B | 0 | 12 | 0 |
| C | 0 | 12 | 0 |
| D | 0 | 12 | 0 |
| Quadrant | Total seconds | Saturated seconds | Saturation percentage |
|---|---|---|---|
| A | 13032 | 107 | 0.821056% |
| B | 13033 | 203 | 1.557585% |
| C | 13033 | 172 | 1.319727% |
| D | 13032 | 1663 | 12.760896% |
Noise dominated data is calculated using 1-second bins in cleaned event files. If a bin has >2000 counts, and if more than 50% of those come from <1% of pixels, then it is considered to be noise-dominated and hence unusable.
| Quadrant | # 1 sec bins | Bins with >0 counts | Bins with >2000 counts | High rate bins dominated by noise | Noise dominated (total time) | Noise dominated (detector-on time) | Marked lightcurve |
|---|---|---|---|---|---|---|---|
| A | 14192 | 13032 | 0 | 0 | 0.00% | 0.00% |  |
| B | 14193 | 13033 | 51 | 51 | 0.36% | 0.39% |  |
| C | 14193 | 13035 | 1 | 1 | 0.01% | 0.01% |  |
| D | 14192 | 13034 | 1519 | 1519 | 10.70% | 11.65% |  |
Top three noisy pixels from each quadrant. If the there are fewer than three noisy pixels in the level2.evt file, extra rows are filled as -1
| Pixel properties | Quadrant properties | ||||||
|---|---|---|---|---|---|---|---|
| Quadrant | DetID | PixID | Counts | Sigma | Mean | Median | Sigma |
| A | 13 | 254 | 22641 | 65.55 | 1583 | 1543 | 321.9 |
| A | 3 | 137 | 15833 | 44.4 | 1583 | 1543 | 321.9 |
| A | 0 | 226 | 13393 | 36.82 | 1583 | 1543 | 321.9 |
| B | 10 | 245 | 419128 | 1381.47 | 1564 | 1524 | 302.3 |
| B | 10 | 246 | 153245 | 501.91 | 1564 | 1524 | 302.3 |
| B | 0 | 230 | 82528 | 267.97 | 1564 | 1524 | 302.3 |
| C | 14 | 238 | 244195 | 681.68 | 1515 | 1523 | 356.0 |
| C | 3 | 233 | 40273 | 108.85 | 1515 | 1523 | 356.0 |
| C | 14 | 128 | 12623 | 31.18 | 1515 | 1523 | 356.0 |
| D | 1 | 52 | 7767805 | 21918.87 | 1474 | 1434 | 354.3 |
| D | 8 | 195 | 906897 | 2555.47 | 1474 | 1434 | 354.3 |
| D | 13 | 104 | 875376 | 2466.51 | 1474 | 1434 | 354.3 |
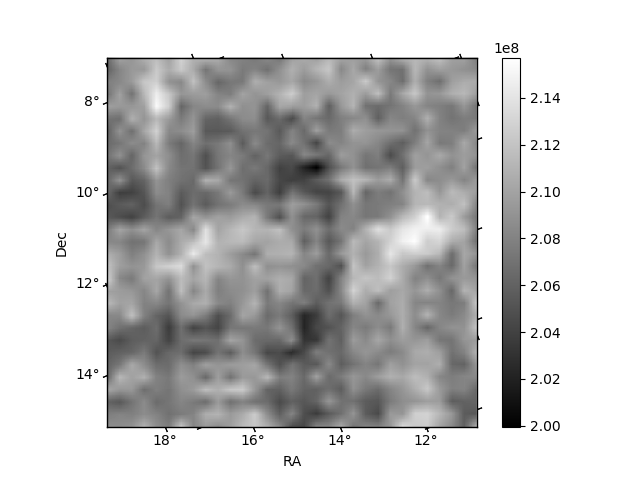
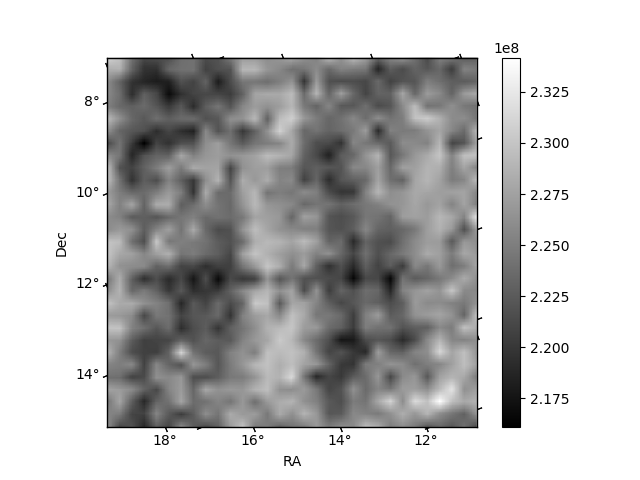
Histogram calculated using DETX and DETY for each event in the final _common_clean file
| Quadrant A | 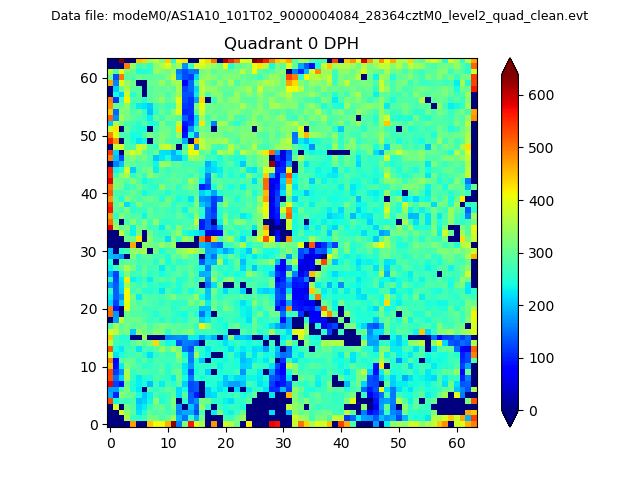 |
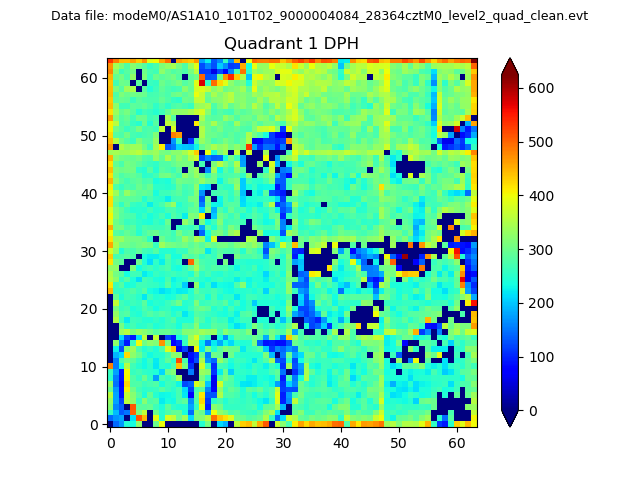 |
Quadrant B |
|---|---|---|---|
| Quadrant D | 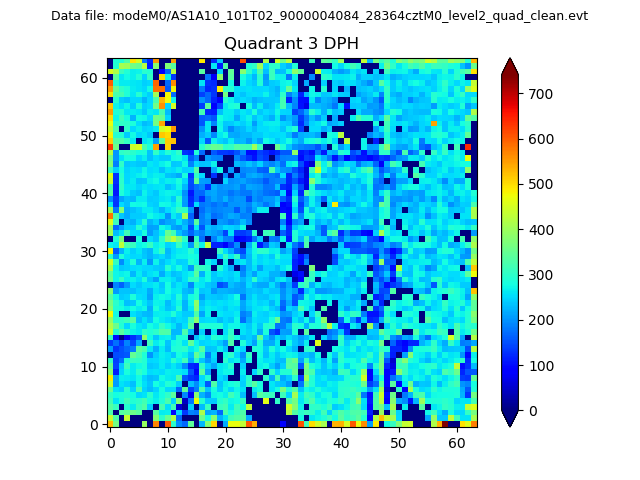 |
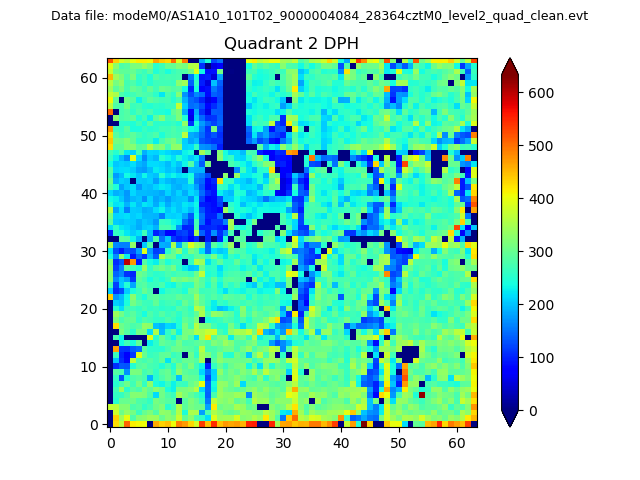 |
Quadrant C |
| Plot type | Count rate plots | Images |
|---|---|---|
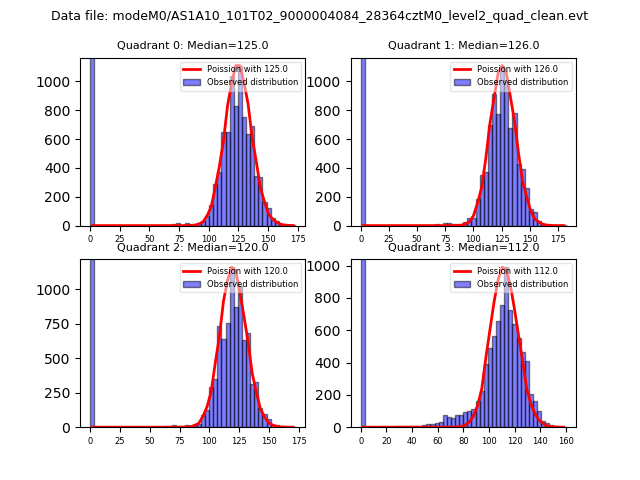
| Comparison with Poisson distribution Blue bars denote a histogram of data divided into 1 sec bins. Red curve is a Poisson curve with rate = median count rate of data. |
 |
 |
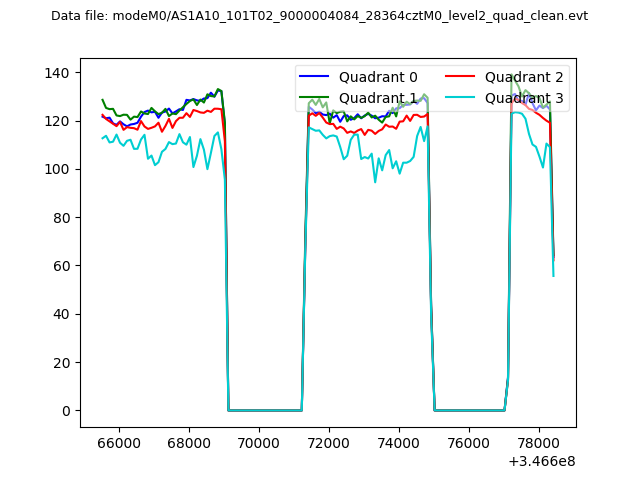
| Quadrant-wise count rates Data is divided into 100 sec bins |
 |
|
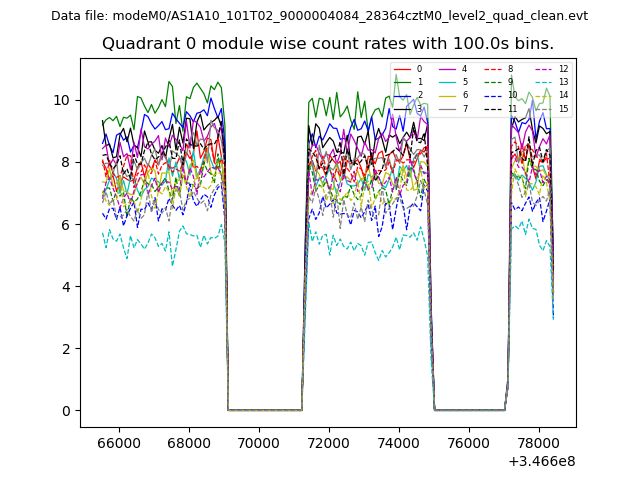
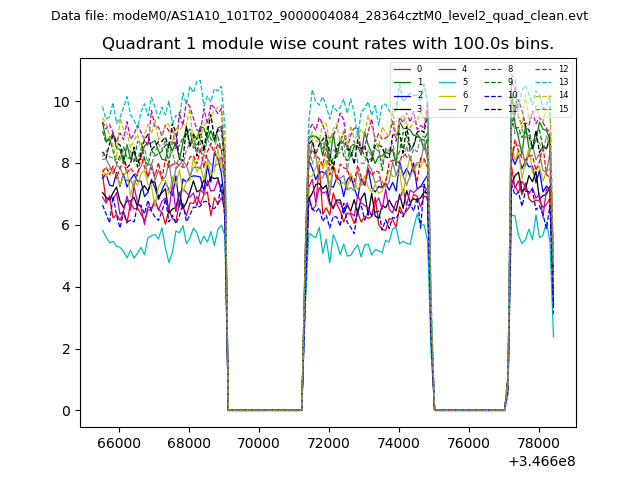
| Module-wise count rates for Quadrant A Data is divided into 100 sec bins |
 |
 |
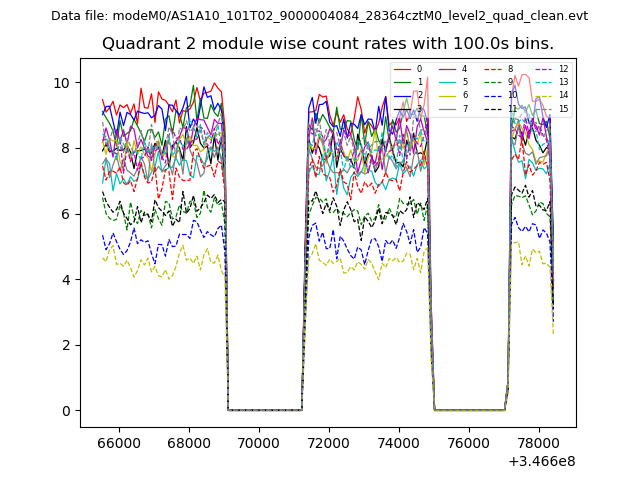
| Module-wise count rates for Quadrant B Data is divided into 100 sec bins |
 |
 |
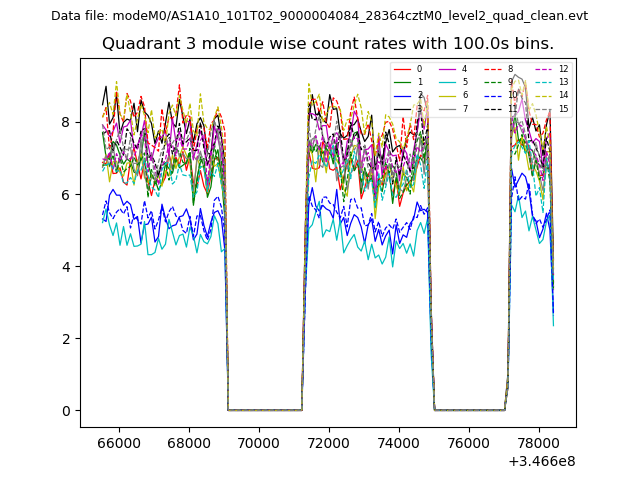
| Module-wise count rates for Quadrant C Data is divided into 100 sec bins |
 |
 |
| Module-wise count rates for Quadrant D Data is divided into 100 sec bins |
 |
 |
| Parameter | Plot |
|---|---|
| CZT HV Monitor | 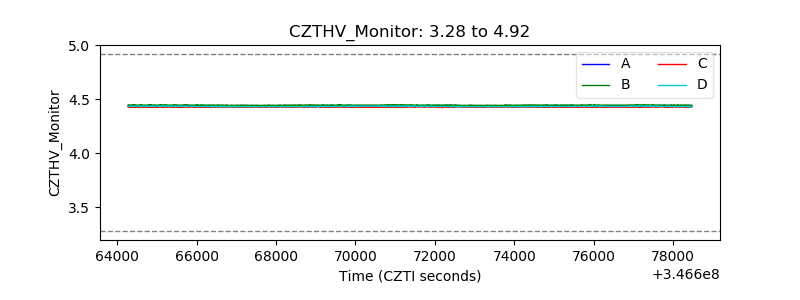 |
| D_VDD | 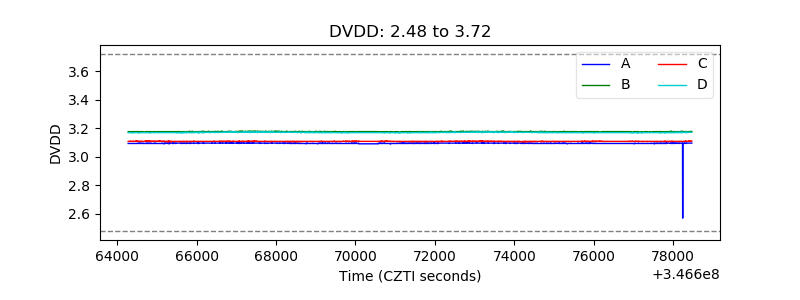 |
| Temperature 1 | 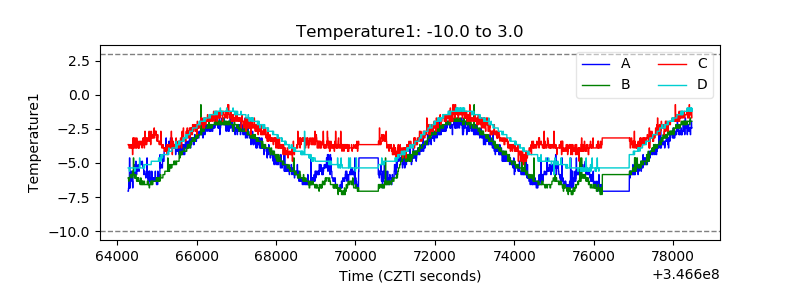 |
| Veto HV Monitor | 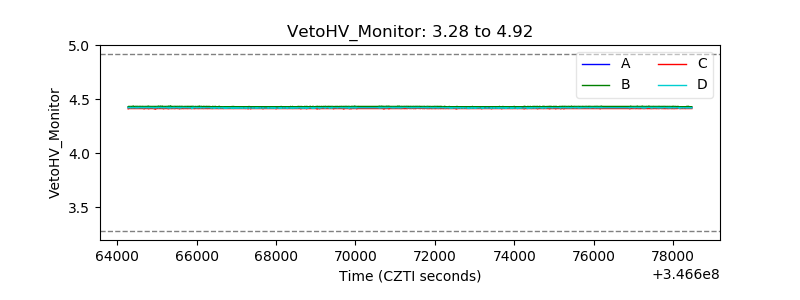 |
| Veto LLD | 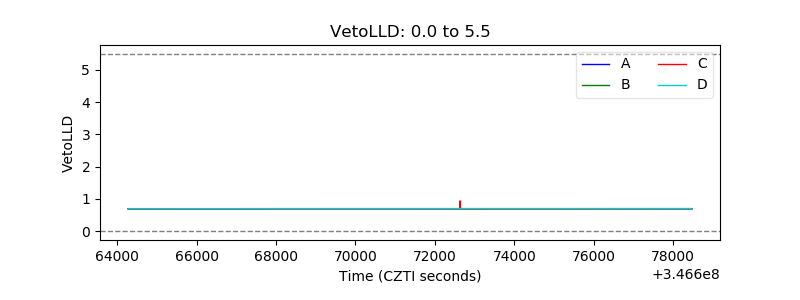 |
| Alpha Counter | 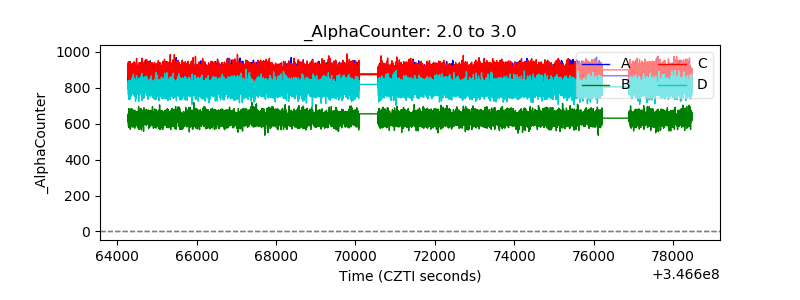 |
| _CPM_Rate | 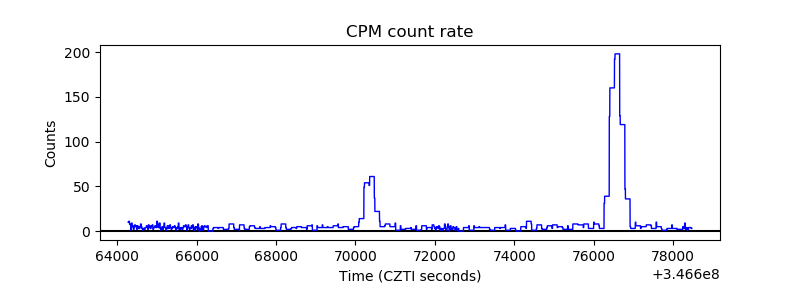 |
| CZT Counter | 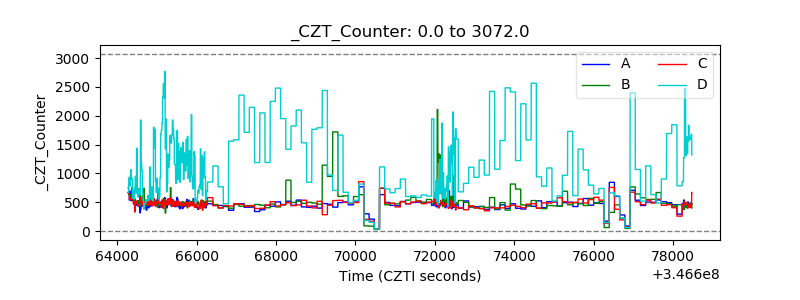 |
| +2.5 Volts monitor | 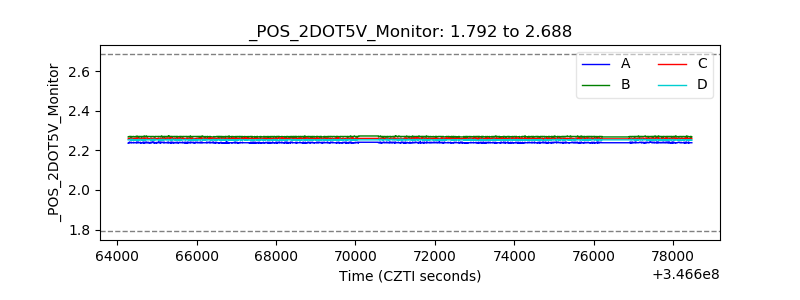 |
| +5 Volts monitor | 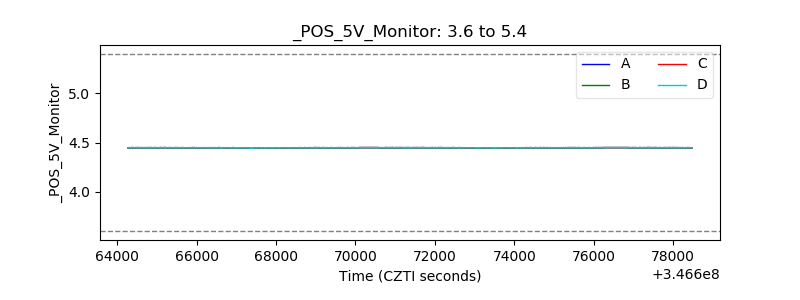 |
| _ROLL_ROT | 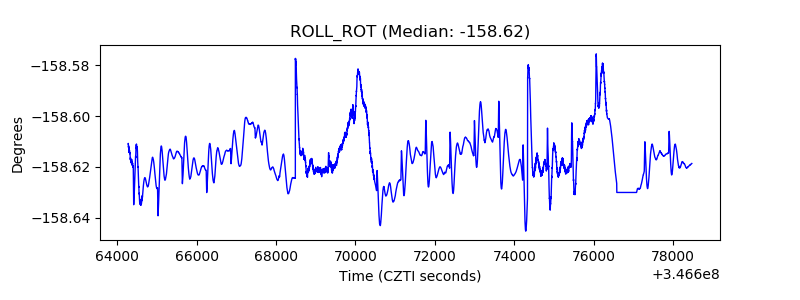 |
| _Roll_DEC | 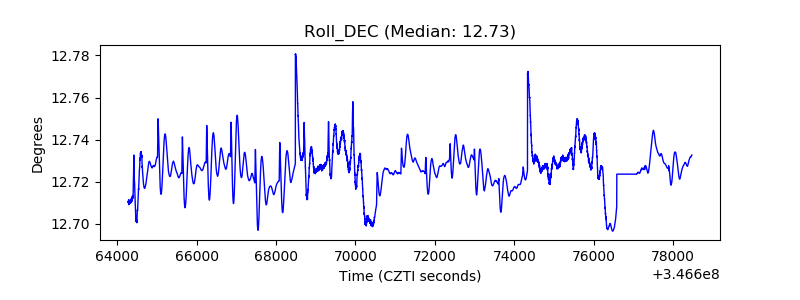 |
| _Roll_RA | 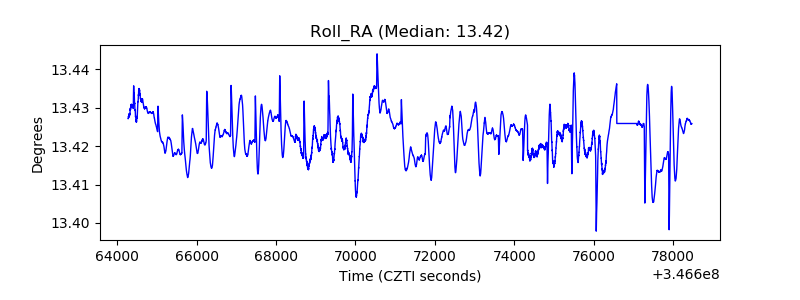 |
| Veto Counter | 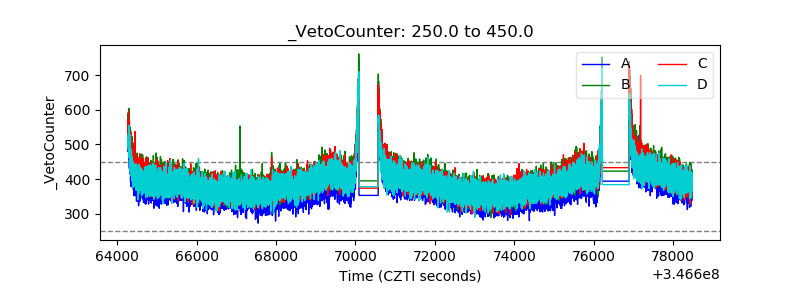 |