| Param | Original file | Final file |
|---|---|---|
| Filename | modeM0/AS1A10_101T02_9000004084_28365cztM0_level2.evt | modeM0/AS1A10_101T02_9000004084_28365cztM0_level2_quad_clean.evt |
| Size (bytes) | 499,927,680 | 86,160,960 |
| Size | 476.8 MB | 82.2 MB |
| Events in quadrant A | 2,906,799 | 569,282 |
| Events in quadrant B | 3,005,055 | 574,505 |
| Events in quadrant C | 2,861,219 | 546,264 |
| Events in quadrant D | 5,960,295 | 499,860 |
| Mode M0 | |||
|---|---|---|---|
| Quadrant | BADHDUFLAG | Total packets | Discarded packets |
| A | 0 | 12498 | 0 |
| B | 0 | 12727 | 0 |
| C | 0 | 12341 | 0 |
| D | 0 | 21792 | 0 |
| Mode M9 | |||
|---|---|---|---|
| Quadrant | BADHDUFLAG | Total packets | Discarded packets |
| A | 0 | 9 | 0 |
| B | 0 | 9 | 0 |
| C | 0 | 9 | 0 |
| D | 0 | 9 | 0 |
| Quadrant | Total seconds | Saturated seconds | Saturation percentage |
|---|---|---|---|
| A | 6006 | 59 | 0.982351% |
| B | 6006 | 96 | 1.598402% |
| C | 6006 | 84 | 1.398601% |
| D | 6007 | 596 | 9.921758% |
Noise dominated data is calculated using 1-second bins in cleaned event files. If a bin has >2000 counts, and if more than 50% of those come from <1% of pixels, then it is considered to be noise-dominated and hence unusable.
| Quadrant | # 1 sec bins | Bins with >0 counts | Bins with >2000 counts | High rate bins dominated by noise | Noise dominated (total time) | Noise dominated (detector-on time) | Marked lightcurve |
|---|---|---|---|---|---|---|---|
| A | 6826 | 6006 | 0 | 0 | 0.00% | 0.00% | 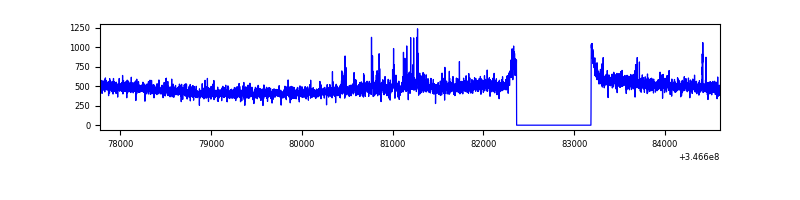 |
| B | 6826 | 6006 | 22 | 22 | 0.32% | 0.37% | 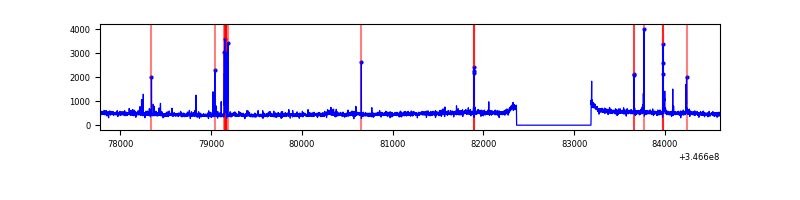 |
| C | 6826 | 6007 | 0 | 0 | 0.00% | 0.00% | 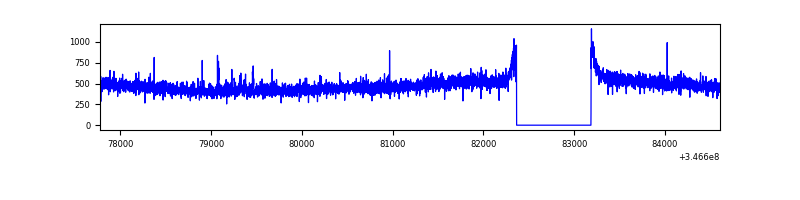 |
| D | 6827 | 6007 | 453 | 453 | 6.64% | 7.54% | 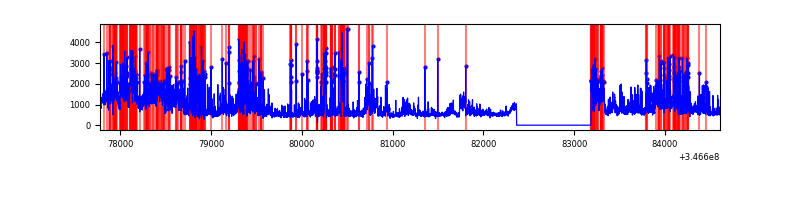 |
Top three noisy pixels from each quadrant. If the there are fewer than three noisy pixels in the level2.evt file, extra rows are filled as -1
| Pixel properties | Quadrant properties | ||||||
|---|---|---|---|---|---|---|---|
| Quadrant | DetID | PixID | Counts | Sigma | Mean | Median | Sigma |
| A | 15 | 174 | 67066 | 442.03 | 735 | 719 | 150.1 |
| A | 13 | 254 | 10416 | 64.61 | 735 | 719 | 150.1 |
| A | 3 | 137 | 7329 | 44.04 | 735 | 719 | 150.1 |
| B | 10 | 246 | 113091 | 790.94 | 724 | 704 | 142.1 |
| B | 12 | 111 | 17454 | 117.88 | 724 | 704 | 142.1 |
| B | 11 | 111 | 16035 | 107.89 | 724 | 704 | 142.1 |
| C | 14 | 238 | 112265 | 673.96 | 699 | 703 | 165.5 |
| C | 3 | 233 | 25033 | 146.98 | 699 | 703 | 165.5 |
| C | 13 | 61 | 4746 | 24.42 | 699 | 703 | 165.5 |
| D | 1 | 52 | 2366910 | 14306.14 | 684 | 667 | 165.4 |
| D | 8 | 195 | 483395 | 2918.54 | 684 | 667 | 165.4 |
| D | 7 | 238 | 257847 | 1554.89 | 684 | 667 | 165.4 |
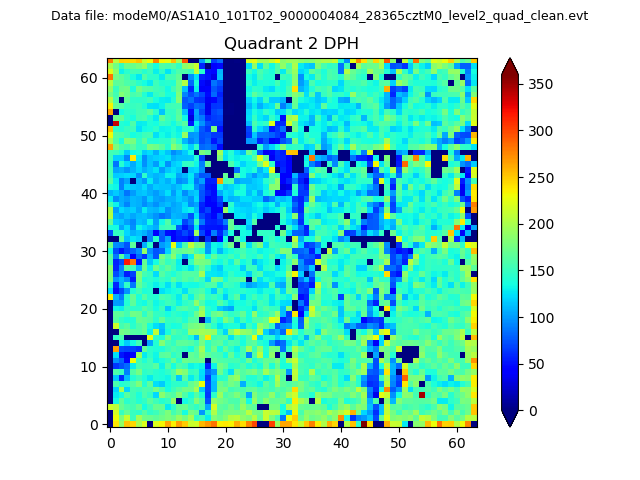
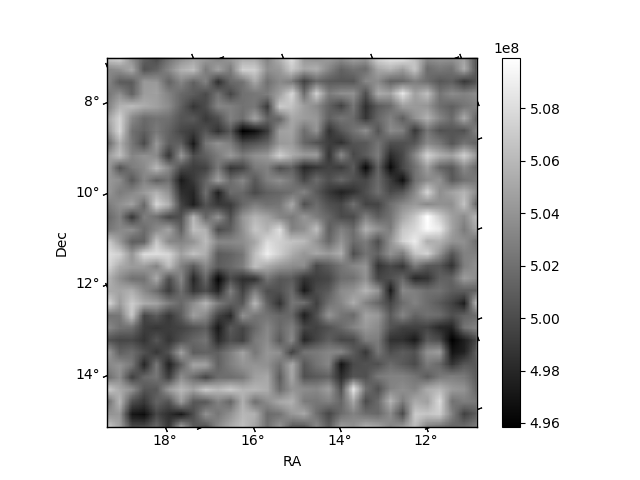
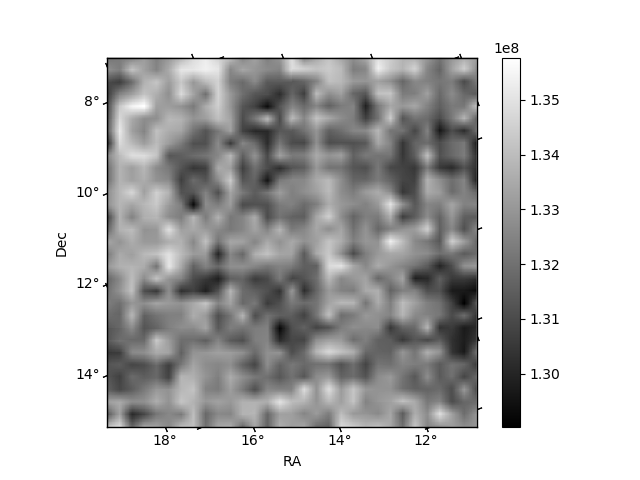
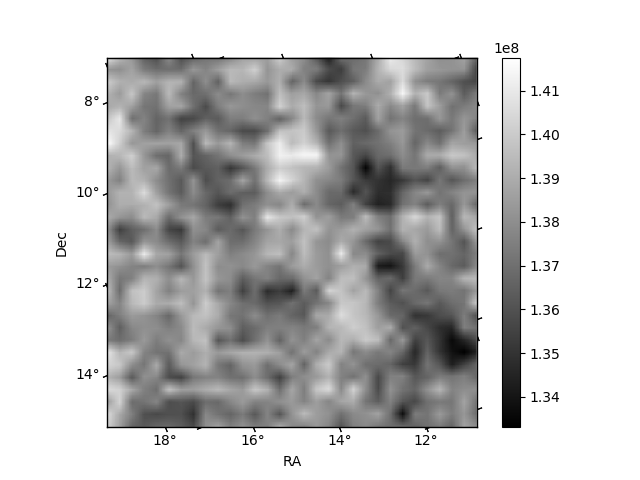
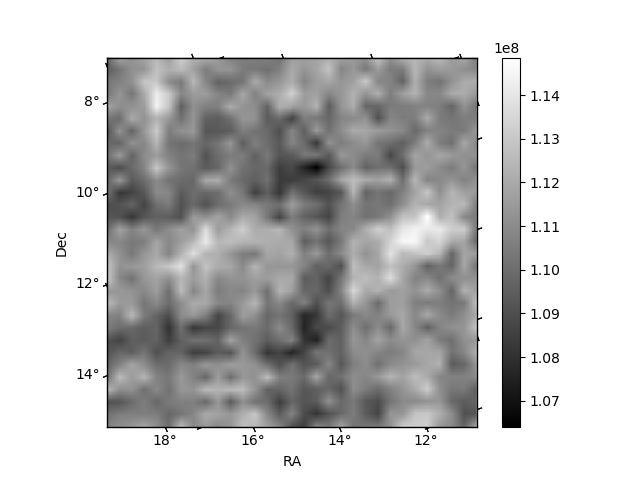
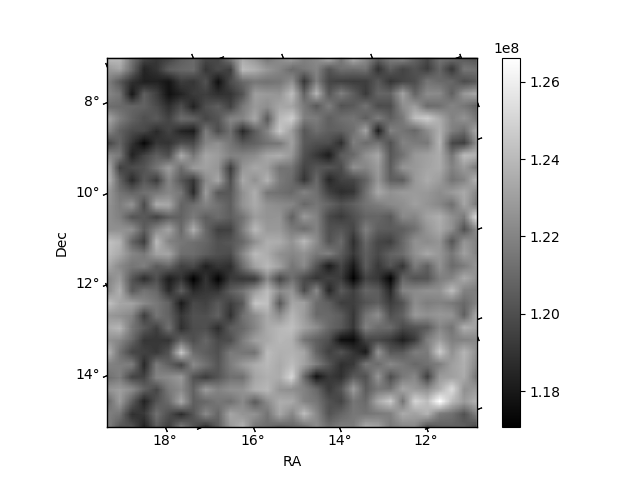
Histogram calculated using DETX and DETY for each event in the final _common_clean file
| Quadrant A | 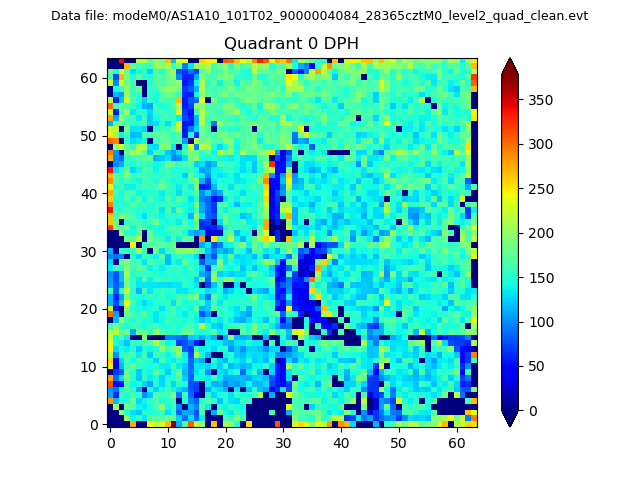 |
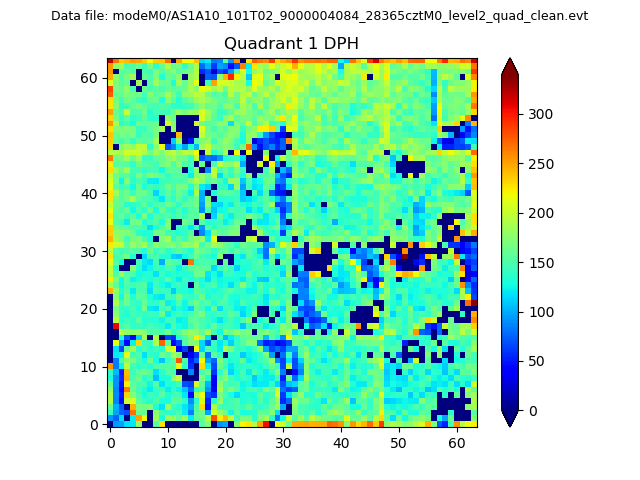 |
Quadrant B |
|---|---|---|---|
| Quadrant D | 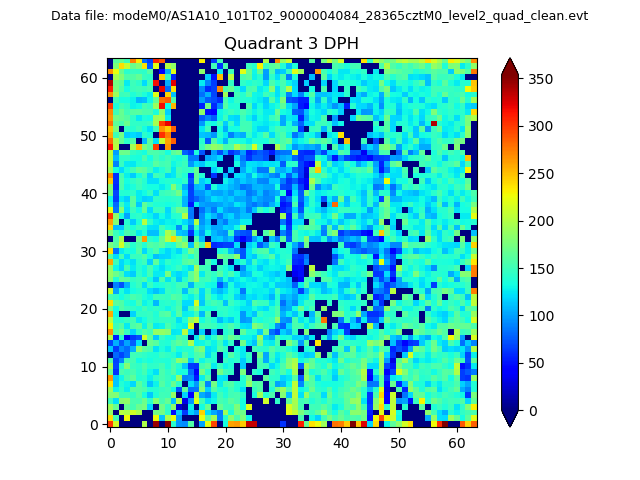 |
 |
Quadrant C |
| Plot type | Count rate plots | Images |
|---|---|---|
| Comparison with Poisson distribution Blue bars denote a histogram of data divided into 1 sec bins. Red curve is a Poisson curve with rate = median count rate of data. |
 |
 |
| Quadrant-wise count rates Data is divided into 100 sec bins |
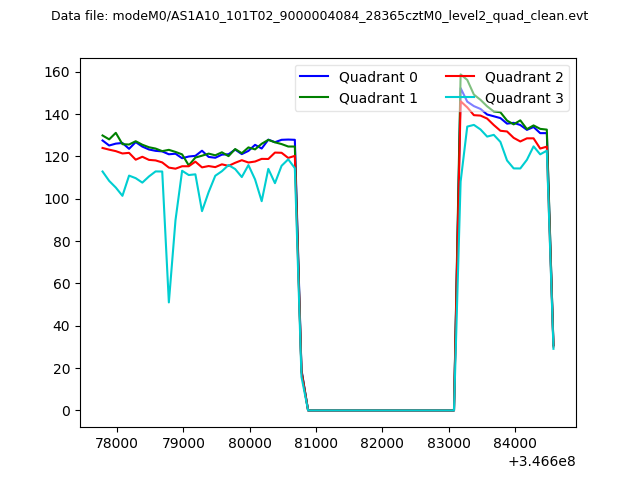 |
|
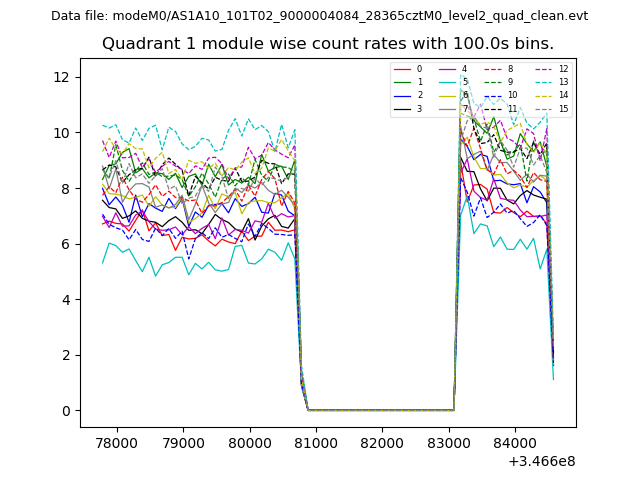
| Module-wise count rates for Quadrant A Data is divided into 100 sec bins |
 |
 |
| Module-wise count rates for Quadrant B Data is divided into 100 sec bins |
 |
 |
| Module-wise count rates for Quadrant C Data is divided into 100 sec bins |
 |
 |
| Module-wise count rates for Quadrant D Data is divided into 100 sec bins |
 |
 |
| Parameter | Plot |
|---|---|
| CZT HV Monitor |  |
| D_VDD | 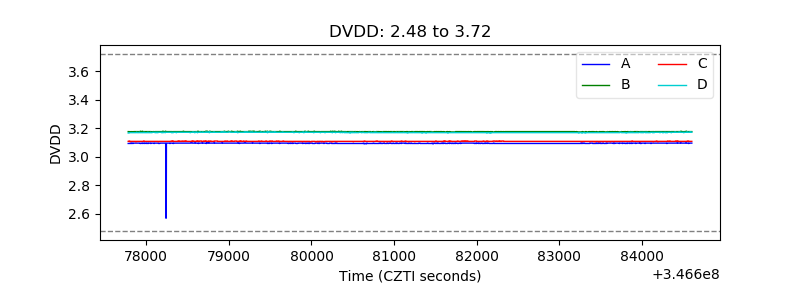 |
| Temperature 1 | 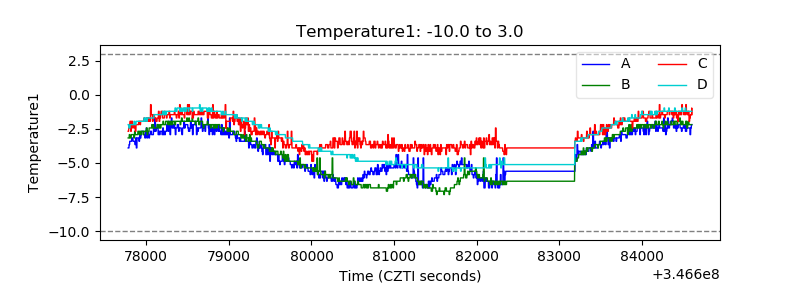 |
| Veto HV Monitor | 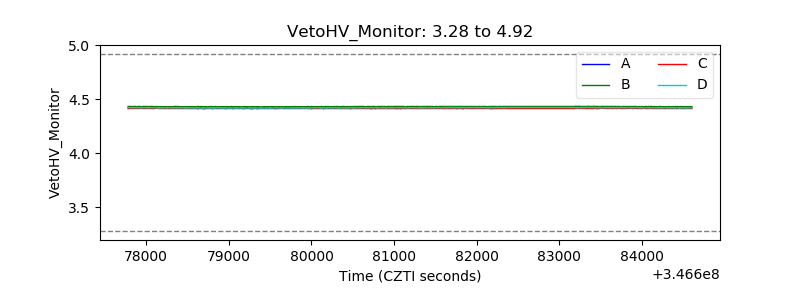 |
| Veto LLD | 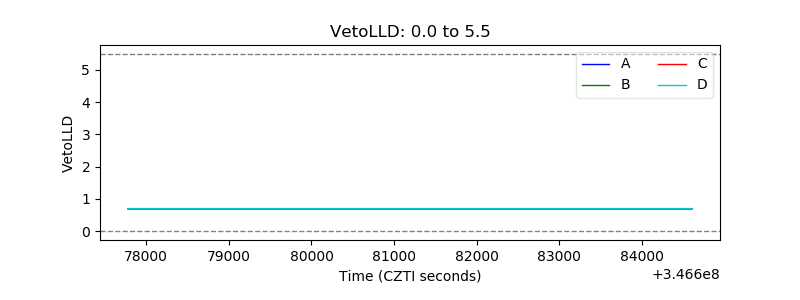 |
| Alpha Counter | 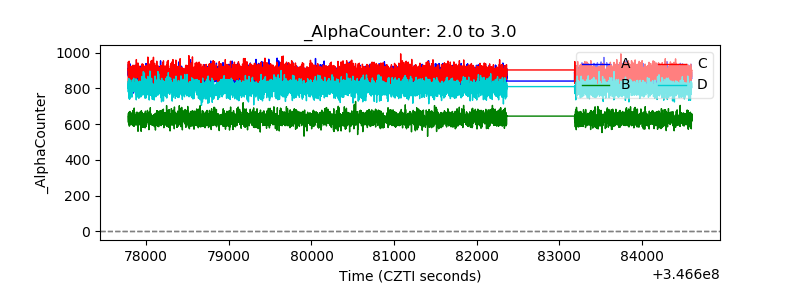 |
| _CPM_Rate | 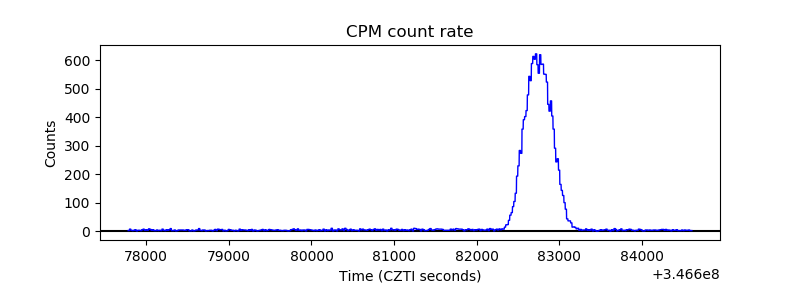 |
| CZT Counter | 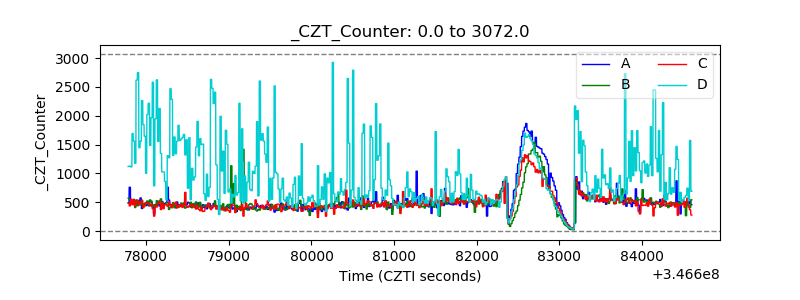 |
| +2.5 Volts monitor |  |
| +5 Volts monitor |  |
| _ROLL_ROT | 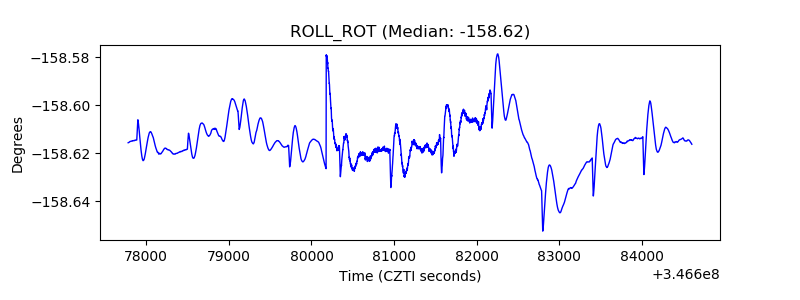 |
| _Roll_DEC | 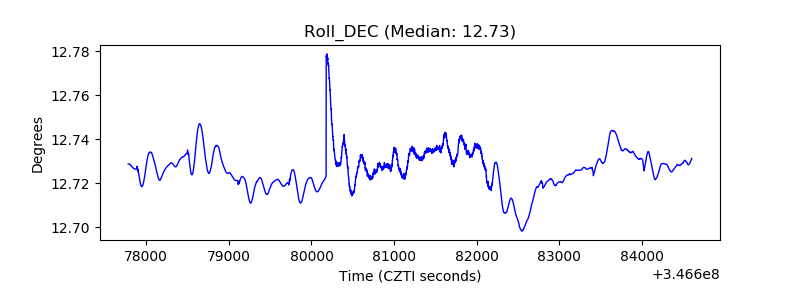 |
| _Roll_RA | 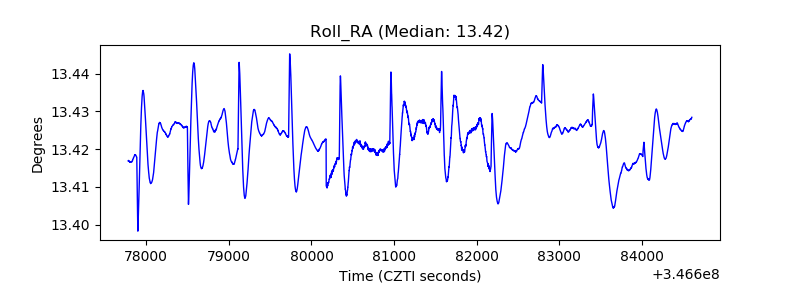 |
| Veto Counter |  |