| Param | Original file | Final file |
|---|---|---|
| Filename | modeM0/AS1A10_101T02_9000004084_28366cztM0_level2.evt | modeM0/AS1A10_101T02_9000004084_28366cztM0_level2_quad_clean.evt |
| Size (bytes) | 481,245,120 | 90,190,080 |
| Size | 459.0 MB | 86.0 MB |
| Events in quadrant A | 3,038,146 | 593,614 |
| Events in quadrant B | 3,201,884 | 598,411 |
| Events in quadrant C | 2,989,849 | 562,790 |
| Events in quadrant D | 4,921,734 | 541,515 |
| Mode M0 | |||
|---|---|---|---|
| Quadrant | BADHDUFLAG | Total packets | Discarded packets |
| A | 0 | 13069 | 0 |
| B | 0 | 13527 | 0 |
| C | 0 | 12885 | 0 |
| D | 0 | 18888 | 0 |
| Mode M9 | |||
|---|---|---|---|
| Quadrant | BADHDUFLAG | Total packets | Discarded packets |
| A | 0 | 10 | 0 |
| B | 0 | 10 | 0 |
| C | 0 | 10 | 0 |
| D | 0 | 10 | 0 |
| Quadrant | Total seconds | Saturated seconds | Saturation percentage |
|---|---|---|---|
| A | 6233 | 59 | 0.946575% |
| B | 6234 | 91 | 1.459737% |
| C | 6234 | 79 | 1.267244% |
| D | 6234 | 224 | 3.593199% |
Noise dominated data is calculated using 1-second bins in cleaned event files. If a bin has >2000 counts, and if more than 50% of those come from <1% of pixels, then it is considered to be noise-dominated and hence unusable.
| Quadrant | # 1 sec bins | Bins with >0 counts | Bins with >2000 counts | High rate bins dominated by noise | Noise dominated (total time) | Noise dominated (detector-on time) | Marked lightcurve |
|---|---|---|---|---|---|---|---|
| A | 7238 | 6233 | 1 | 1 | 0.01% | 0.02% | 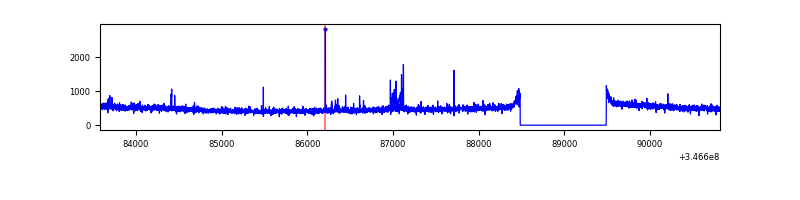 |
| B | 7239 | 6234 | 19 | 19 | 0.26% | 0.30% | 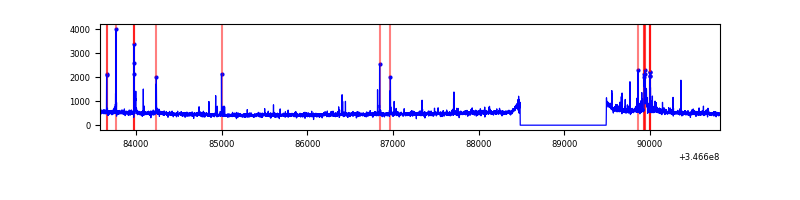 |
| C | 7239 | 6235 | 0 | 0 | 0.00% | 0.00% | 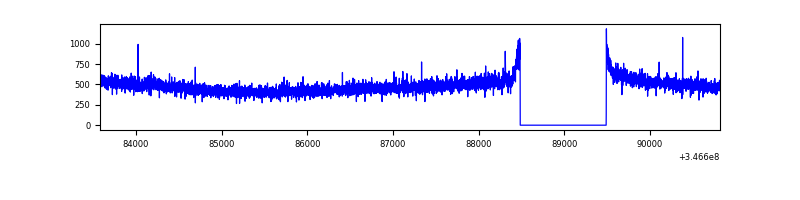 |
| D | 7239 | 6235 | 170 | 170 | 2.35% | 2.73% | 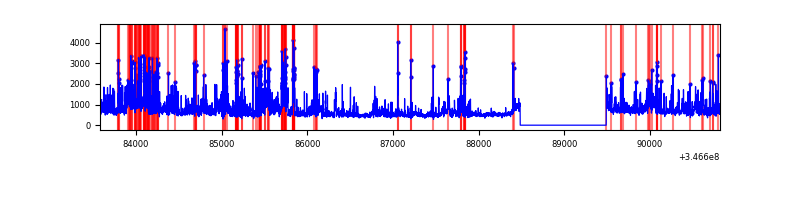 |
Top three noisy pixels from each quadrant. If the there are fewer than three noisy pixels in the level2.evt file, extra rows are filled as -1
| Pixel properties | Quadrant properties | ||||||
|---|---|---|---|---|---|---|---|
| Quadrant | DetID | PixID | Counts | Sigma | Mean | Median | Sigma |
| A | 15 | 174 | 47438 | 298.18 | 775 | 757 | 156.6 |
| A | 13 | 254 | 11072 | 65.89 | 775 | 757 | 156.6 |
| A | 3 | 137 | 7383 | 42.32 | 775 | 757 | 156.6 |
| B | 10 | 246 | 91736 | 617.09 | 764 | 745 | 147.5 |
| B | 10 | 245 | 81182 | 545.51 | 764 | 745 | 147.5 |
| B | 0 | 230 | 27916 | 184.27 | 764 | 745 | 147.5 |
| C | 14 | 238 | 118932 | 681.26 | 734 | 737 | 173.5 |
| C | 3 | 233 | 12737 | 69.17 | 734 | 737 | 173.5 |
| C | 13 | 61 | 5068 | 24.96 | 734 | 737 | 173.5 |
| D | 1 | 52 | 1626127 | 9159.14 | 738 | 718 | 177.5 |
| D | 8 | 195 | 299337 | 1682.71 | 738 | 718 | 177.5 |
| D | 13 | 104 | 82818 | 462.63 | 738 | 718 | 177.5 |
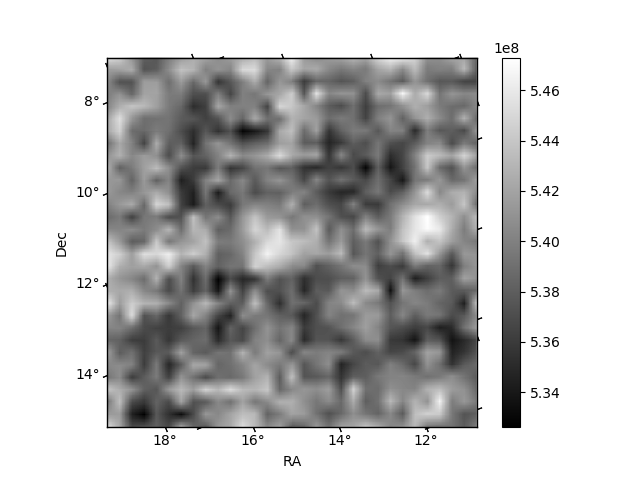
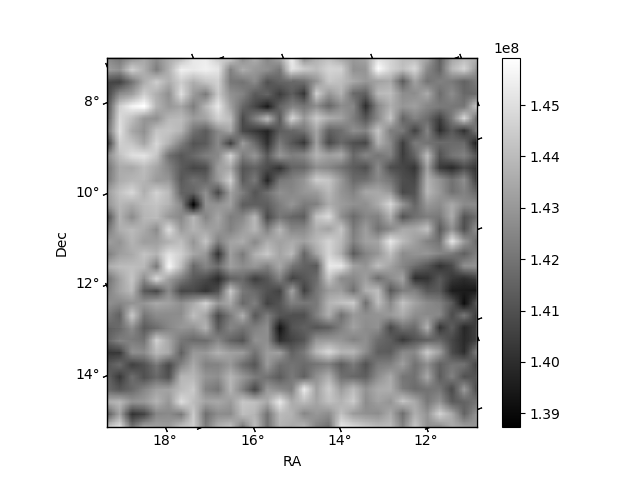
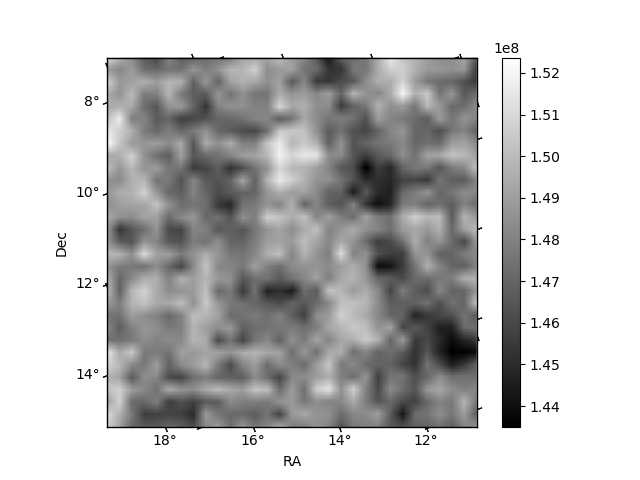
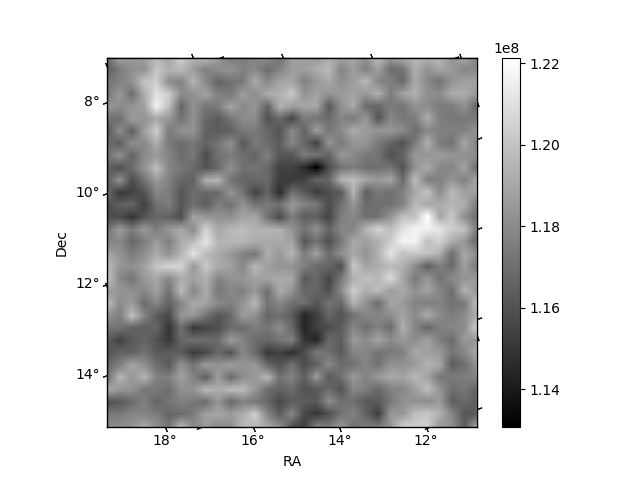
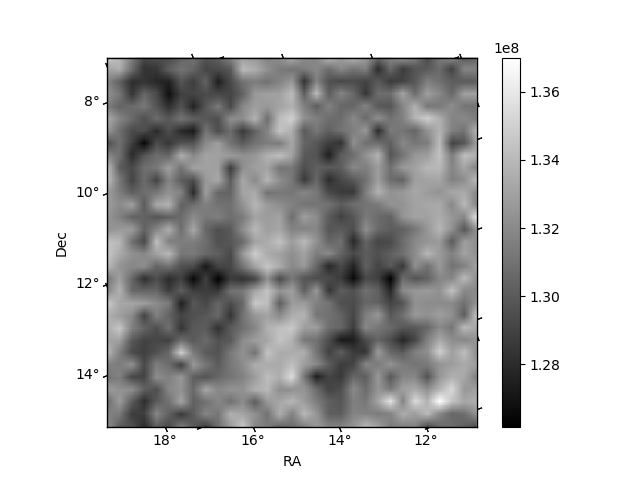
Histogram calculated using DETX and DETY for each event in the final _common_clean file
| Quadrant A | 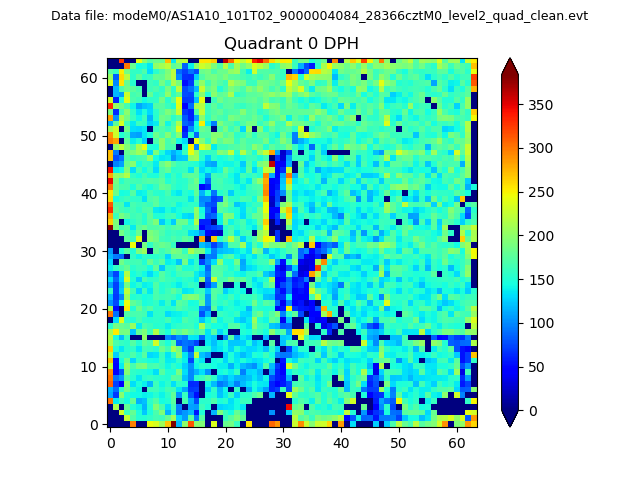 |
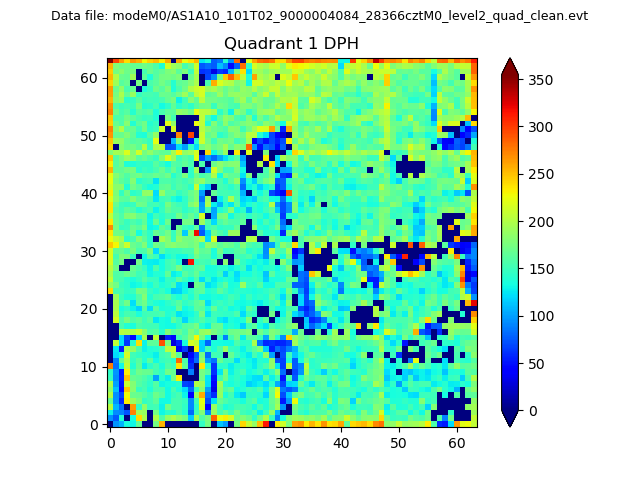 |
Quadrant B |
|---|---|---|---|
| Quadrant D | 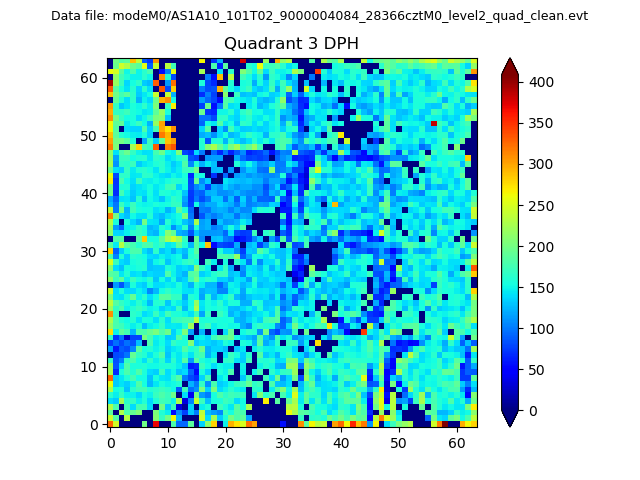 |
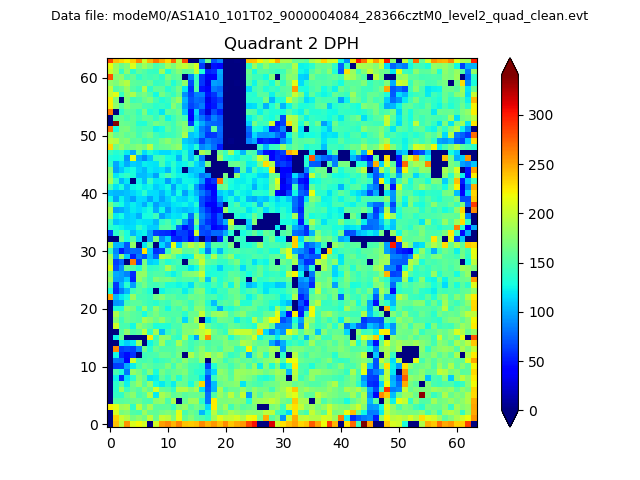 |
Quadrant C |
| Plot type | Count rate plots | Images |
|---|---|---|
| Comparison with Poisson distribution Blue bars denote a histogram of data divided into 1 sec bins. Red curve is a Poisson curve with rate = median count rate of data. |
 |
 |
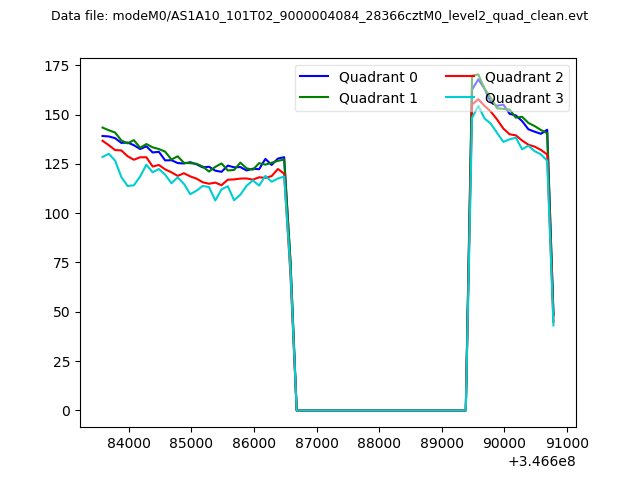
| Quadrant-wise count rates Data is divided into 100 sec bins |
 |
|
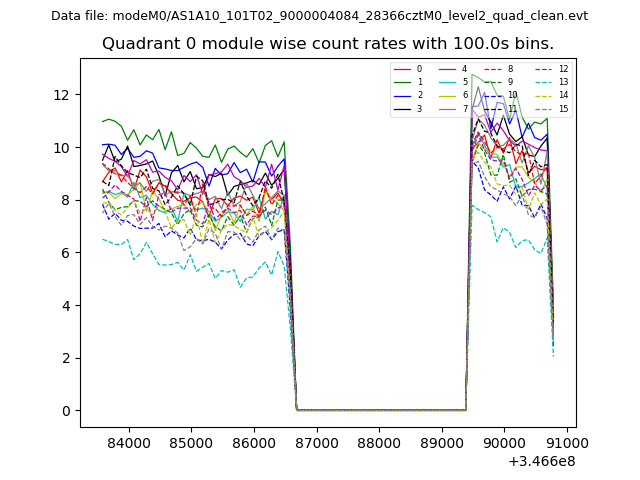
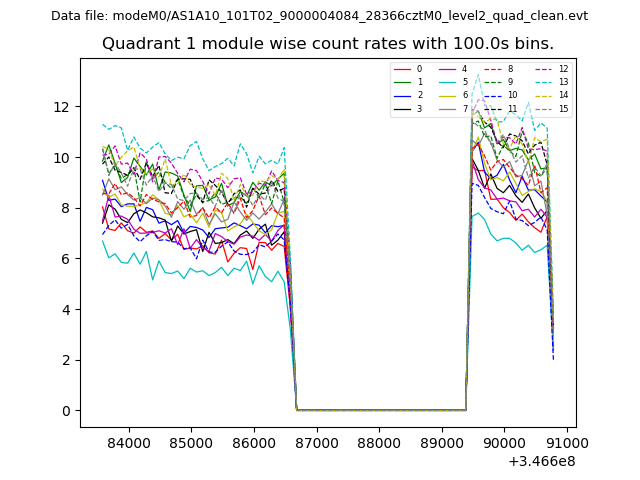
| Module-wise count rates for Quadrant A Data is divided into 100 sec bins |
 |
 |
| Module-wise count rates for Quadrant B Data is divided into 100 sec bins |
 |
 |
| Module-wise count rates for Quadrant C Data is divided into 100 sec bins |
 |
 |
| Module-wise count rates for Quadrant D Data is divided into 100 sec bins |
 |
 |
| Parameter | Plot |
|---|---|
| CZT HV Monitor |  |
| D_VDD | 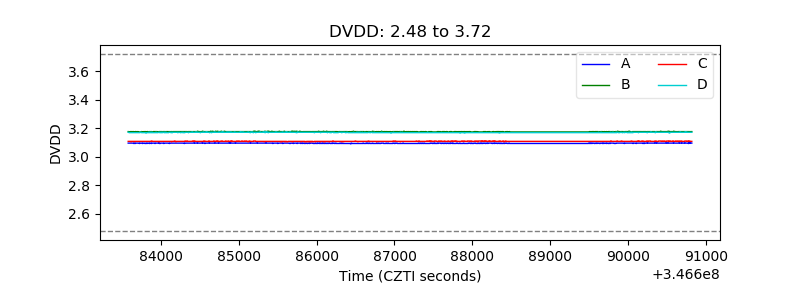 |
| Temperature 1 | 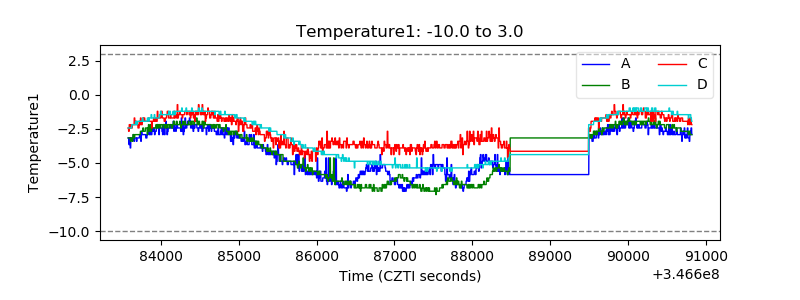 |
| Veto HV Monitor | 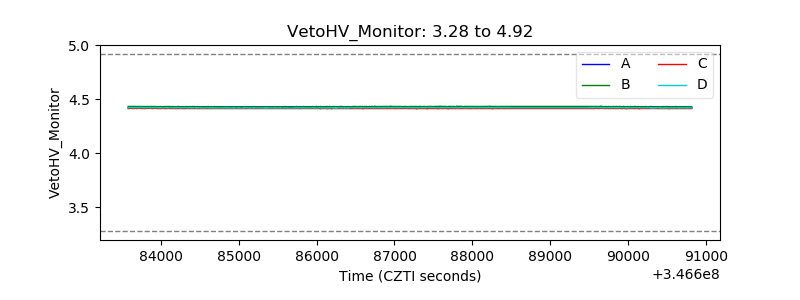 |
| Veto LLD | 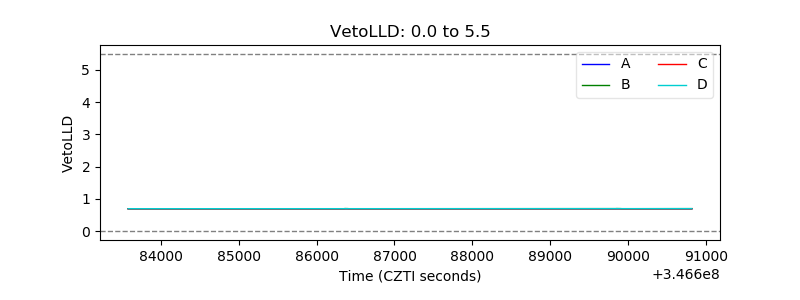 |
| Alpha Counter | 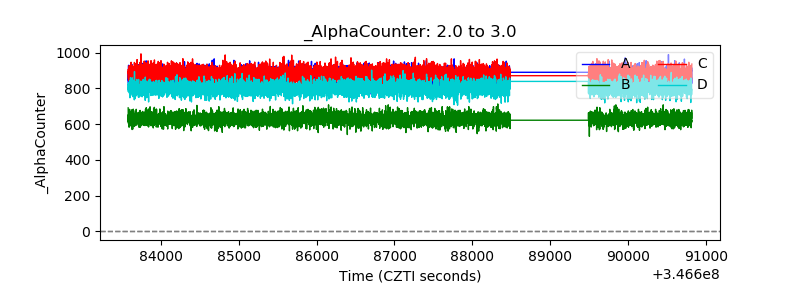 |
| _CPM_Rate | 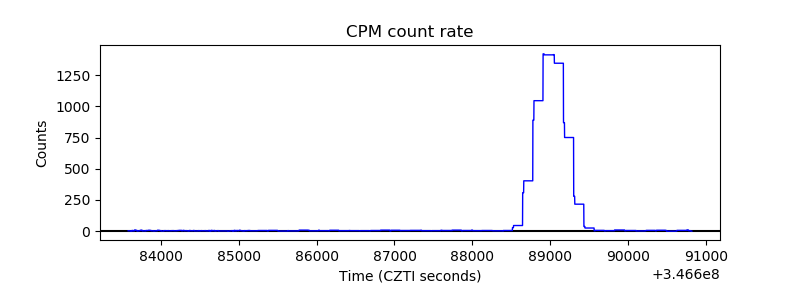 |
| CZT Counter | 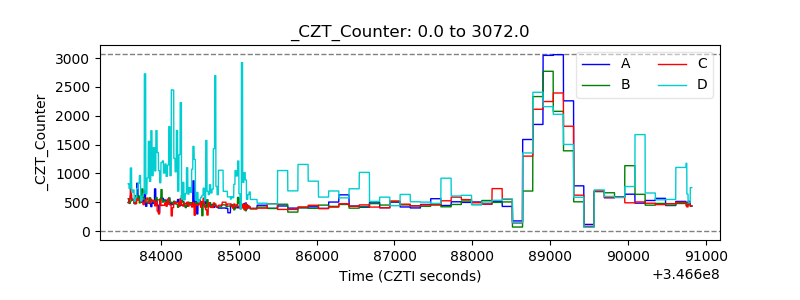 |
| +2.5 Volts monitor |  |
| +5 Volts monitor |  |
| _ROLL_ROT |  |
| _Roll_DEC | 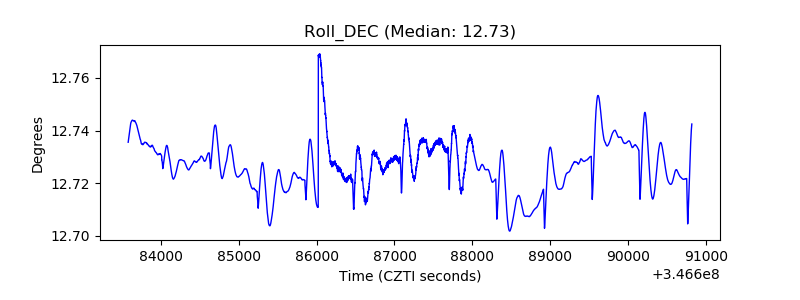 |
| _Roll_RA | 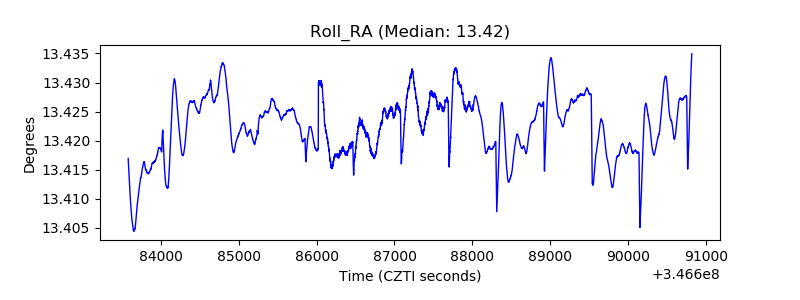 |
| Veto Counter | 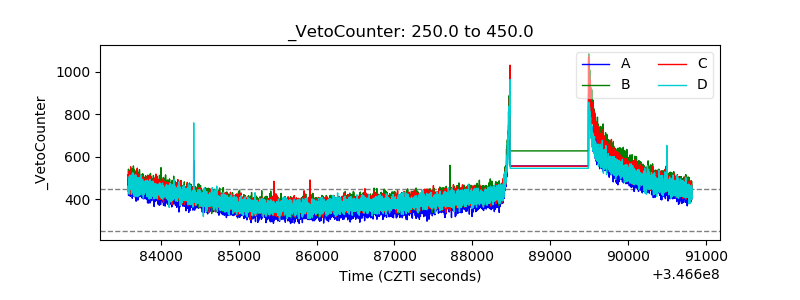 |