| Param | Original file | Final file |
|---|---|---|
| Filename | modeM0/AS1A10_101T02_9000004084_28368cztM0_level2.evt | modeM0/AS1A10_101T02_9000004084_28368cztM0_level2_quad_clean.evt |
| Size (bytes) | 612,259,200 | 96,788,160 |
| Size | 583.9 MB | 92.3 MB |
| Events in quadrant A | 3,355,869 | 646,966 |
| Events in quadrant B | 3,602,789 | 653,695 |
| Events in quadrant C | 3,248,600 | 609,990 |
| Events in quadrant D | 7,892,769 | 564,015 |
| Mode M0 | |||
|---|---|---|---|
| Quadrant | BADHDUFLAG | Total packets | Discarded packets |
| A | 0 | 14230 | 0 |
| B | 0 | 15014 | 0 |
| C | 0 | 13793 | 0 |
| D | 0 | 28115 | 0 |
| Mode M9 | |||
|---|---|---|---|
| Quadrant | BADHDUFLAG | Total packets | Discarded packets |
| A | 0 | 12 | 0 |
| B | 0 | 13 | 0 |
| C | 0 | 13 | 0 |
| D | 0 | 13 | 0 |
| Quadrant | Total seconds | Saturated seconds | Saturation percentage |
|---|---|---|---|
| A | 6546 | 62 | 0.947143% |
| B | 6546 | 116 | 1.772075% |
| C | 6546 | 94 | 1.435991% |
| D | 6546 | 656 | 10.021387% |
Noise dominated data is calculated using 1-second bins in cleaned event files. If a bin has >2000 counts, and if more than 50% of those come from <1% of pixels, then it is considered to be noise-dominated and hence unusable.
| Quadrant | # 1 sec bins | Bins with >0 counts | Bins with >2000 counts | High rate bins dominated by noise | Noise dominated (total time) | Noise dominated (detector-on time) | Marked lightcurve |
|---|---|---|---|---|---|---|---|
| A | 7711 | 6546 | 2 | 2 | 0.03% | 0.03% | 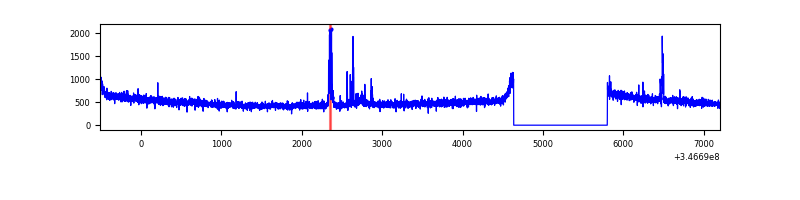 |
| B | 7711 | 6547 | 24 | 24 | 0.31% | 0.37% | 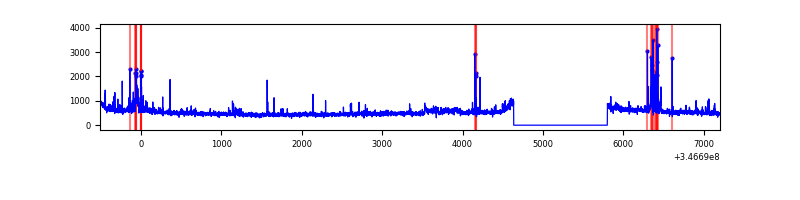 |
| C | 7711 | 6546 | 0 | 0 | 0.00% | 0.00% | 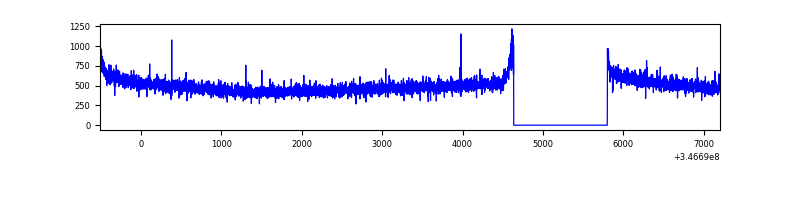 |
| D | 7711 | 6546 | 667 | 667 | 8.65% | 10.19% | 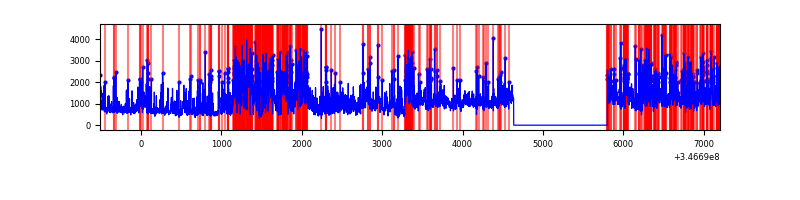 |
Top three noisy pixels from each quadrant. If the there are fewer than three noisy pixels in the level2.evt file, extra rows are filled as -1
| Pixel properties | Quadrant properties | ||||||
|---|---|---|---|---|---|---|---|
| Quadrant | DetID | PixID | Counts | Sigma | Mean | Median | Sigma |
| A | 15 | 174 | 92076 | 543.34 | 845 | 829 | 167.9 |
| A | 13 | 254 | 11809 | 65.38 | 845 | 829 | 167.9 |
| A | 3 | 137 | 7981 | 42.59 | 845 | 829 | 167.9 |
| B | 10 | 245 | 170480 | 1062.8 | 835 | 817 | 159.6 |
| B | 10 | 246 | 108063 | 671.81 | 835 | 817 | 159.6 |
| B | 0 | 230 | 40831 | 250.66 | 835 | 817 | 159.6 |
| C | 14 | 238 | 130227 | 698.89 | 796 | 802 | 185.2 |
| C | 3 | 233 | 12575 | 63.57 | 796 | 802 | 185.2 |
| C | 13 | 61 | 5455 | 25.13 | 796 | 802 | 185.2 |
| D | 1 | 52 | 2728906 | 14553.33 | 788 | 768 | 187.5 |
| D | 8 | 195 | 1691535 | 9019.45 | 788 | 768 | 187.5 |
| D | 13 | 104 | 363805 | 1936.63 | 788 | 768 | 187.5 |
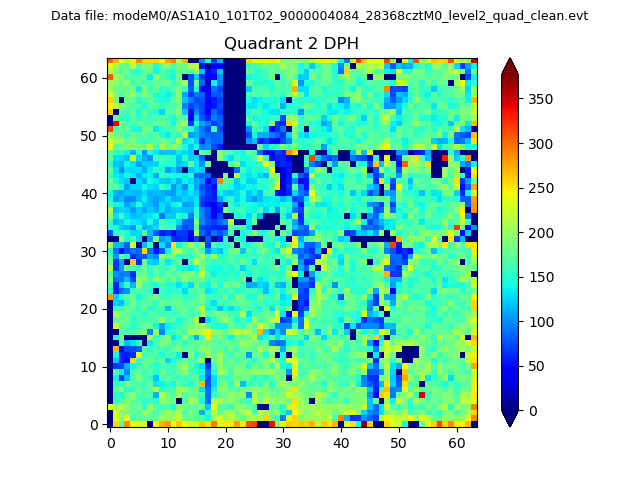
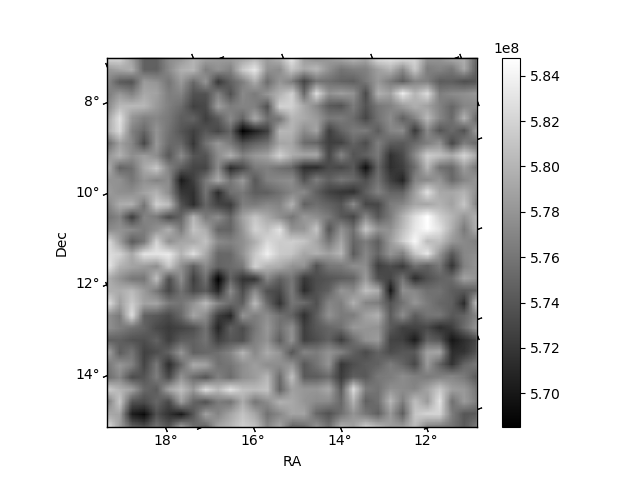
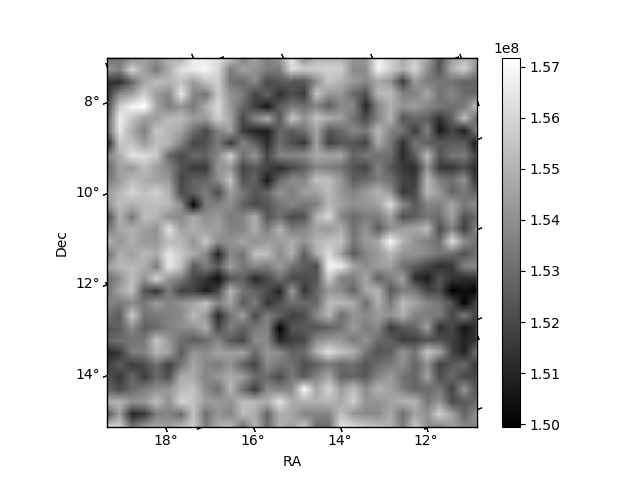
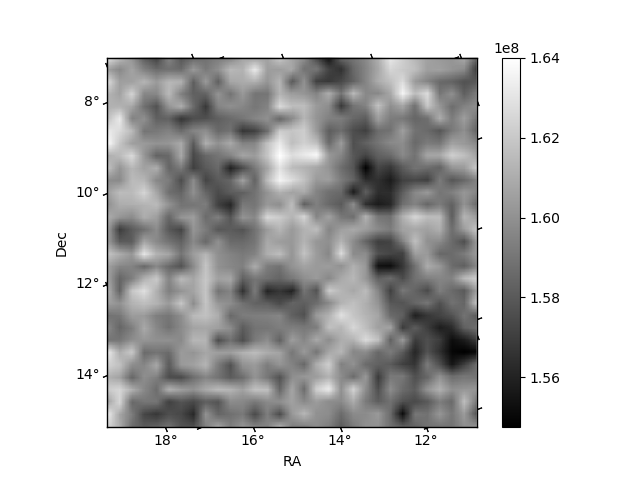
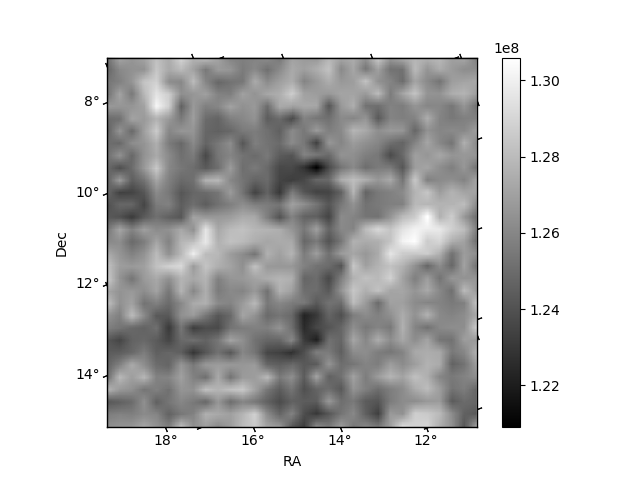
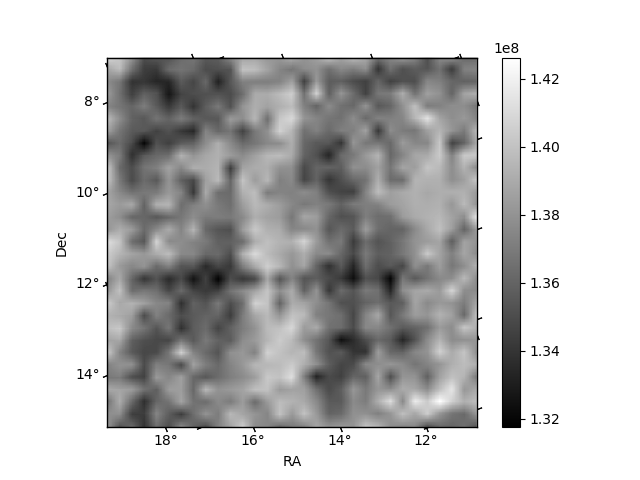
Histogram calculated using DETX and DETY for each event in the final _common_clean file
| Quadrant A | 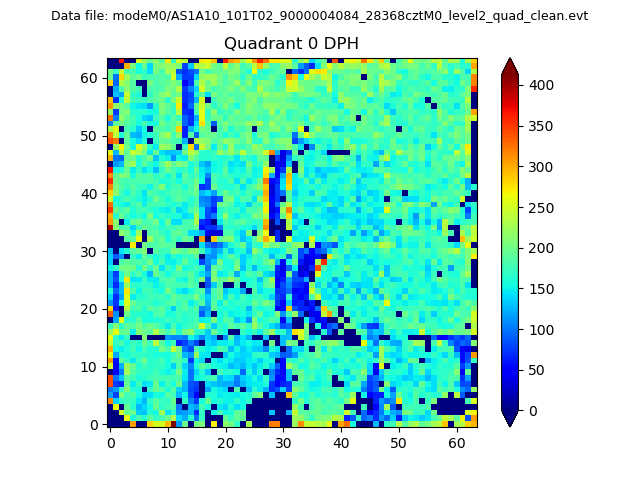 |
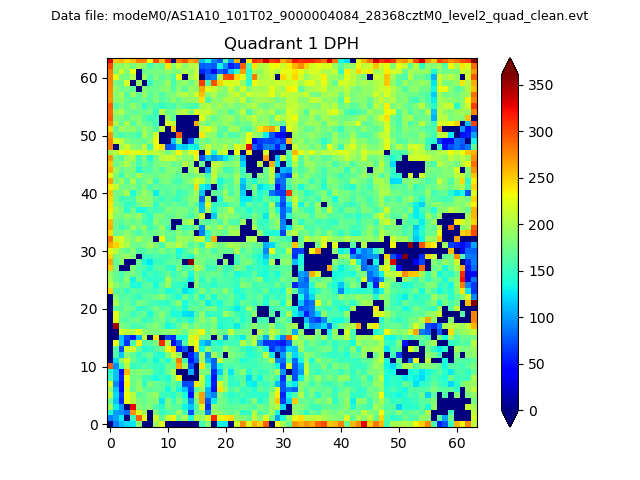 |
Quadrant B |
|---|---|---|---|
| Quadrant D | 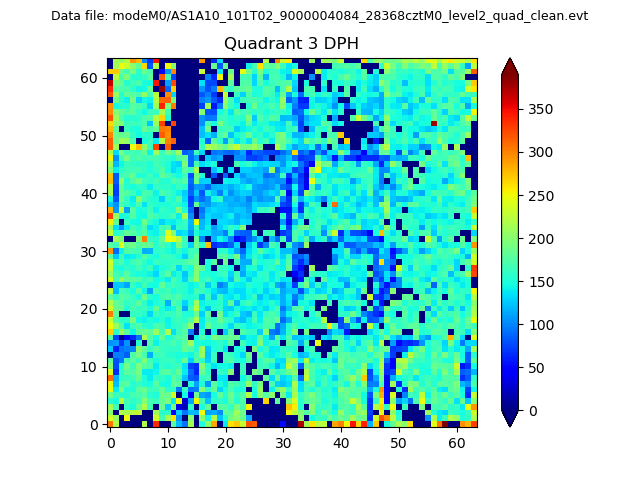 |
 |
Quadrant C |
| Plot type | Count rate plots | Images |
|---|---|---|
| Comparison with Poisson distribution Blue bars denote a histogram of data divided into 1 sec bins. Red curve is a Poisson curve with rate = median count rate of data. |
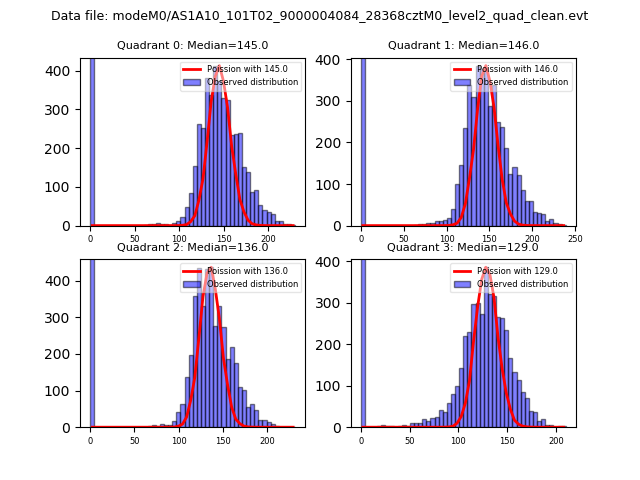 |
 |
| Quadrant-wise count rates Data is divided into 100 sec bins |
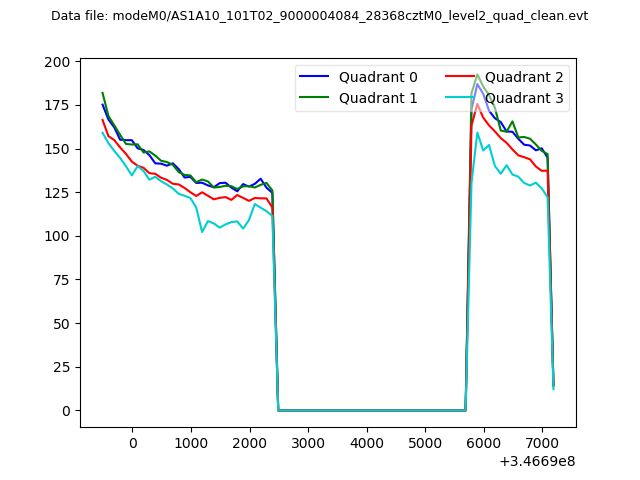 |
|
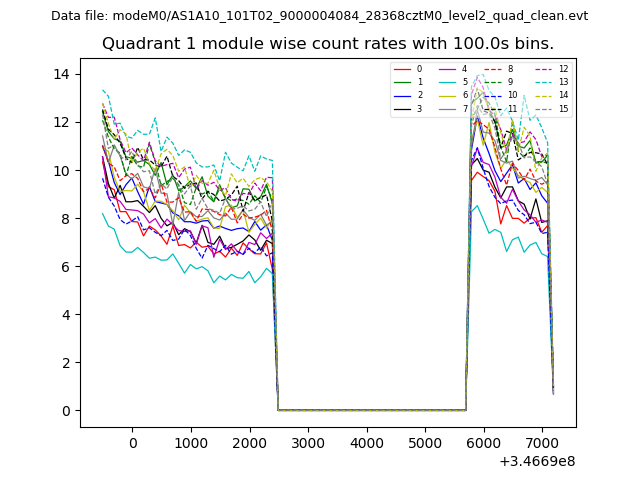
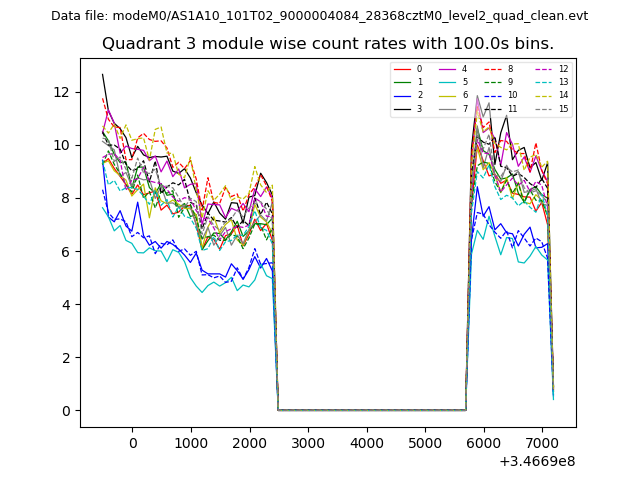
| Module-wise count rates for Quadrant A Data is divided into 100 sec bins |
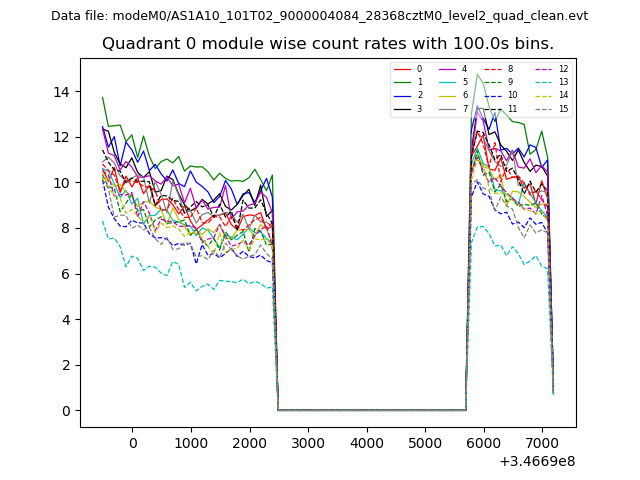 |
 |
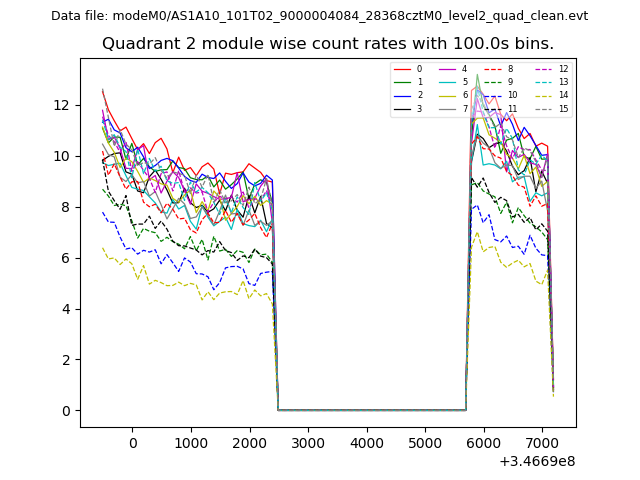
| Module-wise count rates for Quadrant B Data is divided into 100 sec bins |
 |
 |
| Module-wise count rates for Quadrant C Data is divided into 100 sec bins |
 |
 |
| Module-wise count rates for Quadrant D Data is divided into 100 sec bins |
 |
 |
| Parameter | Plot |
|---|---|
| CZT HV Monitor | 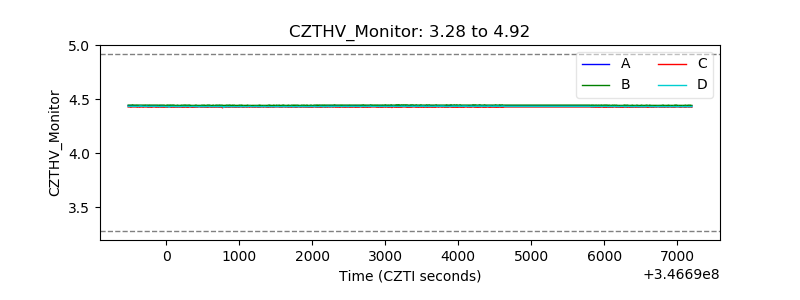 |
| D_VDD | 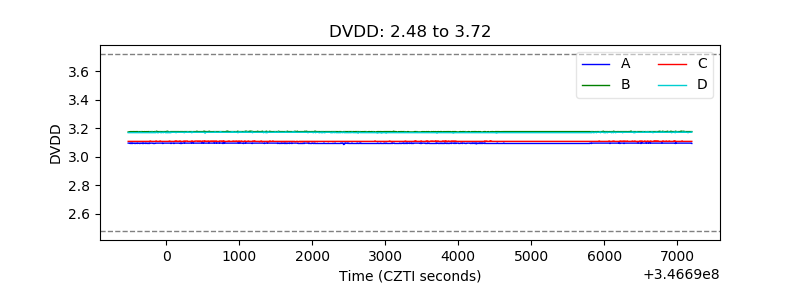 |
| Temperature 1 | 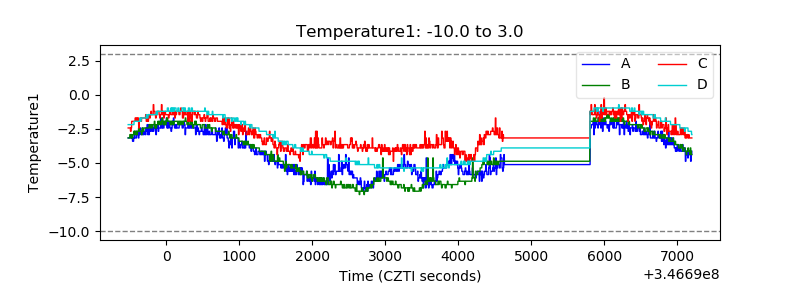 |
| Veto HV Monitor | 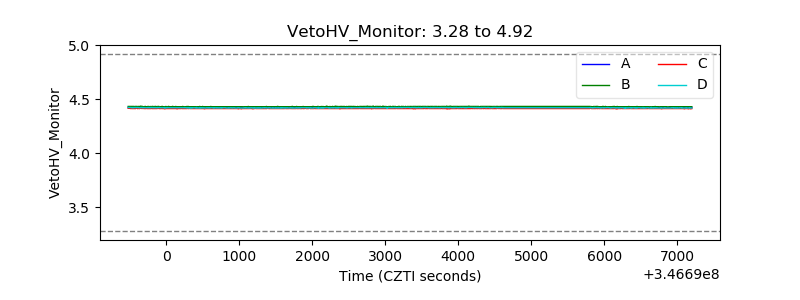 |
| Veto LLD | 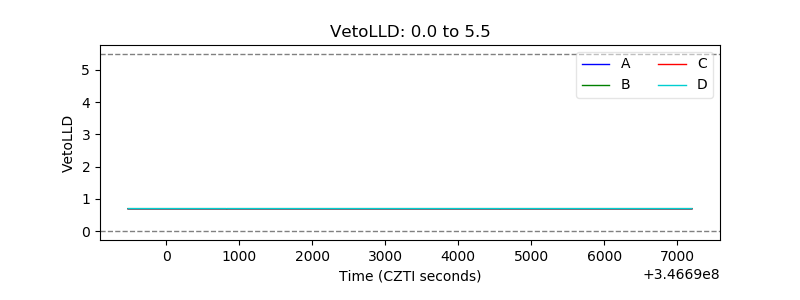 |
| Alpha Counter | 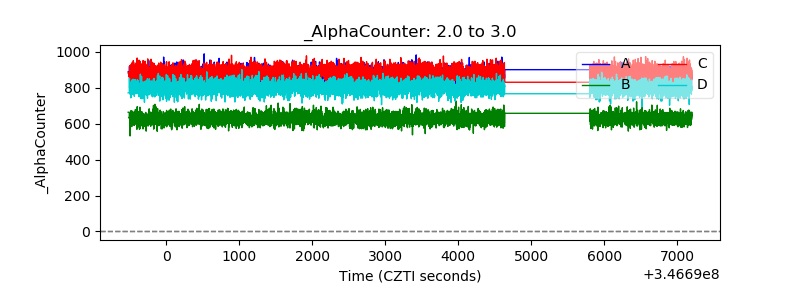 |
| _CPM_Rate | 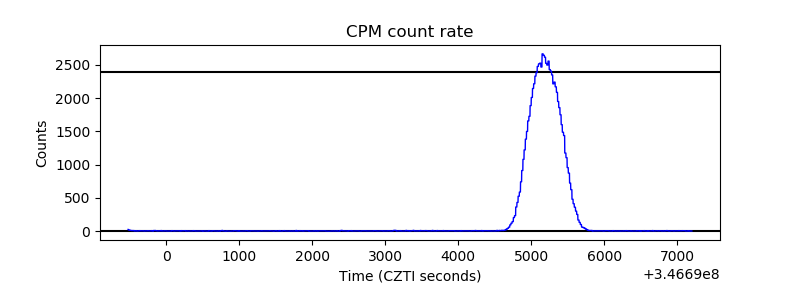 |
| CZT Counter | 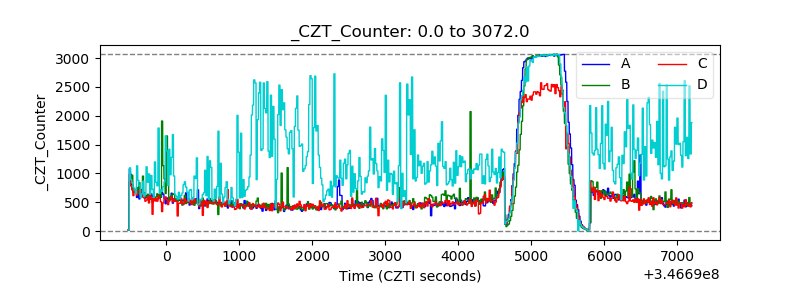 |
| +2.5 Volts monitor | 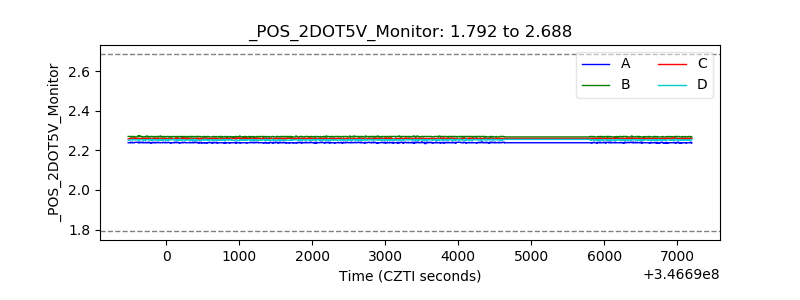 |
| +5 Volts monitor | 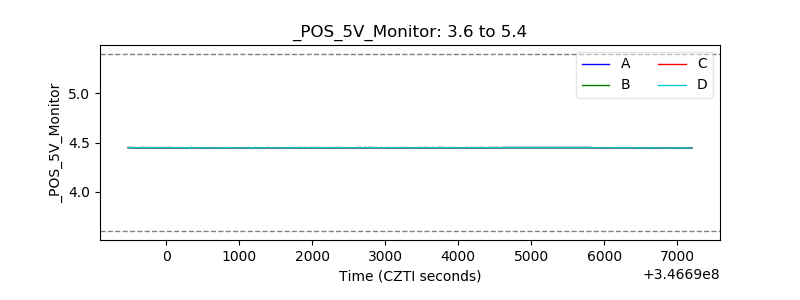 |
| _ROLL_ROT | 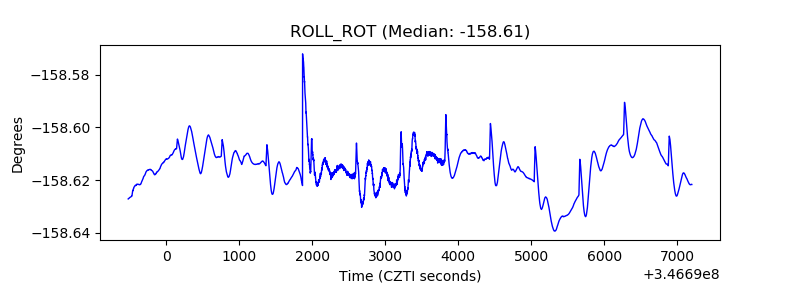 |
| _Roll_DEC | 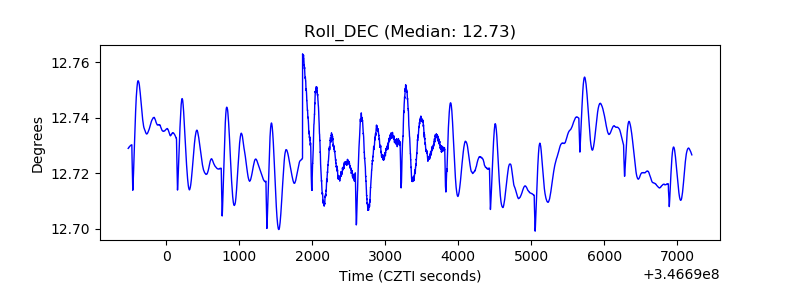 |
| _Roll_RA | 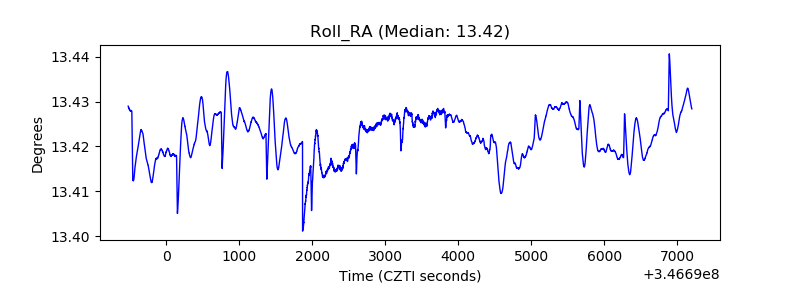 |
| Veto Counter | 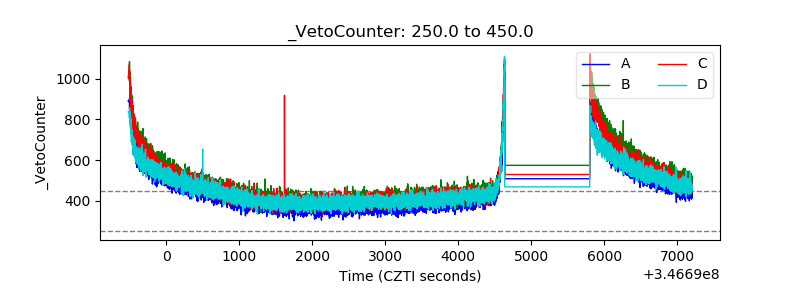 |