| Param | Original file | Final file |
|---|---|---|
| Filename | modeM0/AS1A10_101T02_9000004084_28369cztM0_level2.evt | modeM0/AS1A10_101T02_9000004084_28369cztM0_level2_quad_clean.evt |
| Size (bytes) | 557,268,480 | 91,719,360 |
| Size | 531.5 MB | 87.5 MB |
| Events in quadrant A | 3,806,317 | 597,712 |
| Events in quadrant B | 3,754,826 | 625,613 |
| Events in quadrant C | 3,155,406 | 581,722 |
| Events in quadrant D | 5,742,398 | 541,355 |
| Mode M0 | |||
|---|---|---|---|
| Quadrant | BADHDUFLAG | Total packets | Discarded packets |
| A | 0 | 15235 | 0 |
| B | 0 | 15117 | 0 |
| C | 0 | 13089 | 0 |
| D | 0 | 21301 | 0 |
| Mode M9 | |||
|---|---|---|---|
| Quadrant | BADHDUFLAG | Total packets | Discarded packets |
| A | 0 | 13 | 0 |
| B | 0 | 13 | 0 |
| C | 0 | 13 | 0 |
| D | 0 | 13 | 0 |
| Quadrant | Total seconds | Saturated seconds | Saturation percentage |
|---|---|---|---|
| A | 6176 | 358 | 5.796632% |
| B | 6177 | 85 | 1.376073% |
| C | 6177 | 67 | 1.084669% |
| D | 6177 | 340 | 5.504290% |
Noise dominated data is calculated using 1-second bins in cleaned event files. If a bin has >2000 counts, and if more than 50% of those come from <1% of pixels, then it is considered to be noise-dominated and hence unusable.
| Quadrant | # 1 sec bins | Bins with >0 counts | Bins with >2000 counts | High rate bins dominated by noise | Noise dominated (total time) | Noise dominated (detector-on time) | Marked lightcurve |
|---|---|---|---|---|---|---|---|
| A | 7456 | 6177 | 299 | 299 | 4.01% | 4.84% | 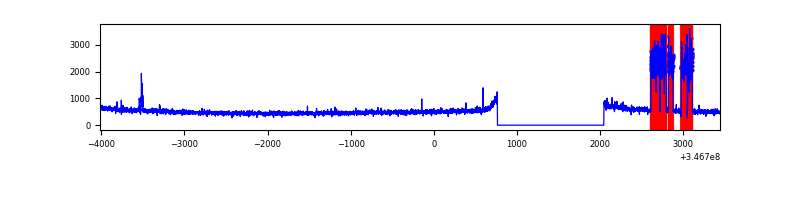 |
| B | 7457 | 6178 | 28 | 28 | 0.38% | 0.45% | 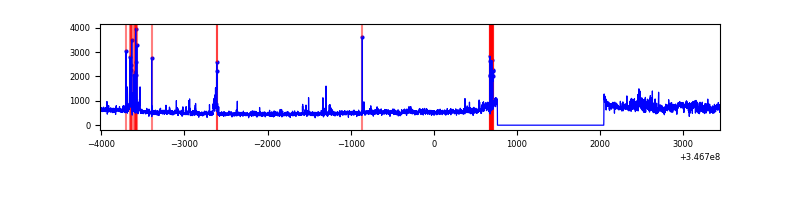 |
| C | 7457 | 6177 | 0 | 0 | 0.00% | 0.00% | 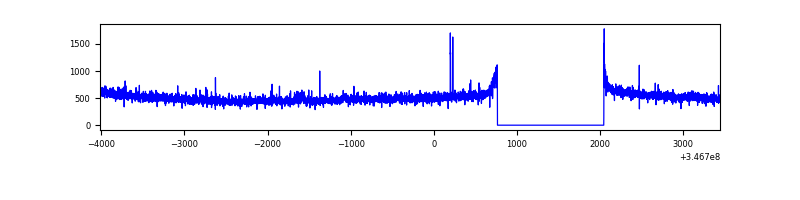 |
| D | 7457 | 6178 | 302 | 302 | 4.05% | 4.89% | 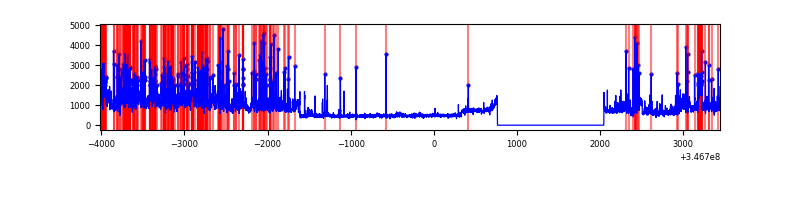 |
Top three noisy pixels from each quadrant. If the there are fewer than three noisy pixels in the level2.evt file, extra rows are filled as -1
| Pixel properties | Quadrant properties | ||||||
|---|---|---|---|---|---|---|---|
| Quadrant | DetID | PixID | Counts | Sigma | Mean | Median | Sigma |
| A | 15 | 174 | 717090 | 4521.23 | 797 | 781 | 158.4 |
| A | 12 | 96 | 14081 | 83.95 | 797 | 781 | 158.4 |
| A | 13 | 254 | 10848 | 63.54 | 797 | 781 | 158.4 |
| B | 10 | 245 | 487987 | 3230.45 | 804 | 785 | 150.8 |
| B | 10 | 246 | 69457 | 455.34 | 804 | 785 | 150.8 |
| B | 0 | 230 | 40026 | 260.19 | 804 | 785 | 150.8 |
| C | 14 | 238 | 127138 | 712.34 | 767 | 774 | 177.4 |
| C | 3 | 233 | 26491 | 144.97 | 767 | 774 | 177.4 |
| C | 0 | 10 | 5494 | 26.61 | 767 | 774 | 177.4 |
| D | 8 | 195 | 1641720 | 8998.49 | 765 | 746 | 182.4 |
| D | 1 | 52 | 905144 | 4959.38 | 765 | 746 | 182.4 |
| D | 7 | 238 | 138486 | 755.32 | 765 | 746 | 182.4 |
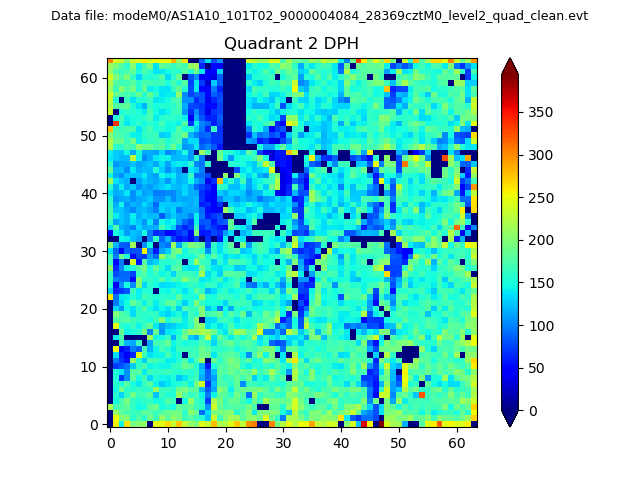
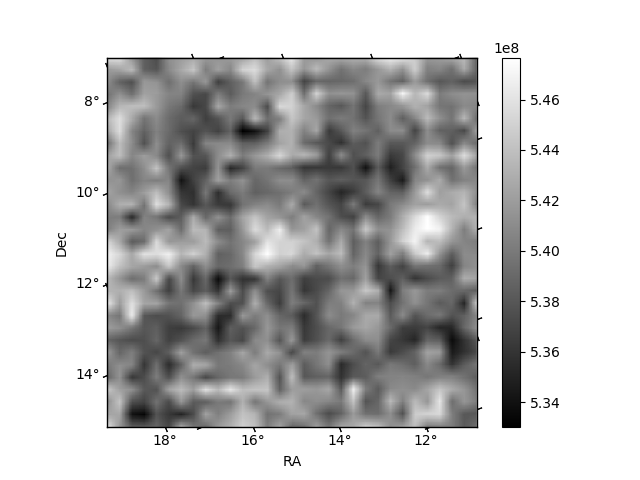
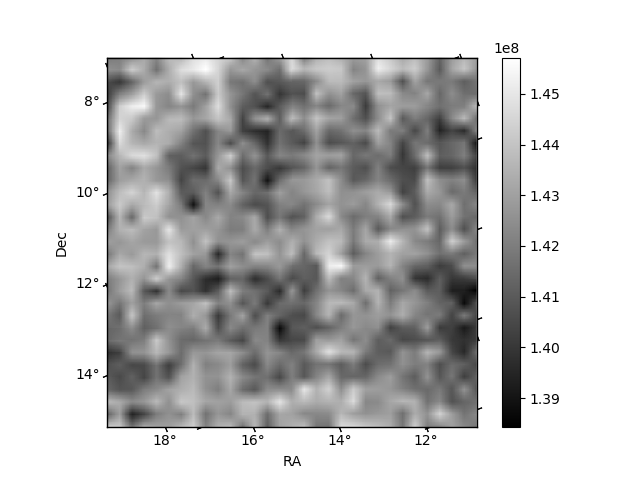
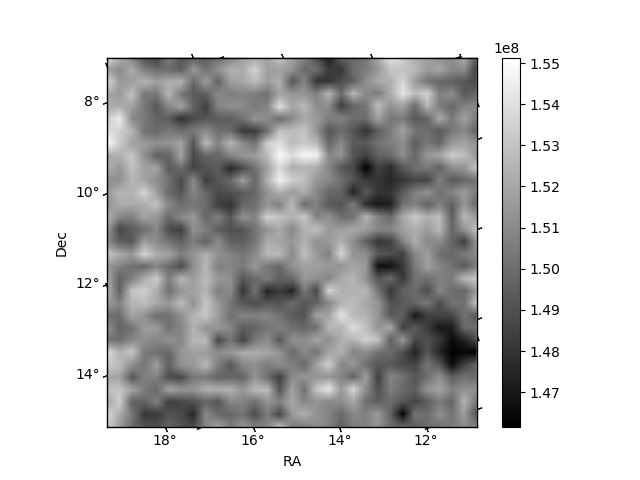
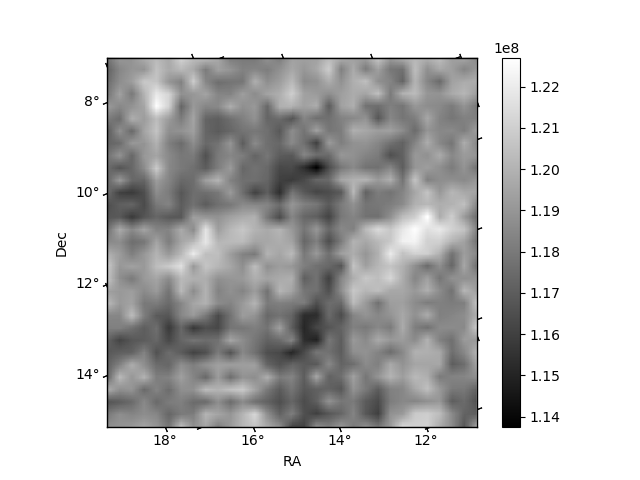
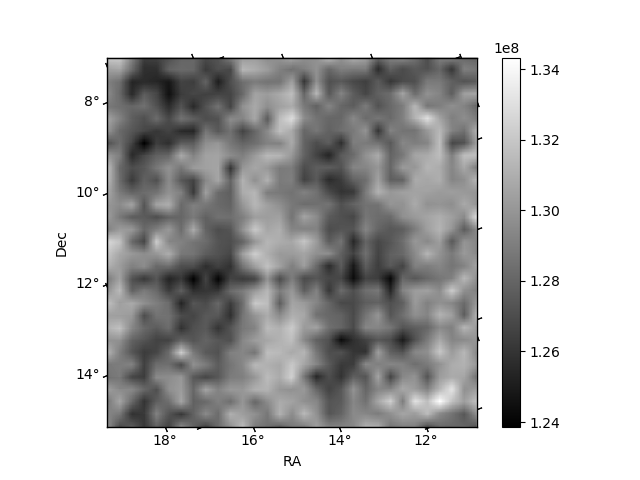
Histogram calculated using DETX and DETY for each event in the final _common_clean file
| Quadrant A | 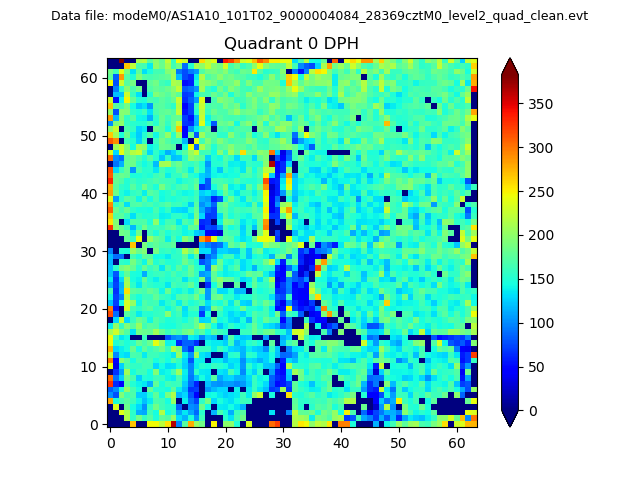 |
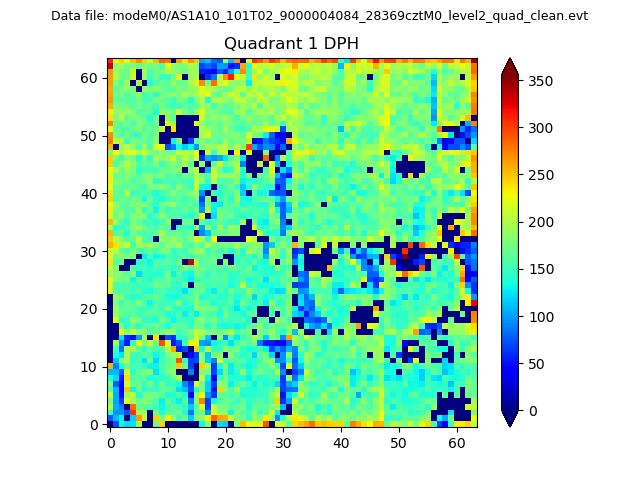 |
Quadrant B |
|---|---|---|---|
| Quadrant D | 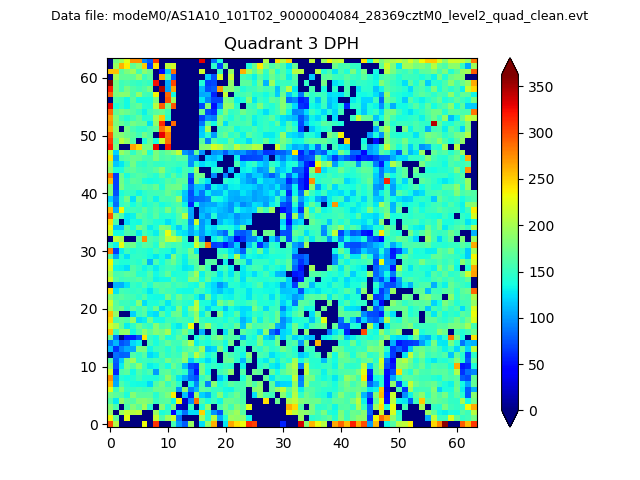 |
 |
Quadrant C |
| Plot type | Count rate plots | Images |
|---|---|---|
| Comparison with Poisson distribution Blue bars denote a histogram of data divided into 1 sec bins. Red curve is a Poisson curve with rate = median count rate of data. |
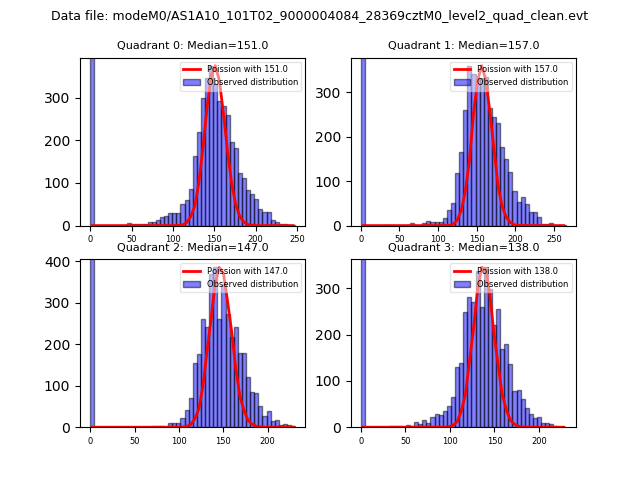 |
 |
| Quadrant-wise count rates Data is divided into 100 sec bins |
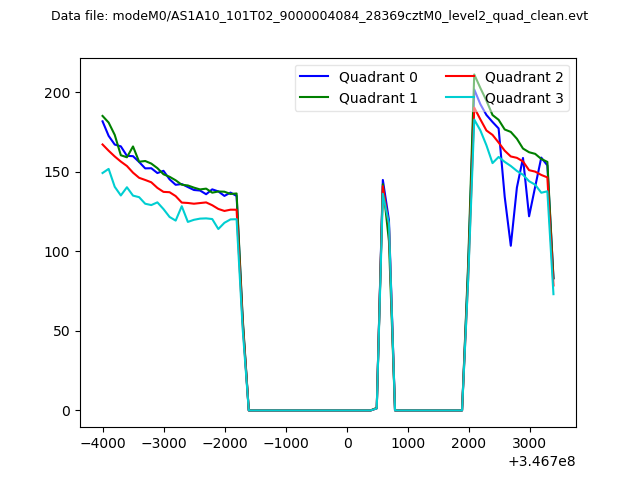 |
|
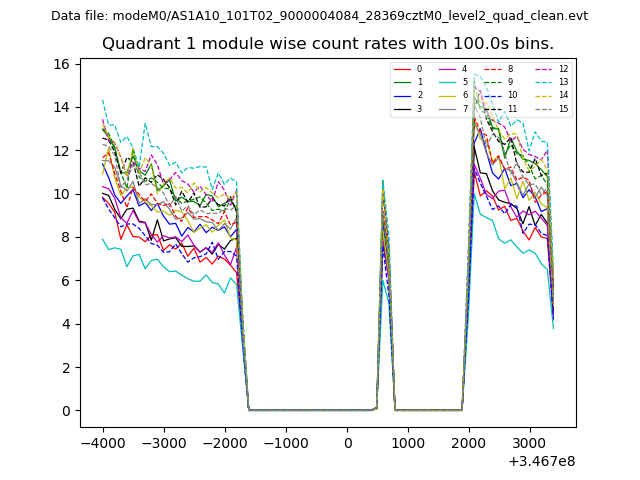
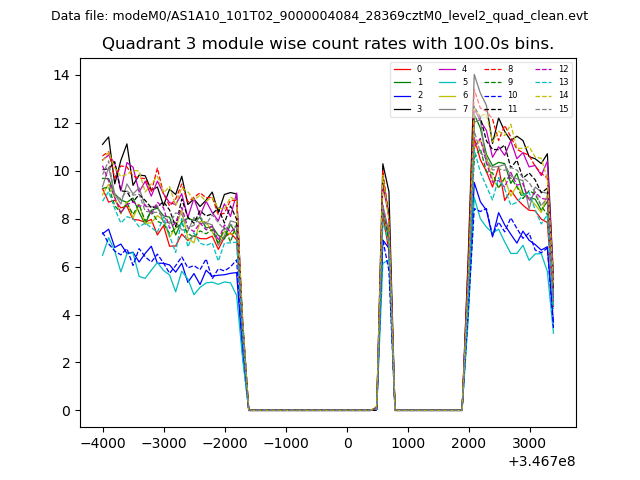
| Module-wise count rates for Quadrant A Data is divided into 100 sec bins |
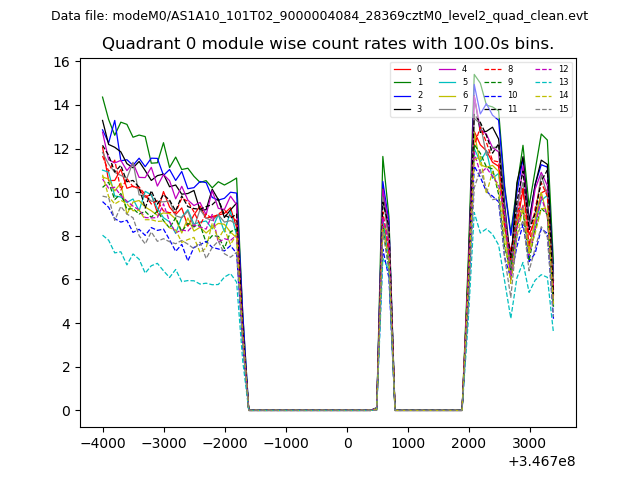 |
 |
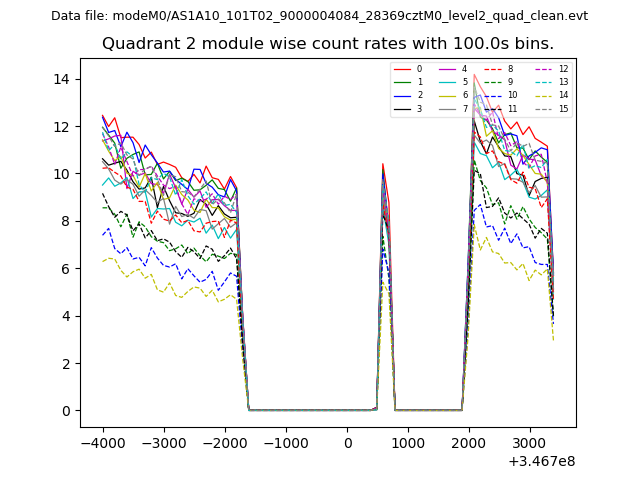
| Module-wise count rates for Quadrant B Data is divided into 100 sec bins |
 |
 |
| Module-wise count rates for Quadrant C Data is divided into 100 sec bins |
 |
 |
| Module-wise count rates for Quadrant D Data is divided into 100 sec bins |
 |
 |
| Parameter | Plot |
|---|---|
| CZT HV Monitor |  |
| D_VDD | 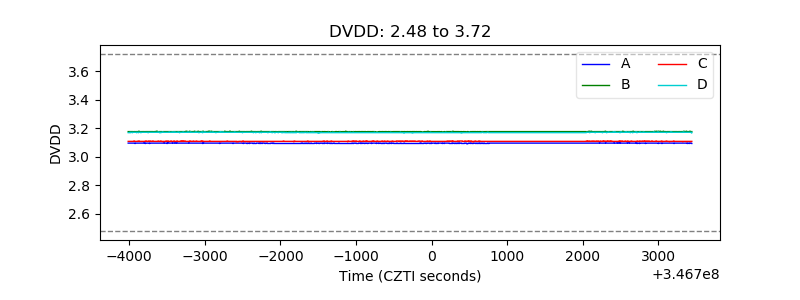 |
| Temperature 1 | 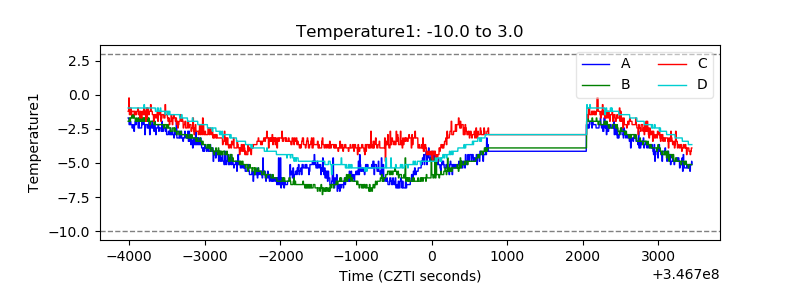 |
| Veto HV Monitor | 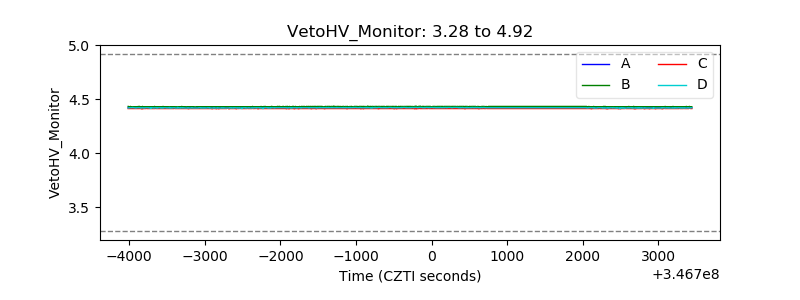 |
| Veto LLD | 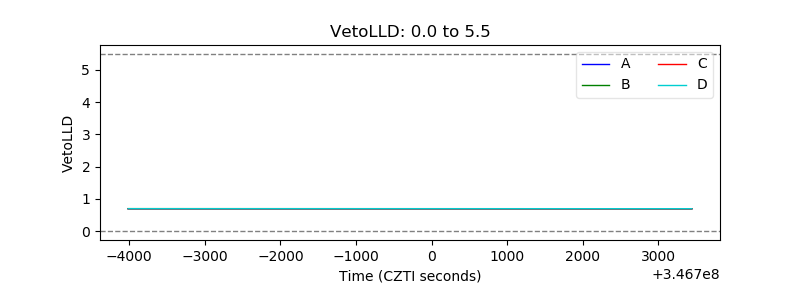 |
| Alpha Counter | 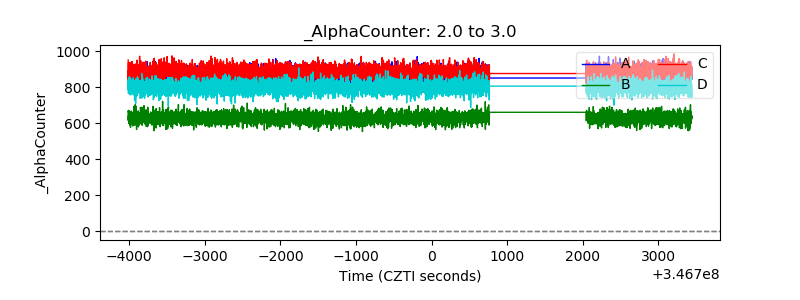 |
| _CPM_Rate | 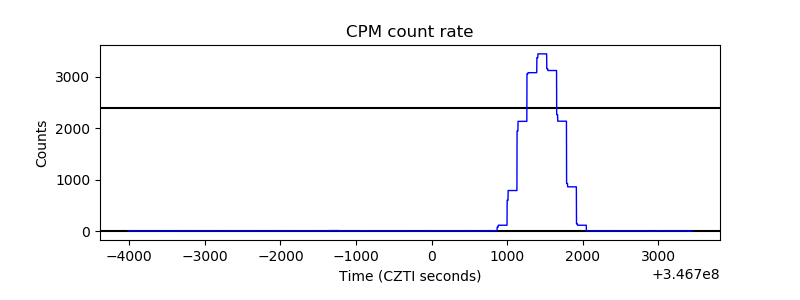 |
| CZT Counter | 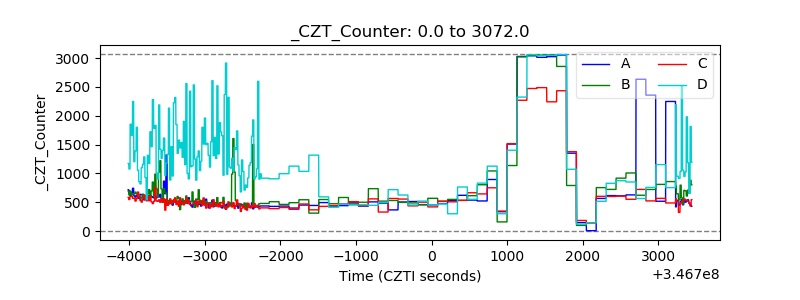 |
| +2.5 Volts monitor |  |
| +5 Volts monitor | 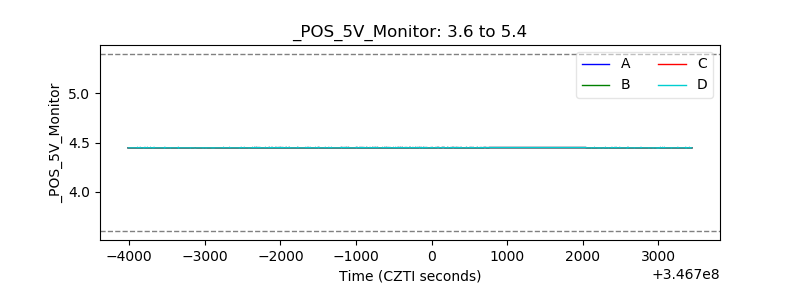 |
| _ROLL_ROT | 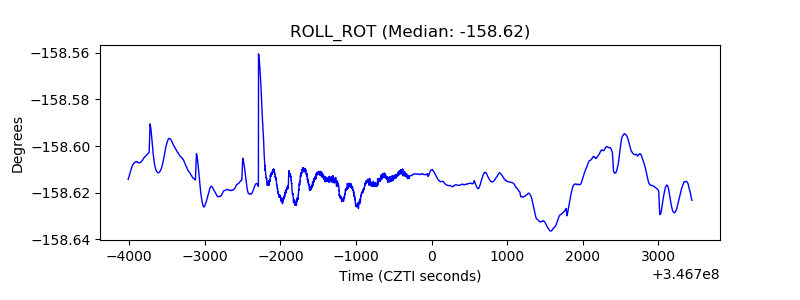 |
| _Roll_DEC | 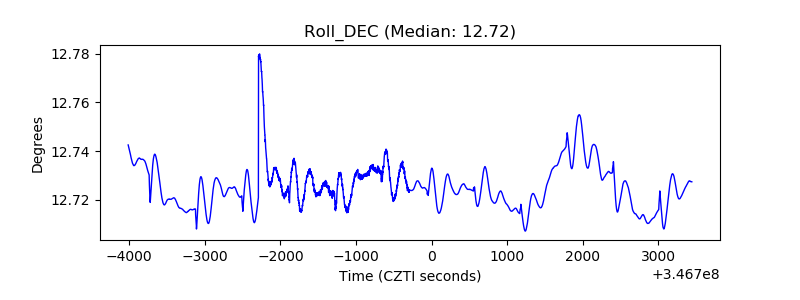 |
| _Roll_RA | 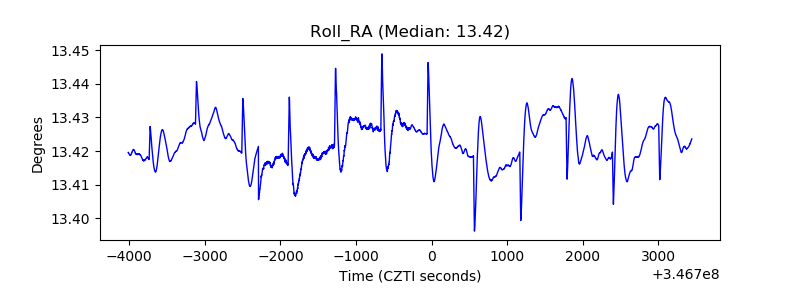 |
| Veto Counter | 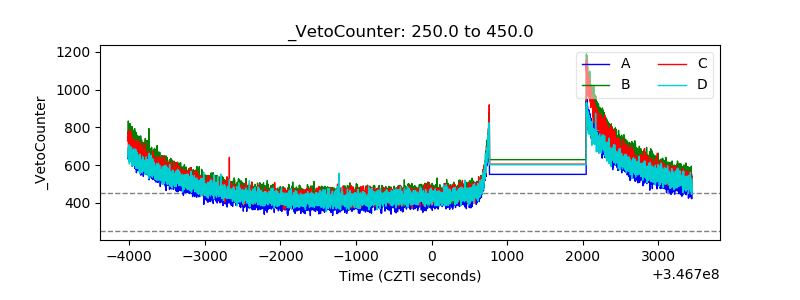 |