| Param | Original file | Final file |
|---|---|---|
| Filename | modeM0/AS1A10_101T02_9000004084_28370cztM0_level2.evt | modeM0/AS1A10_101T02_9000004084_28370cztM0_level2_quad_clean.evt |
| Size (bytes) | 549,224,640 | 94,092,480 |
| Size | 523.8 MB | 89.7 MB |
| Events in quadrant A | 3,953,981 | 613,149 |
| Events in quadrant B | 3,797,398 | 651,551 |
| Events in quadrant C | 3,208,861 | 601,959 |
| Events in quadrant D | 5,261,161 | 557,820 |
| Mode M0 | |||
|---|---|---|---|
| Quadrant | BADHDUFLAG | Total packets | Discarded packets |
| A | 0 | 15461 | 0 |
| B | 0 | 15148 | 0 |
| C | 0 | 13129 | 0 |
| D | 0 | 19822 | 0 |
| Mode M9 | |||
|---|---|---|---|
| Quadrant | BADHDUFLAG | Total packets | Discarded packets |
| A | 0 | 15 | 0 |
| B | 0 | 16 | 0 |
| C | 0 | 16 | 0 |
| D | 0 | 16 | 0 |
| Quadrant | Total seconds | Saturated seconds | Saturation percentage |
|---|---|---|---|
| A | 6083 | 349 | 5.737301% |
| B | 6083 | 49 | 0.805524% |
| C | 6083 | 51 | 0.838402% |
| D | 6082 | 243 | 3.995396% |
Noise dominated data is calculated using 1-second bins in cleaned event files. If a bin has >2000 counts, and if more than 50% of those come from <1% of pixels, then it is considered to be noise-dominated and hence unusable.
| Quadrant | # 1 sec bins | Bins with >0 counts | Bins with >2000 counts | High rate bins dominated by noise | Noise dominated (total time) | Noise dominated (detector-on time) | Marked lightcurve |
|---|---|---|---|---|---|---|---|
| A | 7438 | 6084 | 299 | 299 | 4.02% | 4.91% | 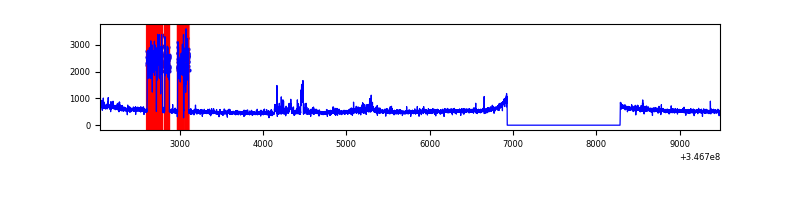 |
| B | 7438 | 6084 | 2 | 2 | 0.03% | 0.03% | 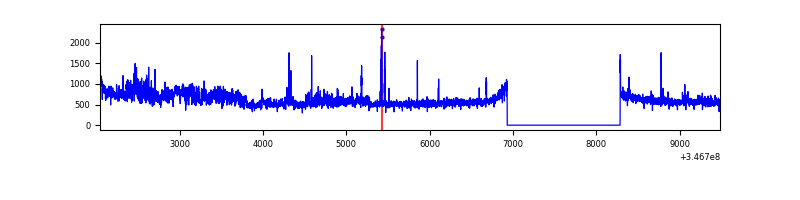 |
| C | 7438 | 6084 | 0 | 0 | 0.00% | 0.00% | 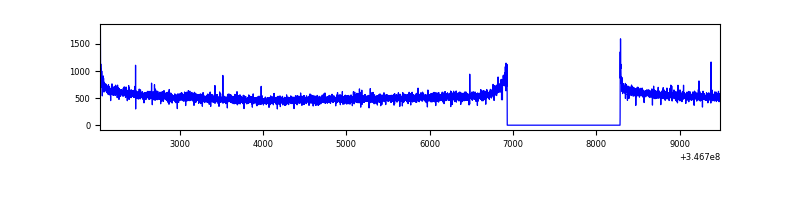 |
| D | 7437 | 6083 | 233 | 233 | 3.13% | 3.83% | 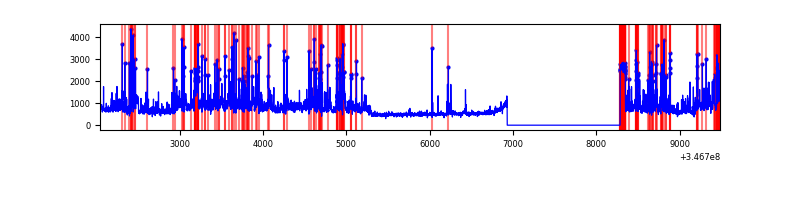 |
Top three noisy pixels from each quadrant. If the there are fewer than three noisy pixels in the level2.evt file, extra rows are filled as -1
| Pixel properties | Quadrant properties | ||||||
|---|---|---|---|---|---|---|---|
| Quadrant | DetID | PixID | Counts | Sigma | Mean | Median | Sigma |
| A | 15 | 174 | 819481 | 5087.64 | 810 | 798 | 160.9 |
| A | 13 | 254 | 11555 | 66.85 | 810 | 798 | 160.9 |
| A | 12 | 96 | 9133 | 51.8 | 810 | 798 | 160.9 |
| B | 10 | 245 | 503790 | 3248.26 | 824 | 806 | 154.8 |
| B | 10 | 246 | 38757 | 245.09 | 824 | 806 | 154.8 |
| B | 0 | 230 | 23347 | 145.57 | 824 | 806 | 154.8 |
| C | 14 | 238 | 128619 | 699.84 | 785 | 790 | 182.7 |
| C | 0 | 10 | 10162 | 51.31 | 785 | 790 | 182.7 |
| C | 1 | 16 | 5444 | 25.48 | 785 | 790 | 182.7 |
| D | 8 | 195 | 1213305 | 6674.79 | 772 | 754 | 181.7 |
| D | 1 | 52 | 626114 | 3442.45 | 772 | 754 | 181.7 |
| D | 2 | 250 | 172911 | 947.68 | 772 | 754 | 181.7 |
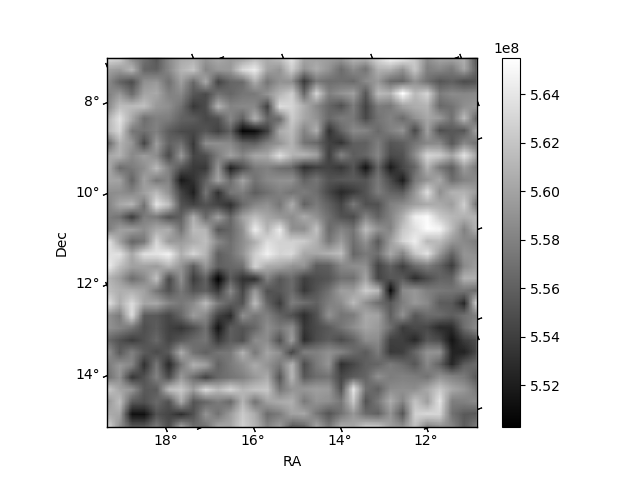
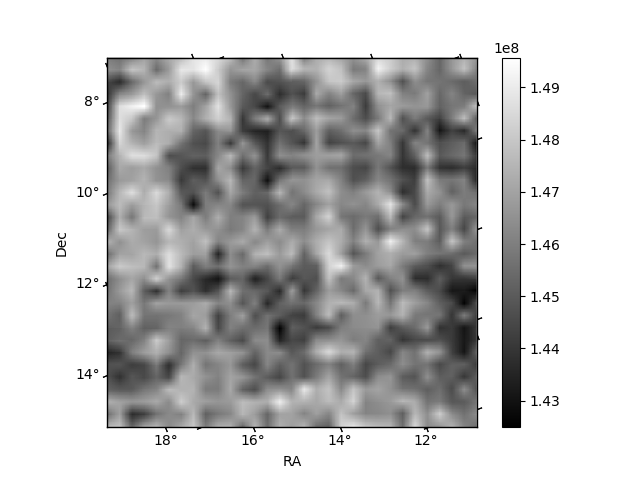
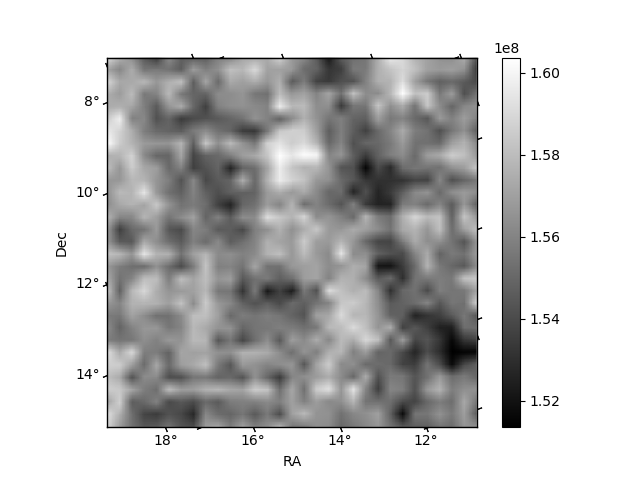
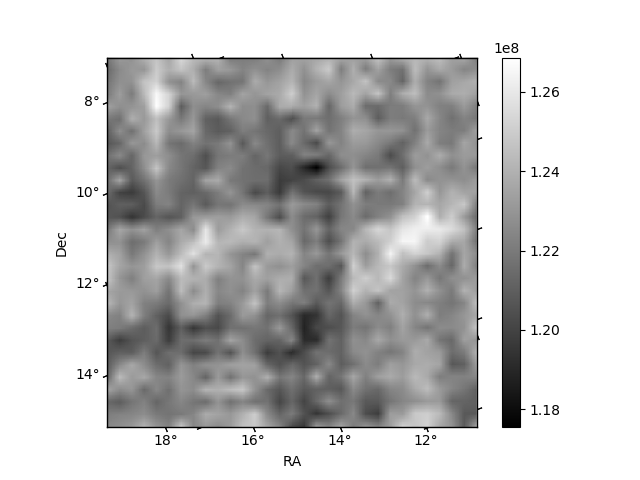
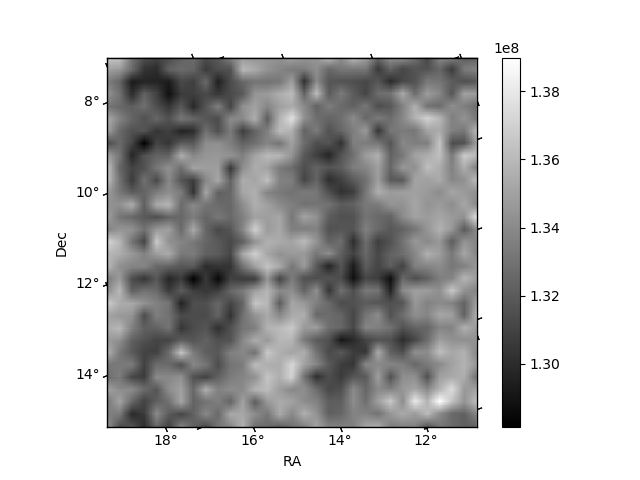
Histogram calculated using DETX and DETY for each event in the final _common_clean file
| Quadrant A | 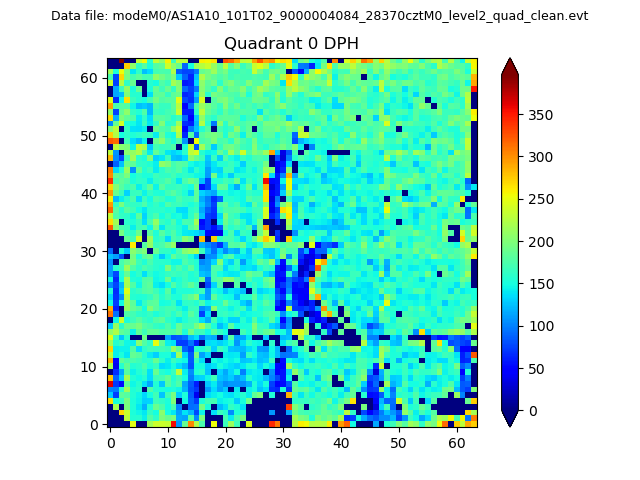 |
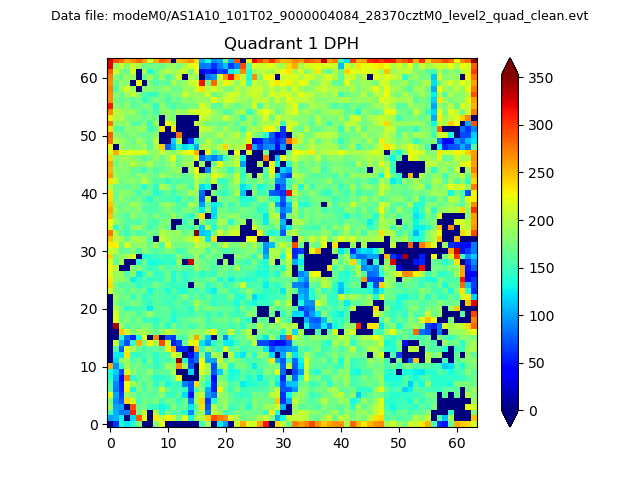 |
Quadrant B |
|---|---|---|---|
| Quadrant D | 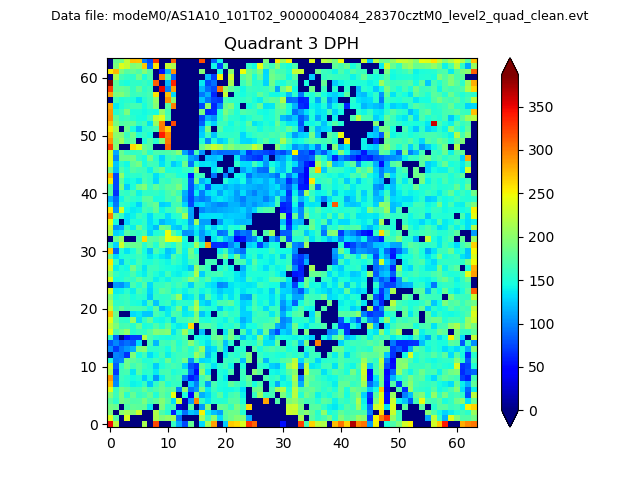 |
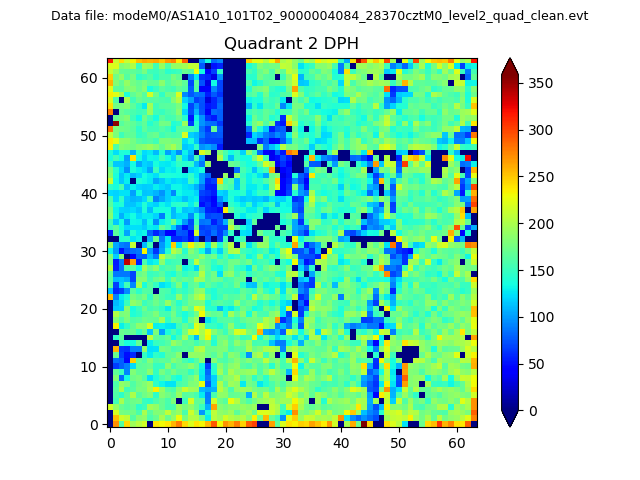 |
Quadrant C |
| Plot type | Count rate plots | Images |
|---|---|---|
| Comparison with Poisson distribution Blue bars denote a histogram of data divided into 1 sec bins. Red curve is a Poisson curve with rate = median count rate of data. |
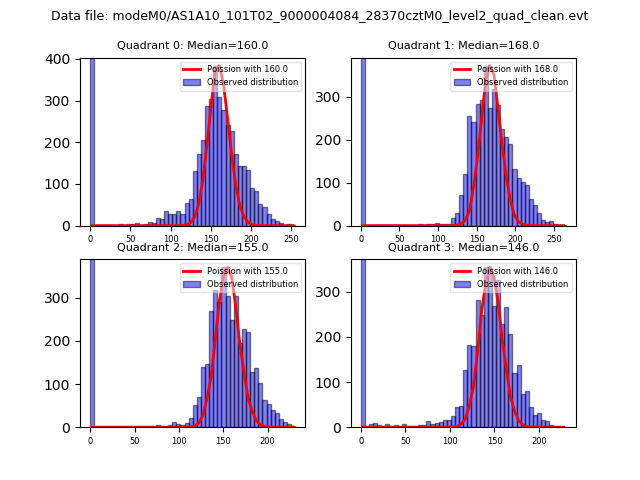 |
 |
| Quadrant-wise count rates Data is divided into 100 sec bins |
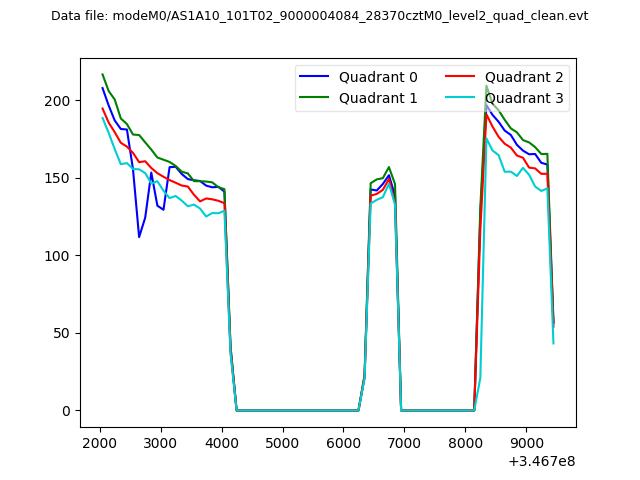 |
|
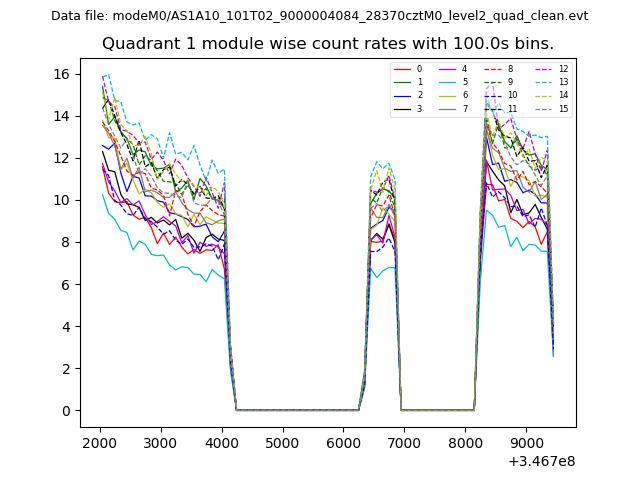
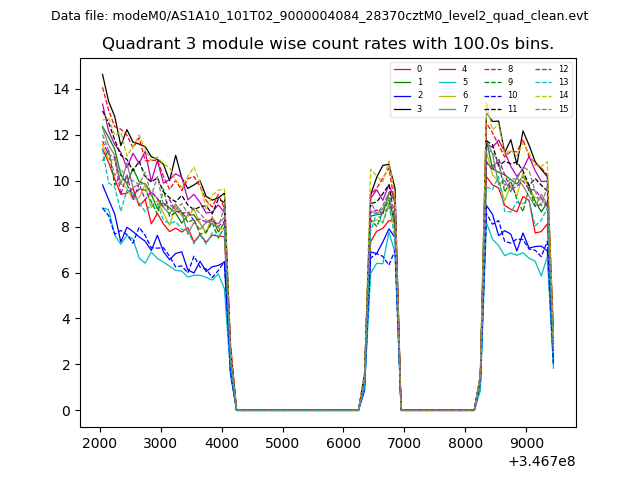
| Module-wise count rates for Quadrant A Data is divided into 100 sec bins |
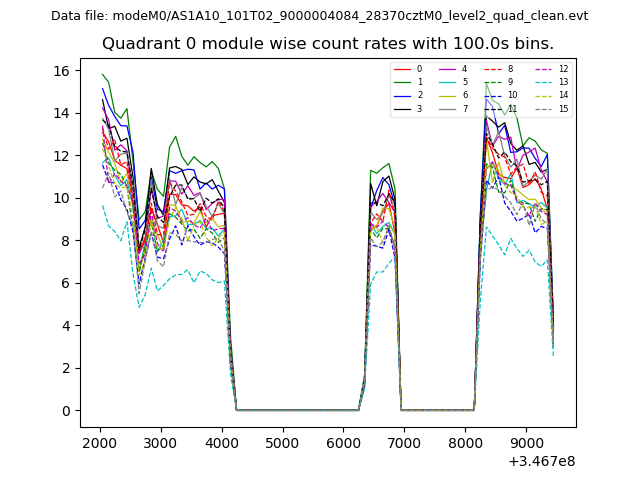 |
 |
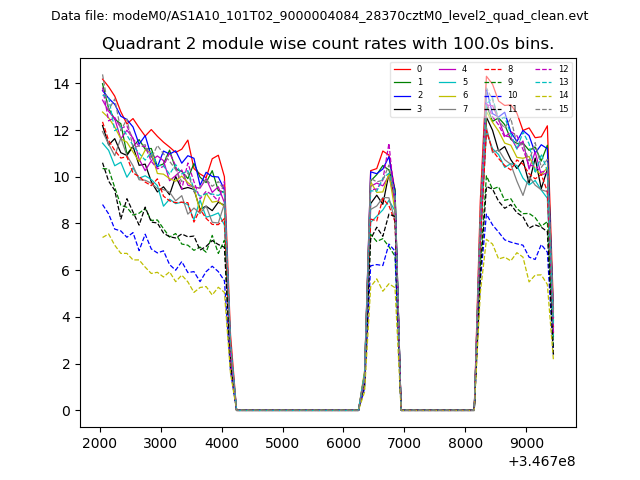
| Module-wise count rates for Quadrant B Data is divided into 100 sec bins |
 |
 |
| Module-wise count rates for Quadrant C Data is divided into 100 sec bins |
 |
 |
| Module-wise count rates for Quadrant D Data is divided into 100 sec bins |
 |
 |
| Parameter | Plot |
|---|---|
| CZT HV Monitor | 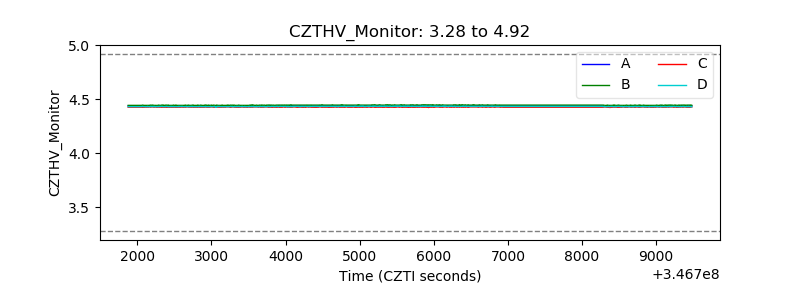 |
| D_VDD | 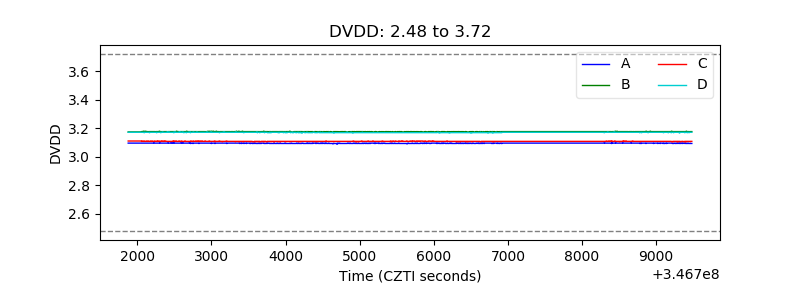 |
| Temperature 1 | 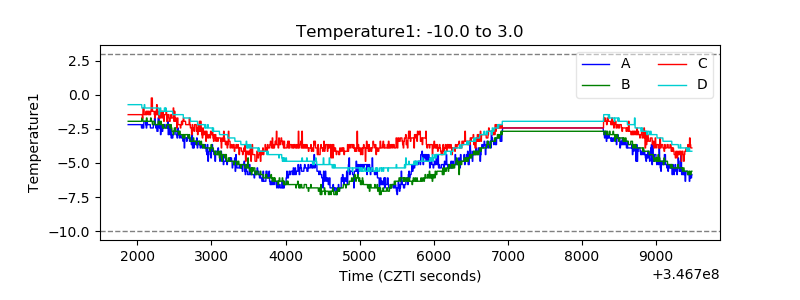 |
| Veto HV Monitor | 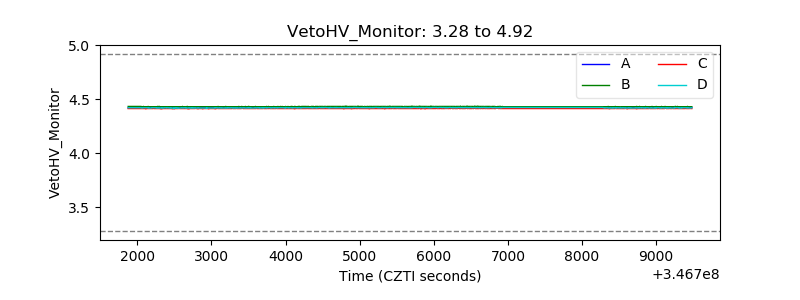 |
| Veto LLD | 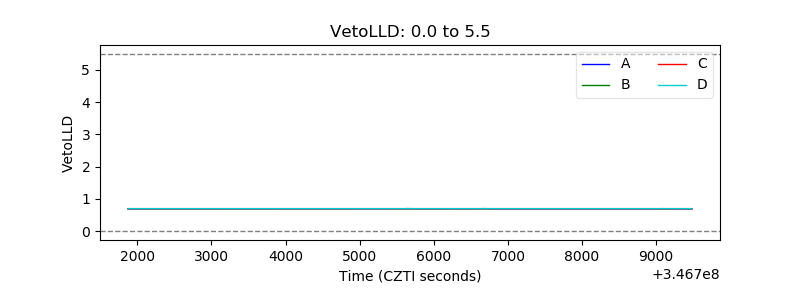 |
| Alpha Counter | 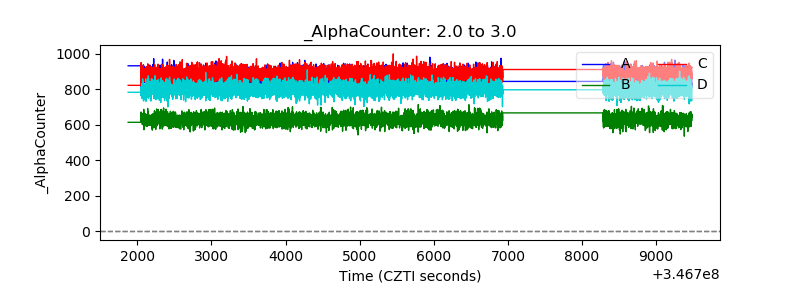 |
| _CPM_Rate | 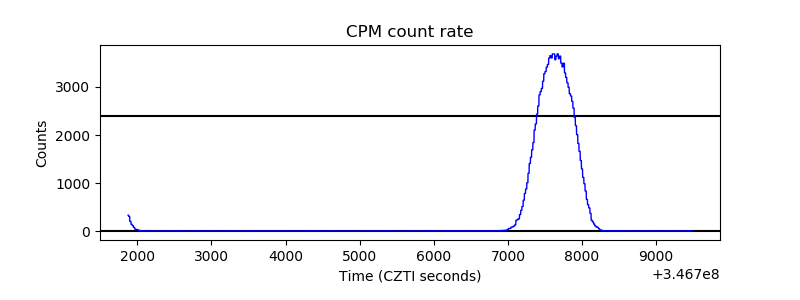 |
| CZT Counter | 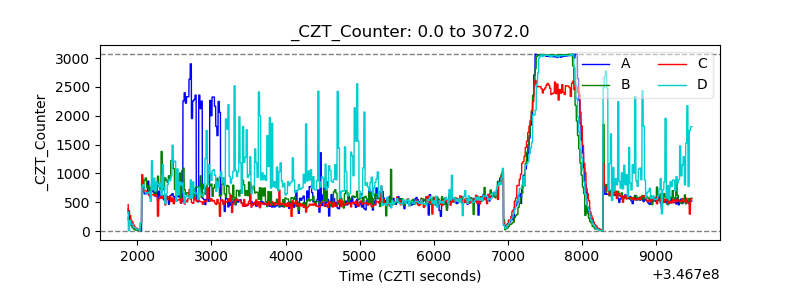 |
| +2.5 Volts monitor |  |
| +5 Volts monitor |  |
| _ROLL_ROT | 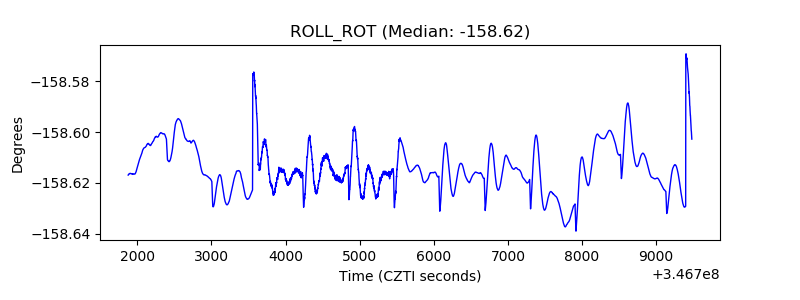 |
| _Roll_DEC | 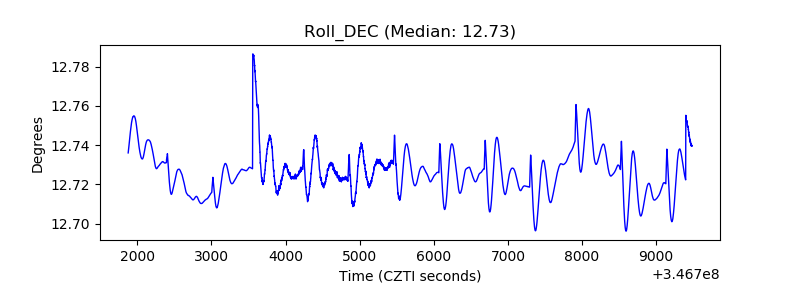 |
| _Roll_RA | 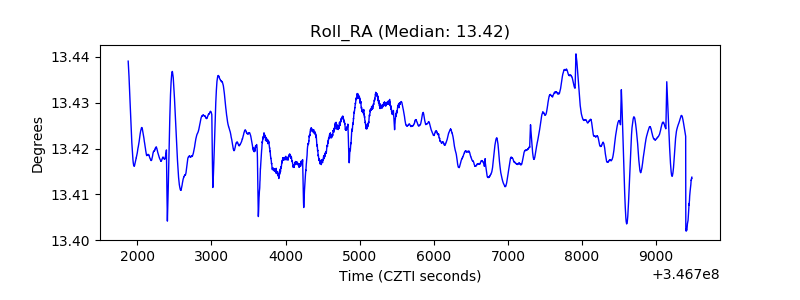 |
| Veto Counter | 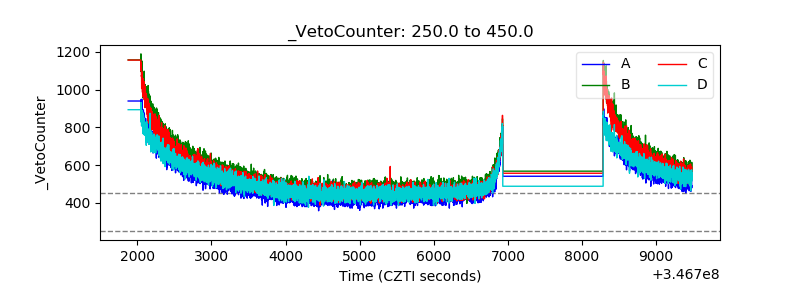 |