| Param | Original file | Final file |
|---|---|---|
| Filename | modeM0/AS1A10_101T02_9000004084_28371cztM0_level2.evt | modeM0/AS1A10_101T02_9000004084_28371cztM0_level2_quad_clean.evt |
| Size (bytes) | 501,822,720 | 96,949,440 |
| Size | 478.6 MB | 92.5 MB |
| Events in quadrant A | 3,238,378 | 644,108 |
| Events in quadrant B | 3,570,902 | 664,882 |
| Events in quadrant C | 3,284,662 | 616,490 |
| Events in quadrant D | 4,681,628 | 575,986 |
| Mode M0 | |||
|---|---|---|---|
| Quadrant | BADHDUFLAG | Total packets | Discarded packets |
| A | 0 | 13283 | 0 |
| B | 0 | 14342 | 0 |
| C | 0 | 13355 | 0 |
| D | 0 | 18064 | 0 |
| Mode M9 | |||
|---|---|---|---|
| Quadrant | BADHDUFLAG | Total packets | Discarded packets |
| A | 0 | 23 | 0 |
| B | 0 | 24 | 0 |
| C | 0 | 24 | 0 |
| D | 0 | 24 | 0 |
| Quadrant | Total seconds | Saturated seconds | Saturation percentage |
|---|---|---|---|
| A | 6229 | 39 | 0.626104% |
| B | 6229 | 100 | 1.605394% |
| C | 6229 | 90 | 1.444855% |
| D | 6229 | 230 | 3.692406% |
Noise dominated data is calculated using 1-second bins in cleaned event files. If a bin has >2000 counts, and if more than 50% of those come from <1% of pixels, then it is considered to be noise-dominated and hence unusable.
| Quadrant | # 1 sec bins | Bins with >0 counts | Bins with >2000 counts | High rate bins dominated by noise | Noise dominated (total time) | Noise dominated (detector-on time) | Marked lightcurve |
|---|---|---|---|---|---|---|---|
| A | 7594 | 6230 | 0 | 0 | 0.00% | 0.00% | 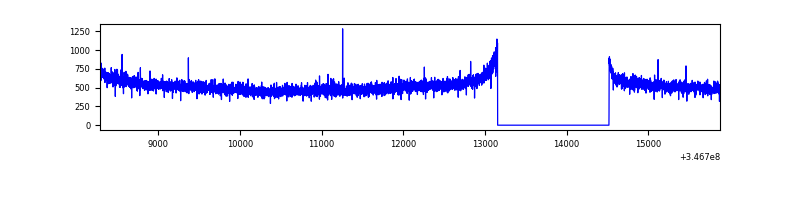 |
| B | 7594 | 6229 | 18 | 18 | 0.24% | 0.29% | 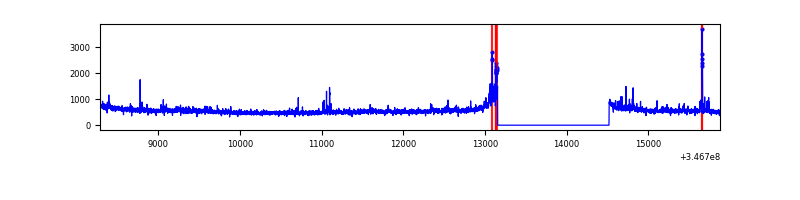 |
| C | 7594 | 6230 | 0 | 0 | 0.00% | 0.00% | 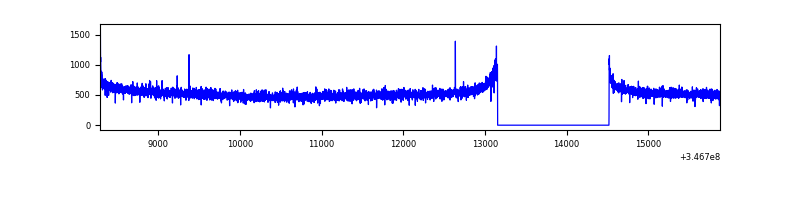 |
| D | 7594 | 6230 | 178 | 178 | 2.34% | 2.86% | 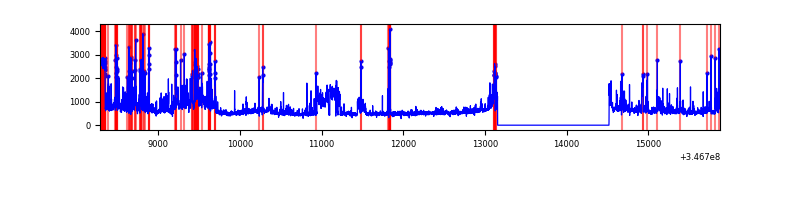 |
Top three noisy pixels from each quadrant. If the there are fewer than three noisy pixels in the level2.evt file, extra rows are filled as -1
| Pixel properties | Quadrant properties | ||||||
|---|---|---|---|---|---|---|---|
| Quadrant | DetID | PixID | Counts | Sigma | Mean | Median | Sigma |
| A | 13 | 254 | 11746 | 65.79 | 837 | 824 | 166.0 |
| A | 3 | 137 | 7623 | 40.95 | 837 | 824 | 166.0 |
| A | 0 | 226 | 7223 | 38.54 | 837 | 824 | 166.0 |
| B | 10 | 245 | 243614 | 1562.73 | 841 | 824 | 155.4 |
| B | 0 | 230 | 20925 | 129.38 | 841 | 824 | 155.4 |
| B | 12 | 111 | 18572 | 114.24 | 841 | 824 | 155.4 |
| C | 14 | 238 | 131697 | 699.19 | 805 | 813 | 187.2 |
| C | 7 | 220 | 8420 | 40.63 | 805 | 813 | 187.2 |
| C | 0 | 10 | 7395 | 35.16 | 805 | 813 | 187.2 |
| D | 7 | 238 | 528325 | 2804.92 | 788 | 767 | 188.1 |
| D | 1 | 52 | 385510 | 2045.6 | 788 | 767 | 188.1 |
| D | 8 | 195 | 384514 | 2040.3 | 788 | 767 | 188.1 |
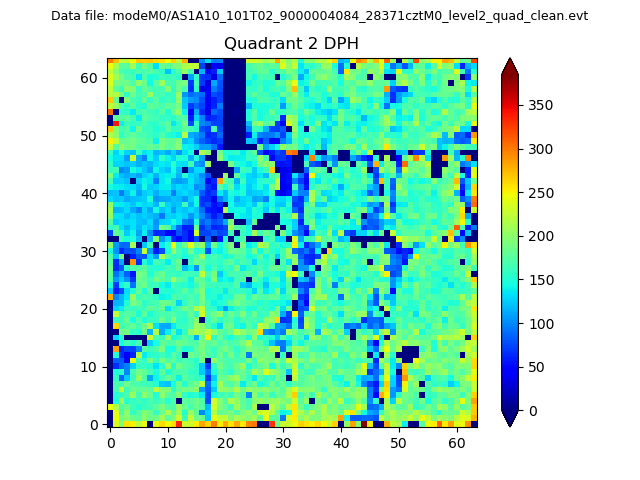
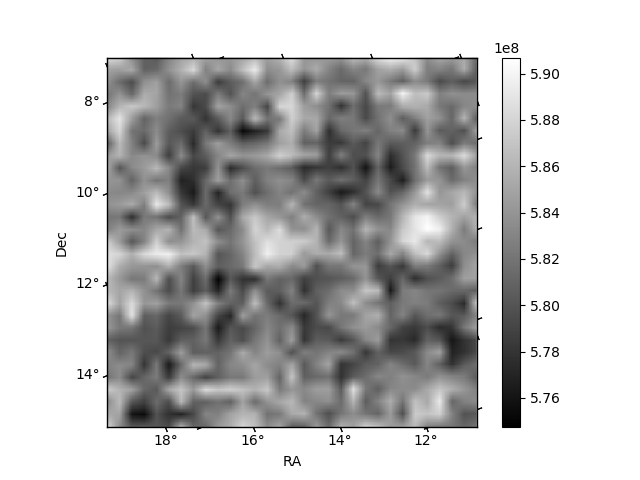
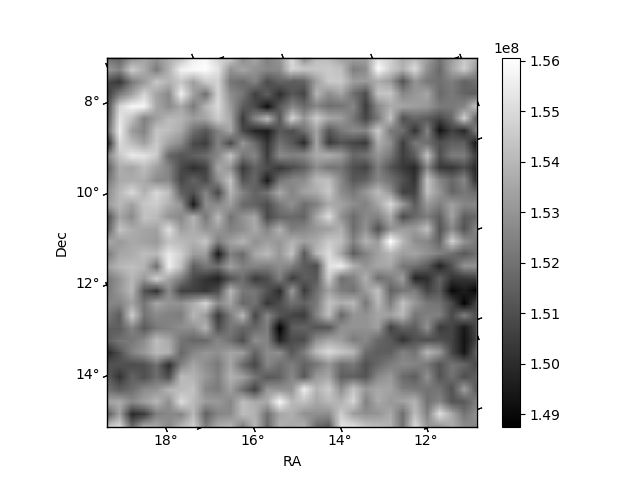
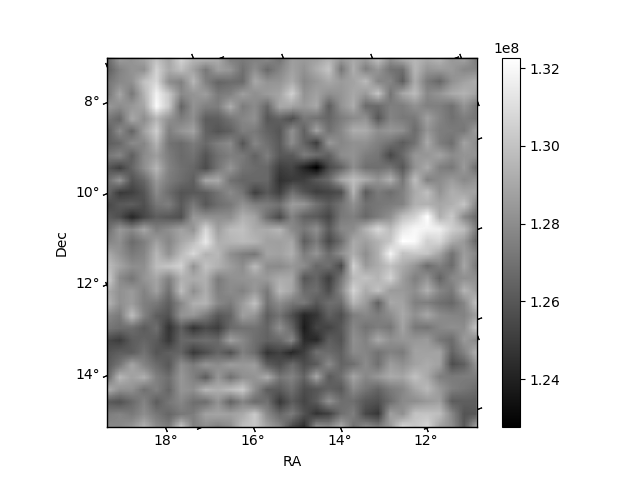
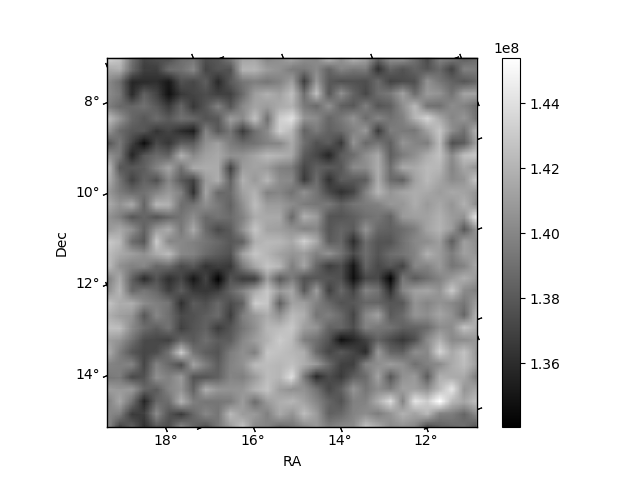
Histogram calculated using DETX and DETY for each event in the final _common_clean file
| Quadrant A | 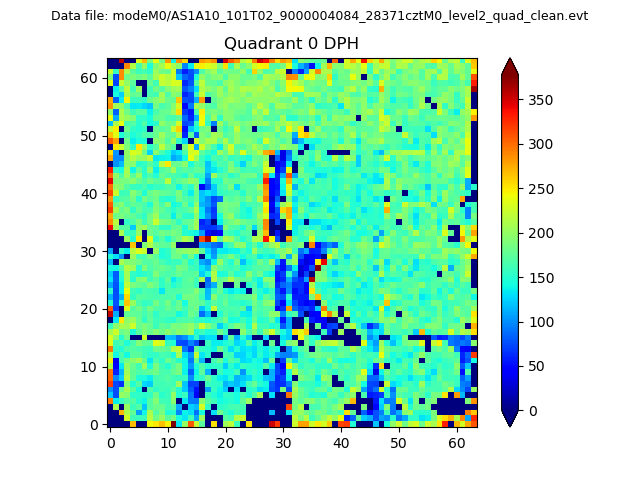 |
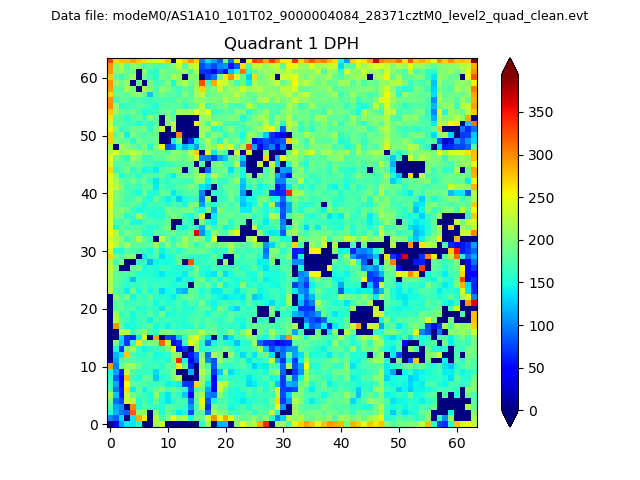 |
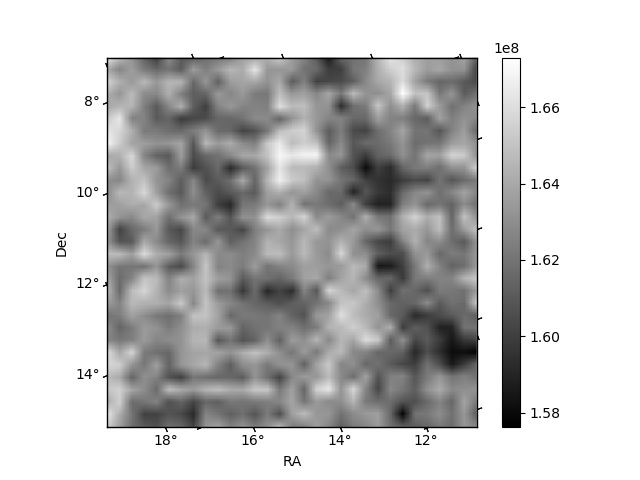
Quadrant B |
|---|---|---|---|
| Quadrant D | 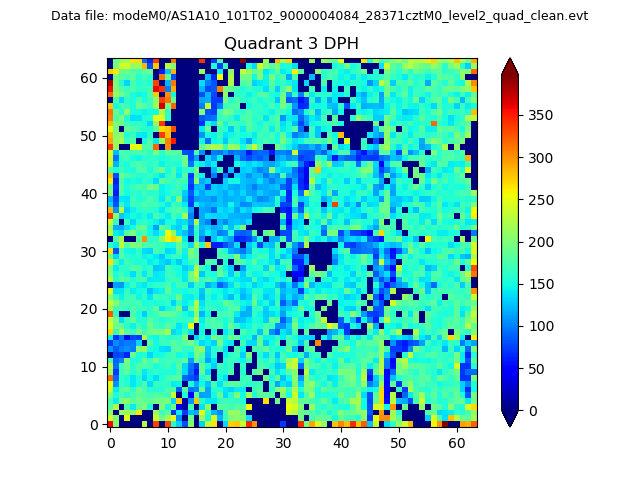 |
 |
Quadrant C |
| Plot type | Count rate plots | Images |
|---|---|---|
| Comparison with Poisson distribution Blue bars denote a histogram of data divided into 1 sec bins. Red curve is a Poisson curve with rate = median count rate of data. |
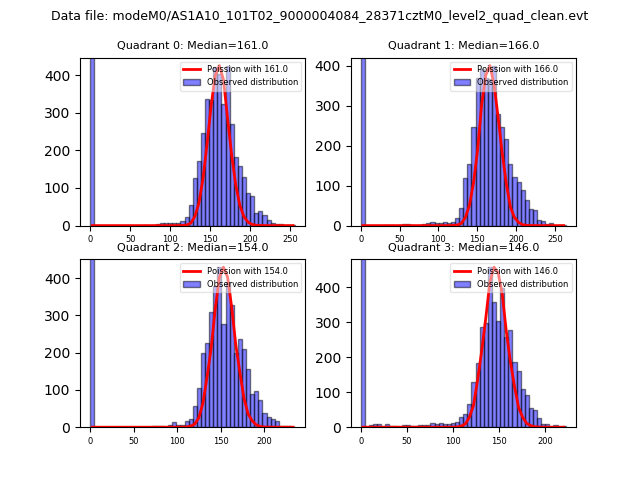 |
 |
| Quadrant-wise count rates Data is divided into 100 sec bins |
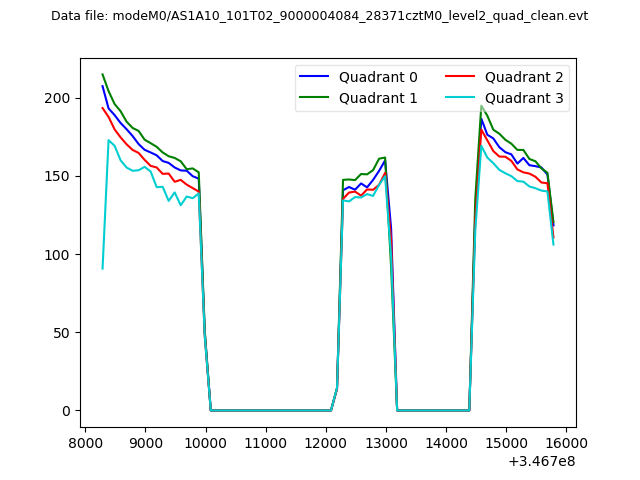 |
|
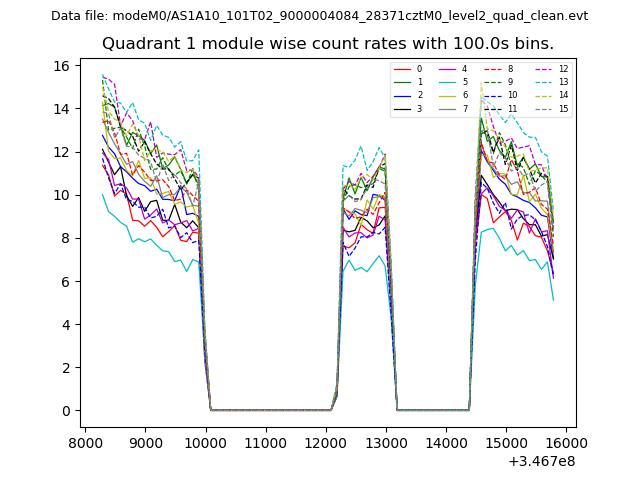
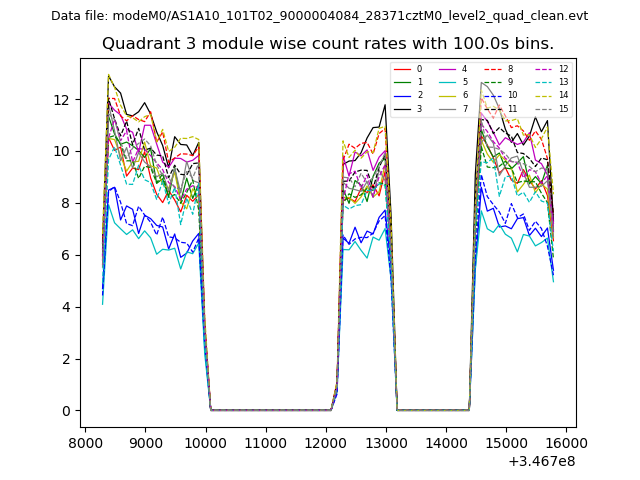
| Module-wise count rates for Quadrant A Data is divided into 100 sec bins |
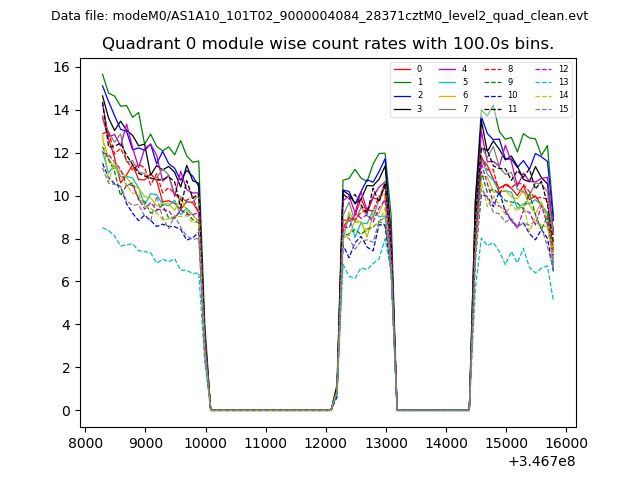 |
 |
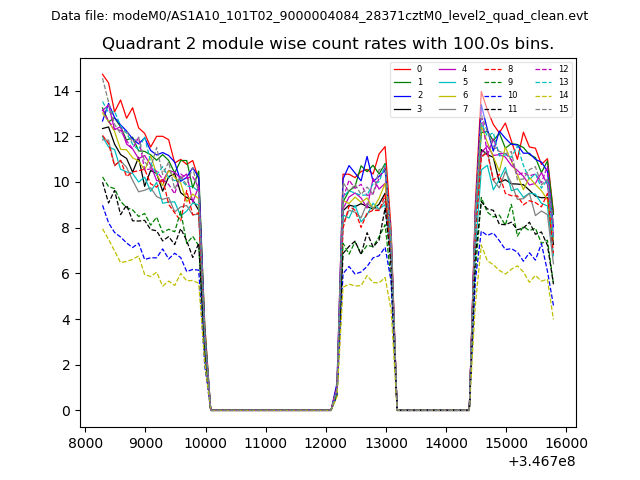
| Module-wise count rates for Quadrant B Data is divided into 100 sec bins |
 |
 |
| Module-wise count rates for Quadrant C Data is divided into 100 sec bins |
 |
 |
| Module-wise count rates for Quadrant D Data is divided into 100 sec bins |
 |
 |
| Parameter | Plot |
|---|---|
| CZT HV Monitor | 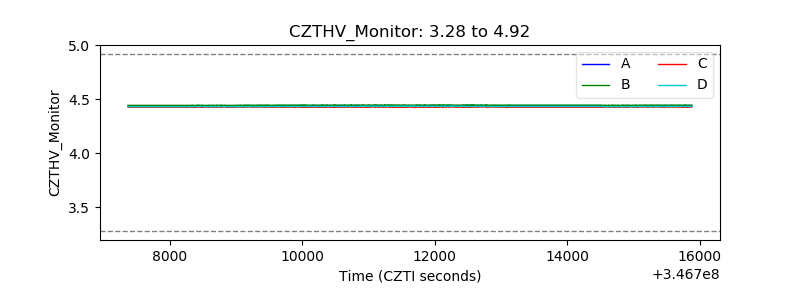 |
| D_VDD | 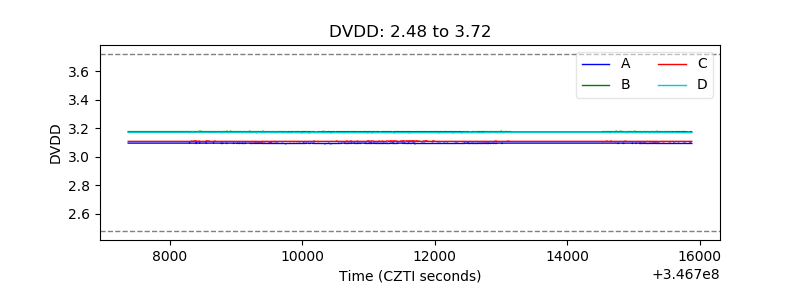 |
| Temperature 1 | 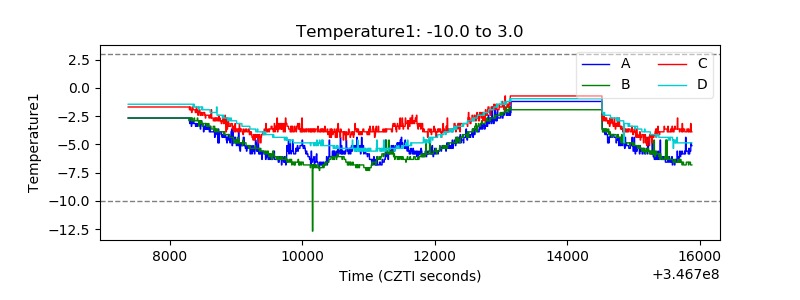 |
| Veto HV Monitor | 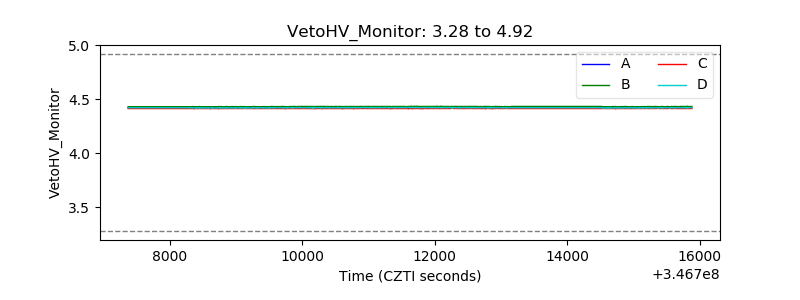 |
| Veto LLD | 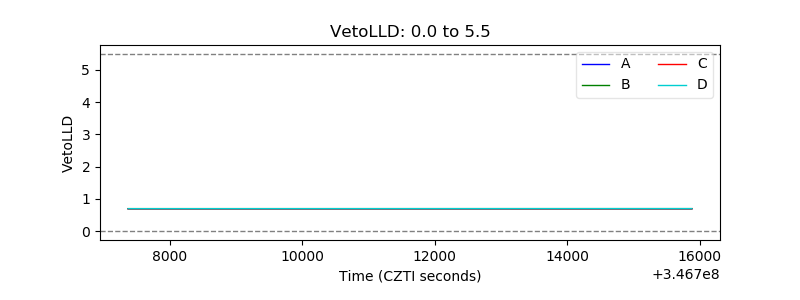 |
| Alpha Counter | 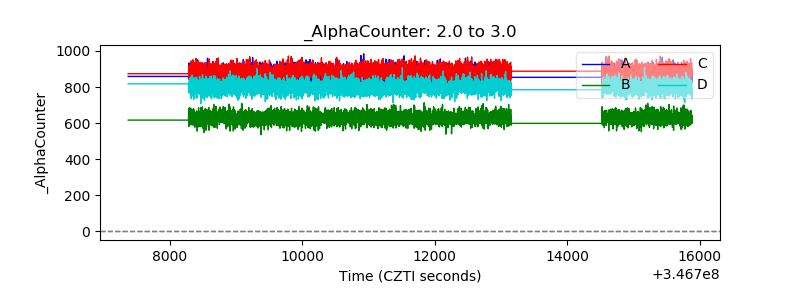 |
| _CPM_Rate |  |
| CZT Counter | 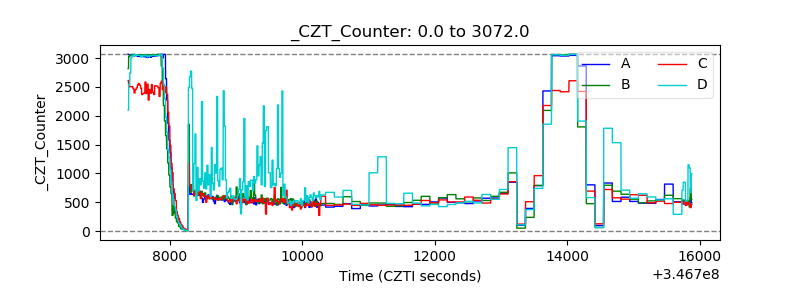 |
| +2.5 Volts monitor |  |
| +5 Volts monitor |  |
| _ROLL_ROT | 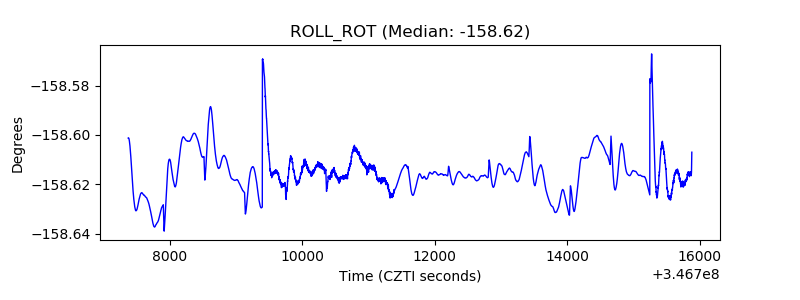 |
| _Roll_DEC | 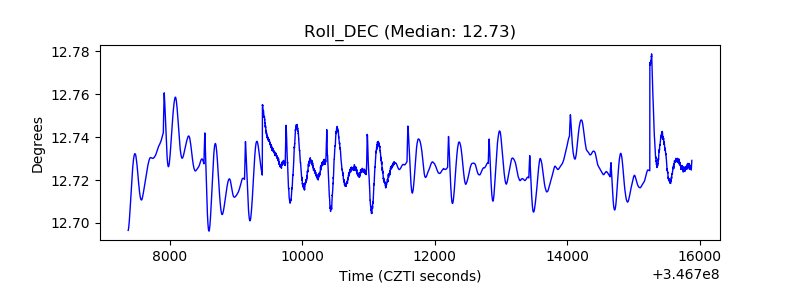 |
| _Roll_RA | 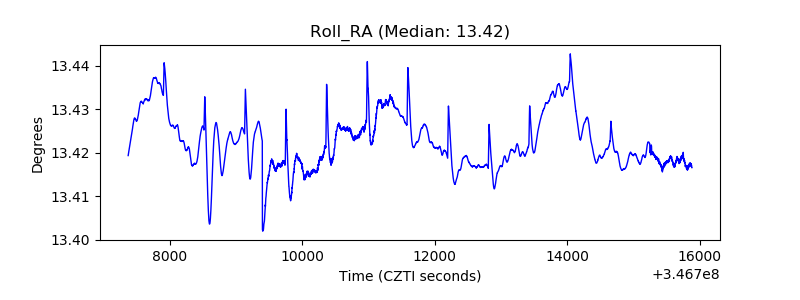 |
| Veto Counter | 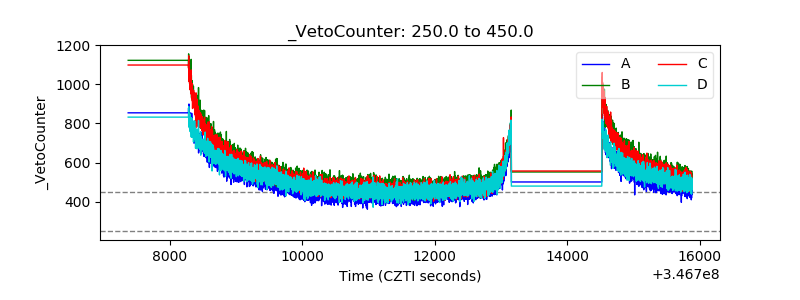 |