| Param | Original file | Final file |
|---|---|---|
| Filename | modeM0/AS1A10_101T02_9000004084_28372cztM0_level2.evt | modeM0/AS1A10_101T02_9000004084_28372cztM0_level2_quad_clean.evt |
| Size (bytes) | 461,563,200 | 86,788,800 |
| Size | 440.2 MB | 82.8 MB |
| Events in quadrant A | 3,129,048 | 559,498 |
| Events in quadrant B | 3,395,527 | 580,341 |
| Events in quadrant C | 3,188,349 | 540,493 |
| Events in quadrant D | 3,846,574 | 517,162 |
| Mode M0 | |||
|---|---|---|---|
| Quadrant | BADHDUFLAG | Total packets | Discarded packets |
| A | 0 | 12946 | 0 |
| B | 0 | 13692 | 0 |
| C | 0 | 12998 | 0 |
| D | 0 | 15443 | 0 |
| Mode M9 | |||
|---|---|---|---|
| Quadrant | BADHDUFLAG | Total packets | Discarded packets |
| A | 0 | 19 | 0 |
| B | 0 | 20 | 0 |
| C | 0 | 20 | 0 |
| D | 0 | 20 | 0 |
| Quadrant | Total seconds | Saturated seconds | Saturation percentage |
|---|---|---|---|
| A | 6170 | 28 | 0.453809% |
| B | 6169 | 53 | 0.859134% |
| C | 6169 | 84 | 1.361647% |
| D | 6169 | 110 | 1.783109% |
Noise dominated data is calculated using 1-second bins in cleaned event files. If a bin has >2000 counts, and if more than 50% of those come from <1% of pixels, then it is considered to be noise-dominated and hence unusable.
| Quadrant | # 1 sec bins | Bins with >0 counts | Bins with >2000 counts | High rate bins dominated by noise | Noise dominated (total time) | Noise dominated (detector-on time) | Marked lightcurve |
|---|---|---|---|---|---|---|---|
| A | 7475 | 6171 | 0 | 0 | 0.00% | 0.00% | 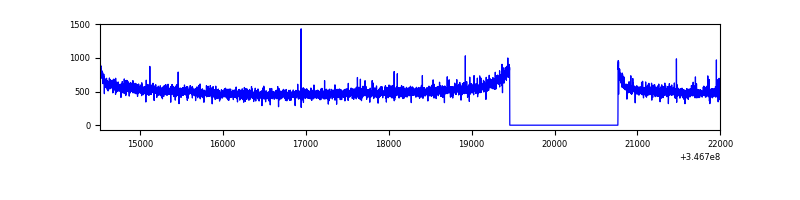 |
| B | 7474 | 6170 | 5 | 5 | 0.07% | 0.08% | 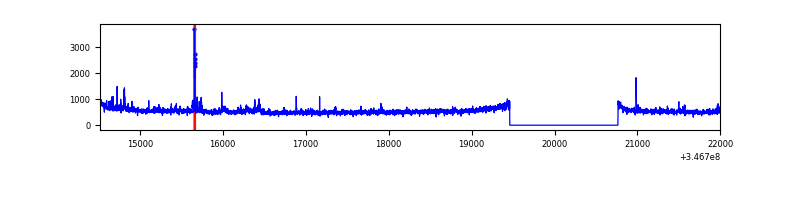 |
| C | 7474 | 6170 | 0 | 0 | 0.00% | 0.00% | 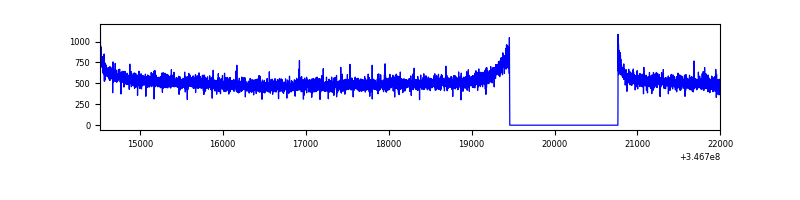 |
| D | 7474 | 6170 | 68 | 68 | 0.91% | 1.10% | 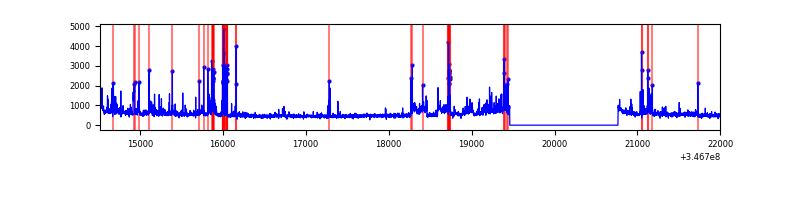 |
Top three noisy pixels from each quadrant. If the there are fewer than three noisy pixels in the level2.evt file, extra rows are filled as -1
| Pixel properties | Quadrant properties | ||||||
|---|---|---|---|---|---|---|---|
| Quadrant | DetID | PixID | Counts | Sigma | Mean | Median | Sigma |
| A | 13 | 254 | 10772 | 61.61 | 809 | 795 | 161.9 |
| A | 15 | 47 | 8130 | 45.3 | 809 | 795 | 161.9 |
| A | 3 | 137 | 7579 | 41.9 | 809 | 795 | 161.9 |
| B | 10 | 245 | 155084 | 1005.57 | 816 | 799 | 153.4 |
| B | 0 | 230 | 19748 | 123.5 | 816 | 799 | 153.4 |
| B | 12 | 111 | 18734 | 116.89 | 816 | 799 | 153.4 |
| C | 14 | 238 | 126417 | 689.15 | 781 | 790 | 182.3 |
| C | 3 | 233 | 9989 | 50.46 | 781 | 790 | 182.3 |
| C | 13 | 61 | 5277 | 24.61 | 781 | 790 | 182.3 |
| D | 8 | 195 | 281129 | 1517.29 | 776 | 756 | 184.8 |
| D | 1 | 52 | 246073 | 1327.57 | 776 | 756 | 184.8 |
| D | 7 | 238 | 157053 | 845.83 | 776 | 756 | 184.8 |
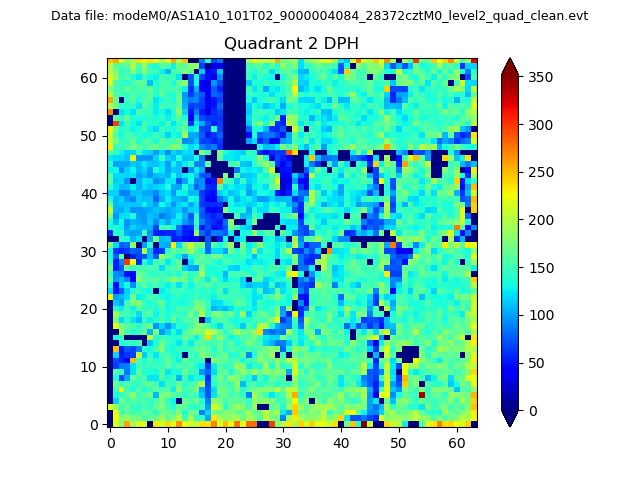
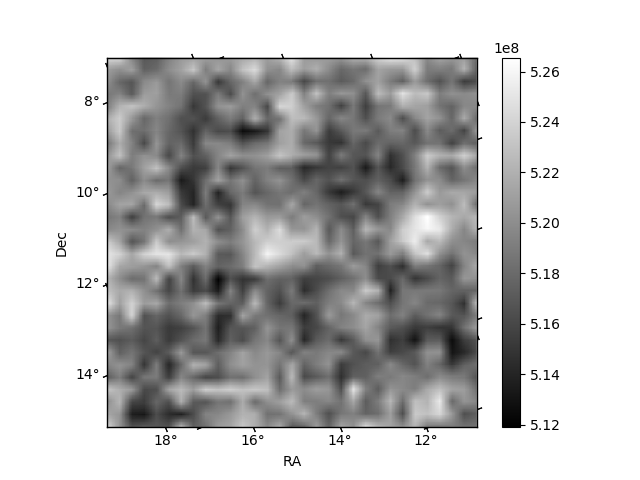
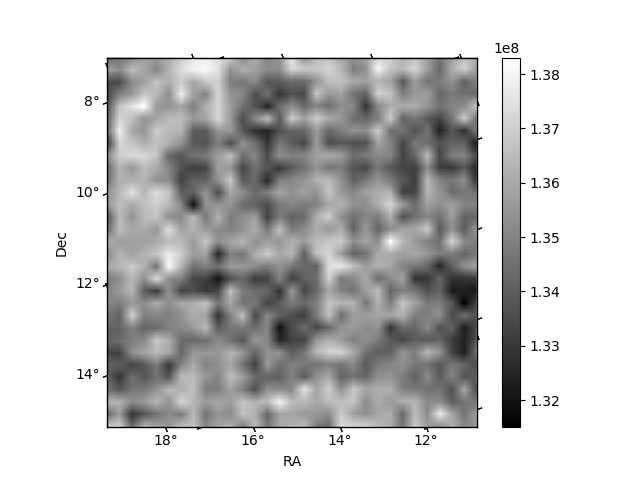
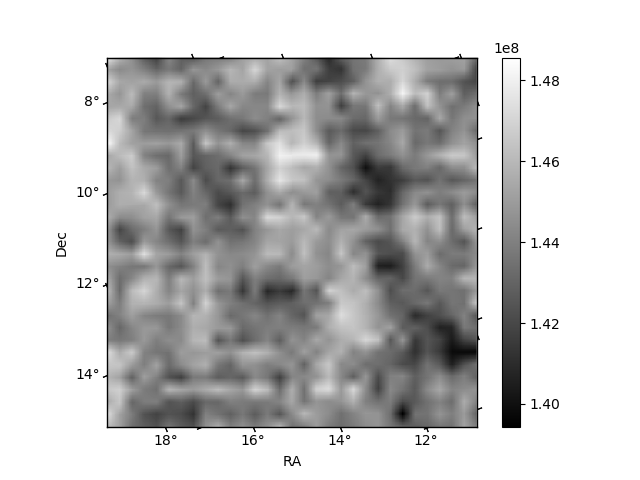
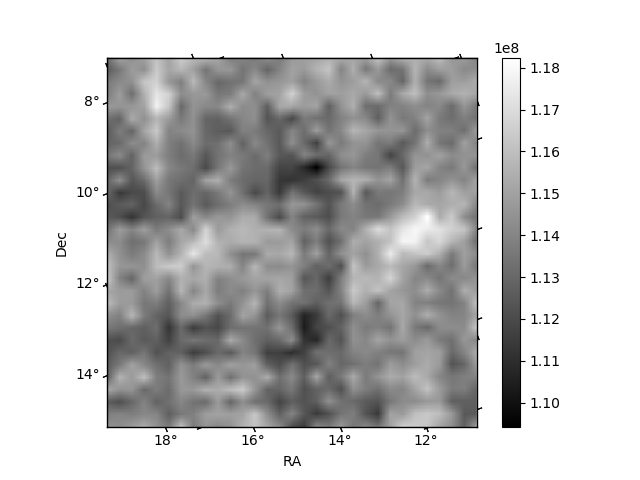
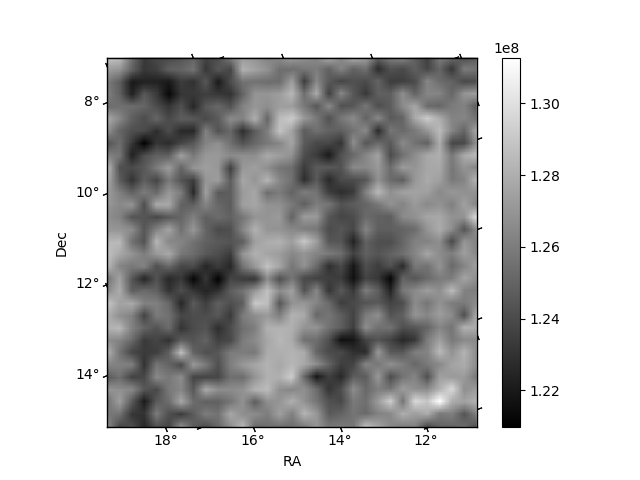
Histogram calculated using DETX and DETY for each event in the final _common_clean file
| Quadrant A | 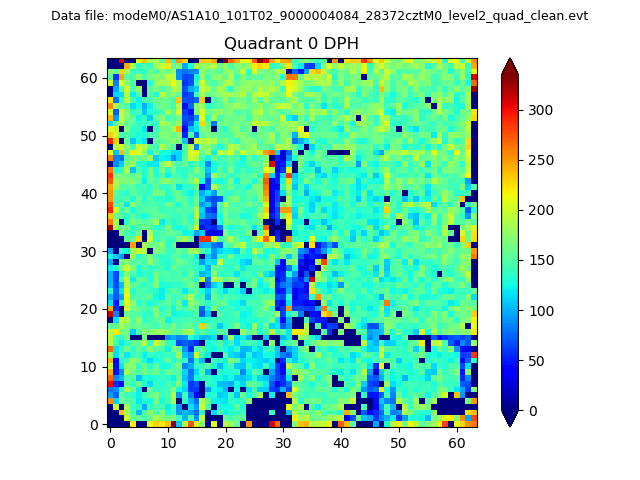 |
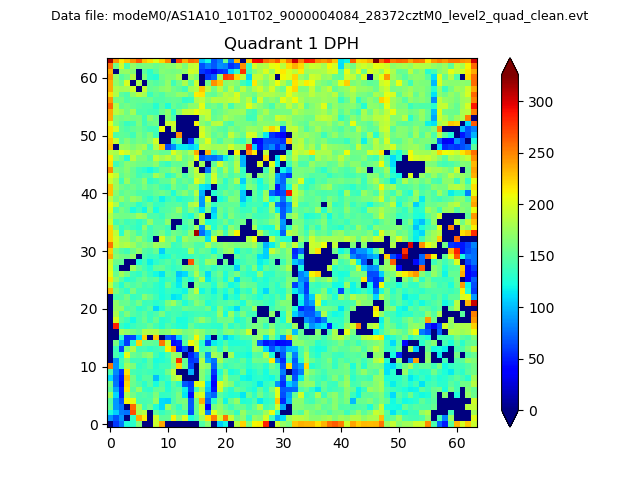 |
Quadrant B |
|---|---|---|---|
| Quadrant D | 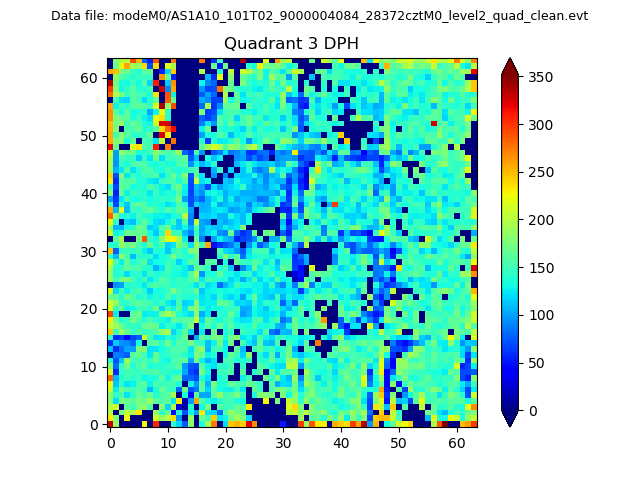 |
 |
Quadrant C |
| Plot type | Count rate plots | Images |
|---|---|---|
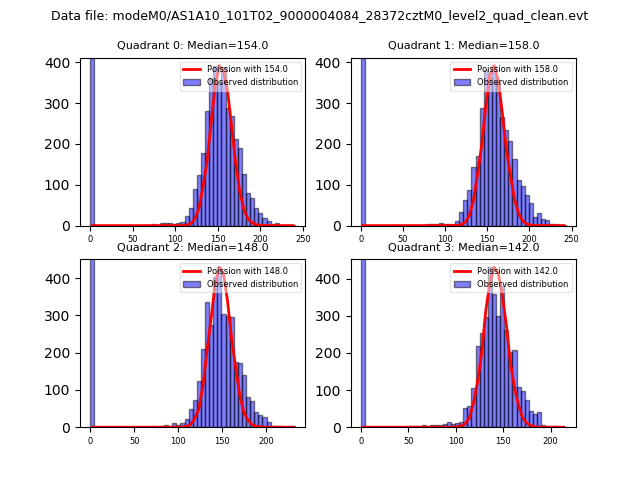
| Comparison with Poisson distribution Blue bars denote a histogram of data divided into 1 sec bins. Red curve is a Poisson curve with rate = median count rate of data. |
 |
 |
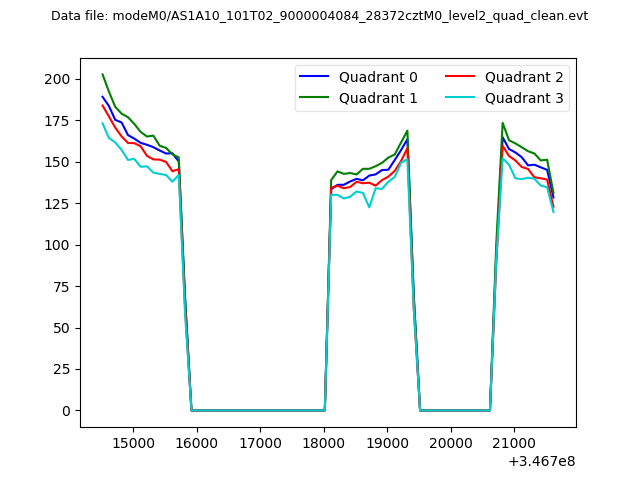
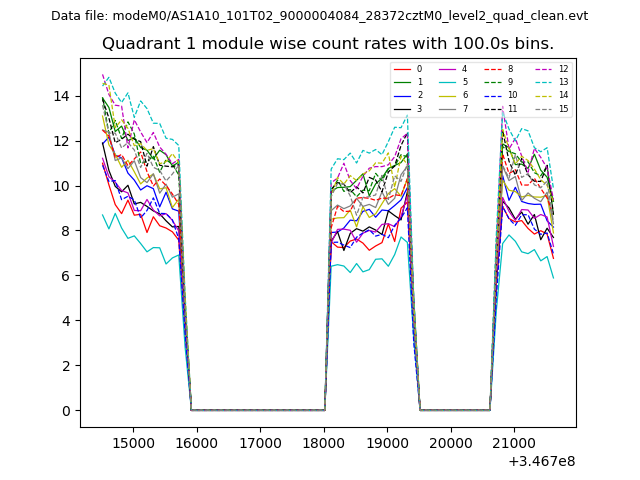
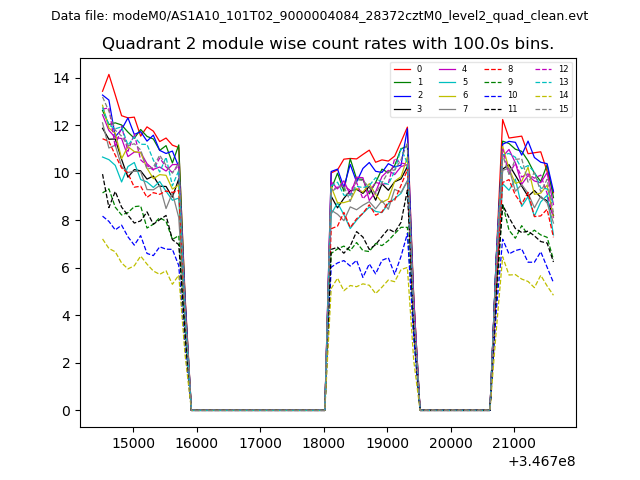
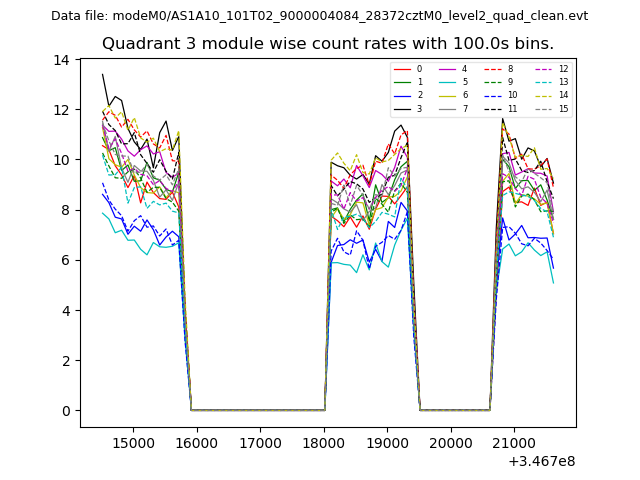
| Quadrant-wise count rates Data is divided into 100 sec bins |
 |
|
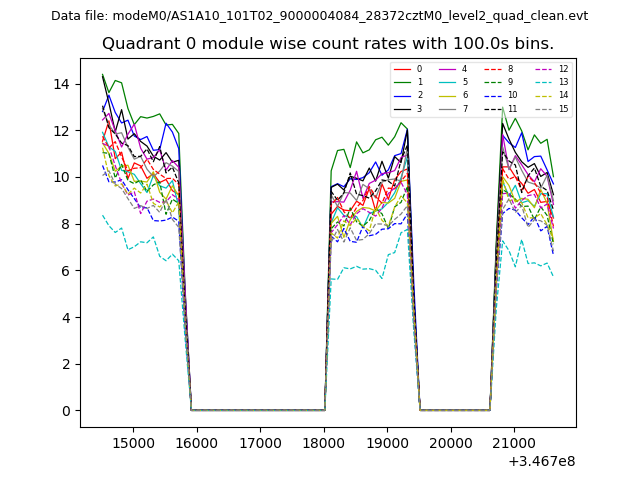
| Module-wise count rates for Quadrant A Data is divided into 100 sec bins |
 |
 |
| Module-wise count rates for Quadrant B Data is divided into 100 sec bins |
 |
 |
| Module-wise count rates for Quadrant C Data is divided into 100 sec bins |
 |
 |
| Module-wise count rates for Quadrant D Data is divided into 100 sec bins |
 |
 |
| Parameter | Plot |
|---|---|
| CZT HV Monitor | 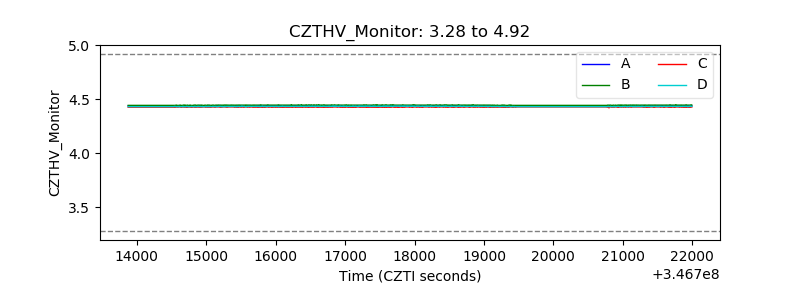 |
| D_VDD | 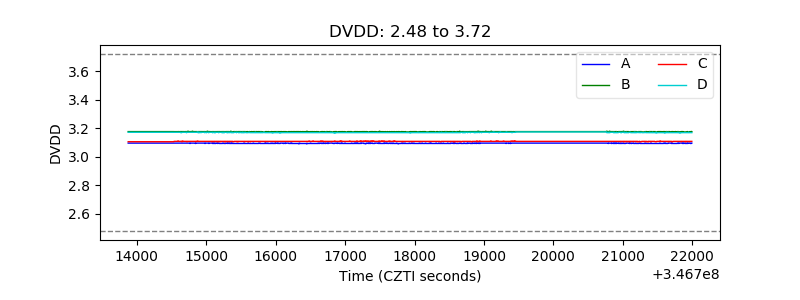 |
| Temperature 1 | 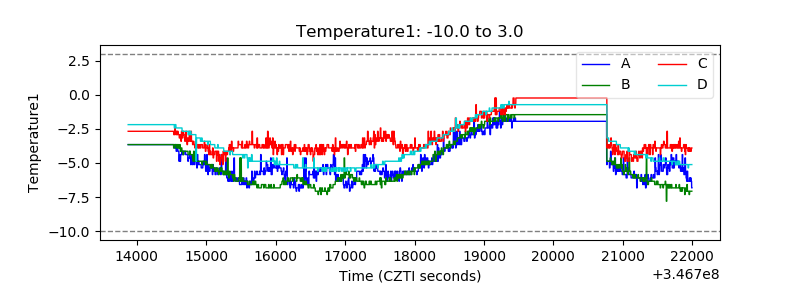 |
| Veto HV Monitor | 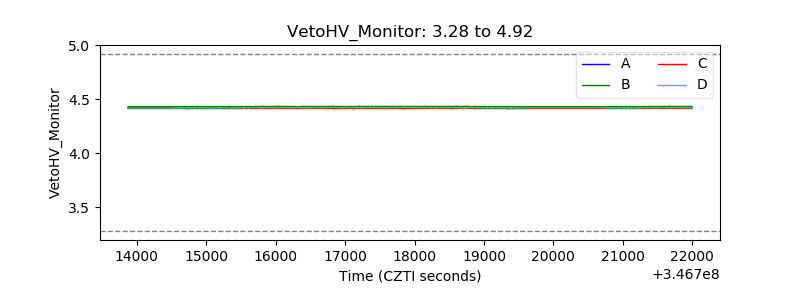 |
| Veto LLD | 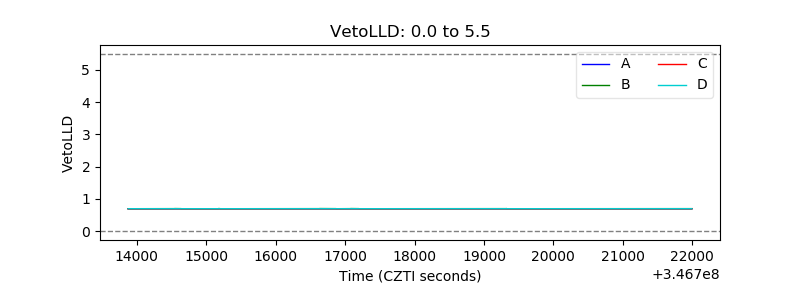 |
| Alpha Counter | 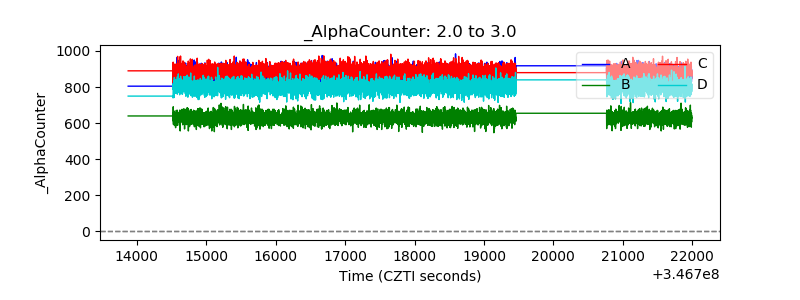 |
| _CPM_Rate | 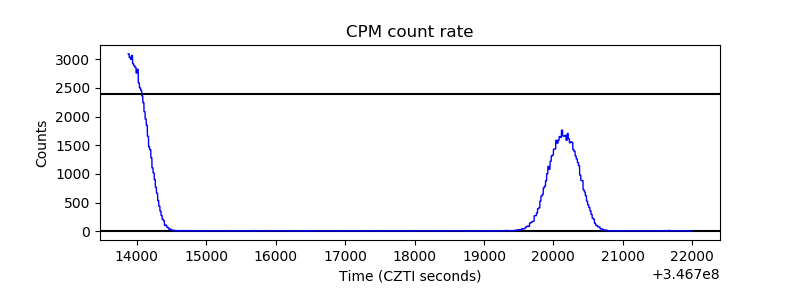 |
| CZT Counter | 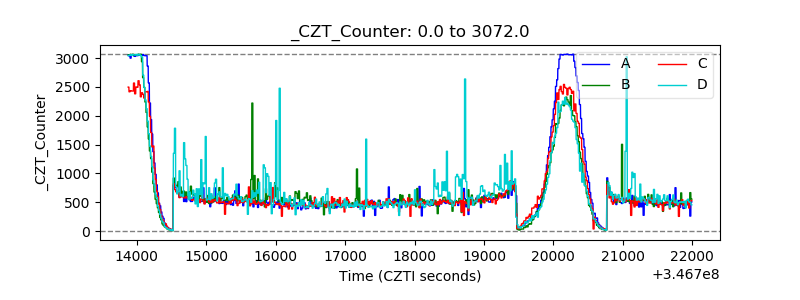 |
| +2.5 Volts monitor |  |
| +5 Volts monitor | 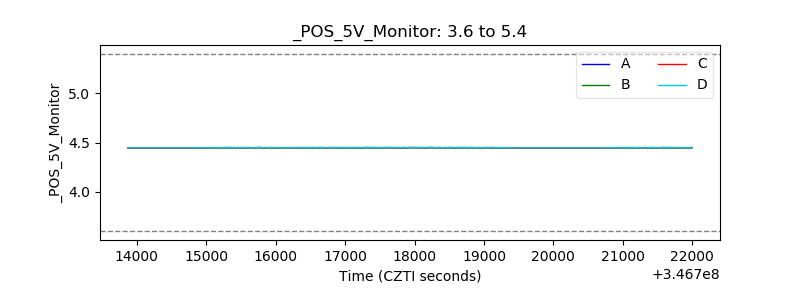 |
| _ROLL_ROT | 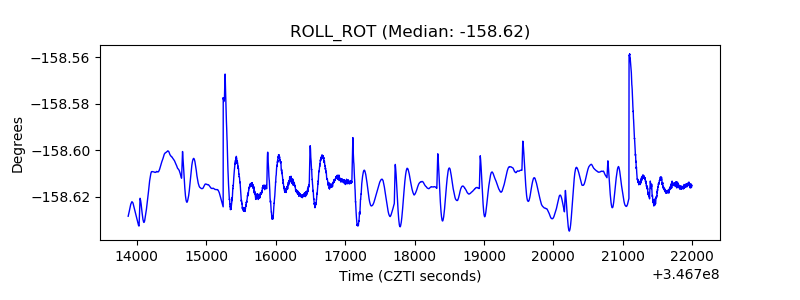 |
| _Roll_DEC | 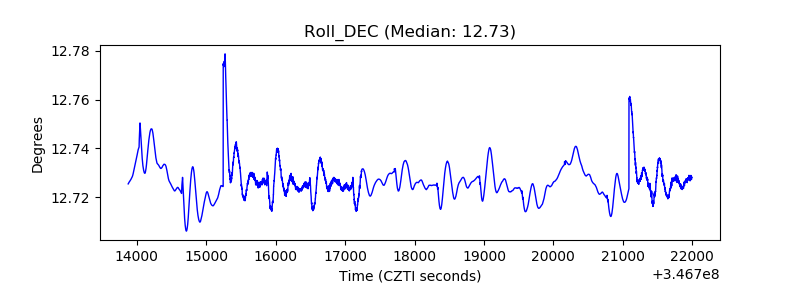 |
| _Roll_RA | 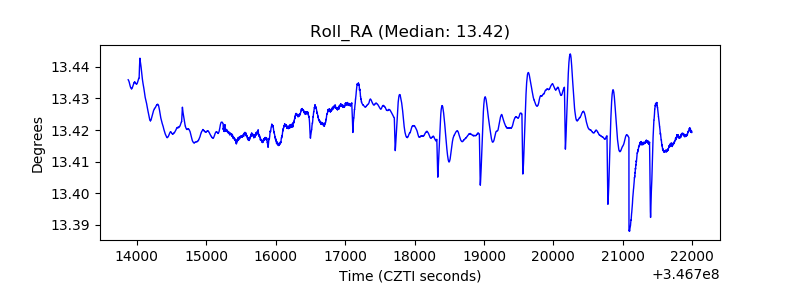 |
| Veto Counter | 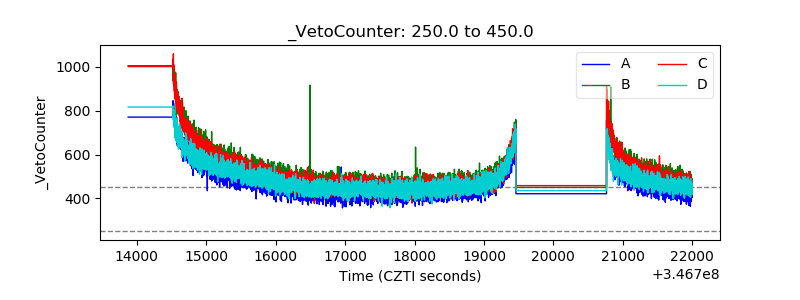 |