| Param | Original file | Final file |
|---|---|---|
| Filename | modeM0/AS1A10_101T02_9000004084_28373cztM0_level2.evt | modeM0/AS1A10_101T02_9000004084_28373cztM0_level2_quad_clean.evt |
| Size (bytes) | 509,993,280 | 84,620,160 |
| Size | 486.4 MB | 80.7 MB |
| Events in quadrant A | 3,477,871 | 527,980 |
| Events in quadrant B | 3,727,830 | 543,960 |
| Events in quadrant C | 3,536,149 | 509,551 |
| Events in quadrant D | 4,229,336 | 494,493 |
| Mode M0 | |||
|---|---|---|---|
| Quadrant | BADHDUFLAG | Total packets | Discarded packets |
| A | 0 | 14631 | 0 |
| B | 0 | 15235 | 0 |
| C | 0 | 14665 | 0 |
| D | 0 | 17063 | 0 |
| Mode M9 | |||
|---|---|---|---|
| Quadrant | BADHDUFLAG | Total packets | Discarded packets |
| A | 0 | 24 | 0 |
| B | 0 | 24 | 0 |
| C | 0 | 24 | 0 |
| D | 0 | 24 | 0 |
| Quadrant | Total seconds | Saturated seconds | Saturation percentage |
|---|---|---|---|
| A | 6990 | 54 | 0.772532% |
| B | 6990 | 99 | 1.416309% |
| C | 6991 | 131 | 1.873838% |
| D | 6990 | 118 | 1.688126% |
Noise dominated data is calculated using 1-second bins in cleaned event files. If a bin has >2000 counts, and if more than 50% of those come from <1% of pixels, then it is considered to be noise-dominated and hence unusable.
| Quadrant | # 1 sec bins | Bins with >0 counts | Bins with >2000 counts | High rate bins dominated by noise | Noise dominated (total time) | Noise dominated (detector-on time) | Marked lightcurve |
|---|---|---|---|---|---|---|---|
| A | 9325 | 6992 | 0 | 0 | 0.00% | 0.00% | 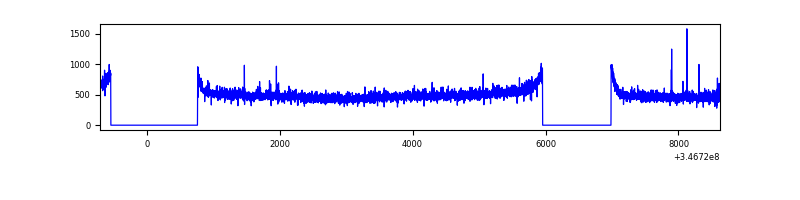 |
| B | 9325 | 6992 | 9 | 9 | 0.10% | 0.13% | 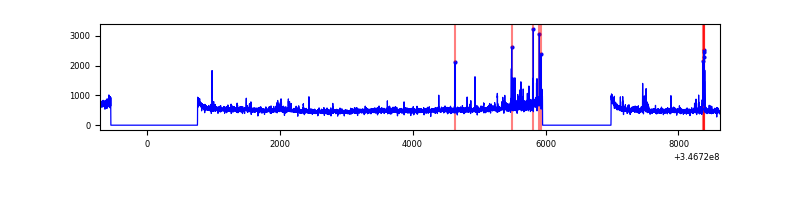 |
| C | 9326 | 6993 | 1 | 1 | 0.01% | 0.01% | 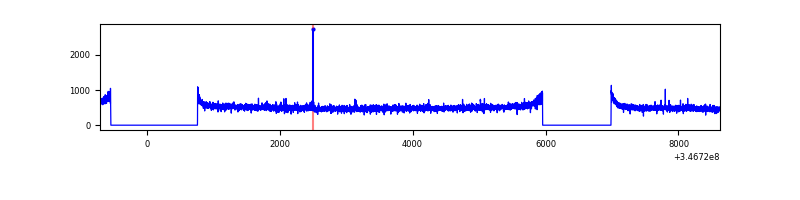 |
| D | 9325 | 6992 | 45 | 45 | 0.48% | 0.64% | 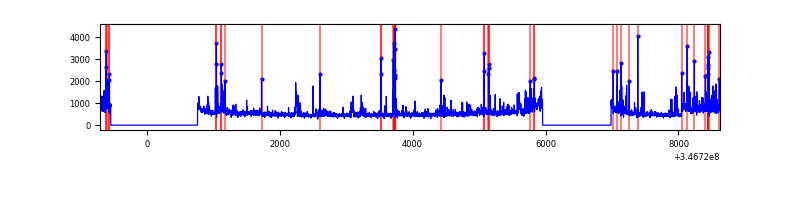 |
Top three noisy pixels from each quadrant. If the there are fewer than three noisy pixels in the level2.evt file, extra rows are filled as -1
| Pixel properties | Quadrant properties | ||||||
|---|---|---|---|---|---|---|---|
| Quadrant | DetID | PixID | Counts | Sigma | Mean | Median | Sigma |
| A | 15 | 47 | 33501 | 181.79 | 891 | 875 | 179.5 |
| A | 13 | 254 | 11676 | 60.18 | 891 | 875 | 179.5 |
| A | 3 | 137 | 8552 | 42.77 | 891 | 875 | 179.5 |
| B | 10 | 245 | 127676 | 736.52 | 898 | 877 | 172.2 |
| B | 10 | 246 | 41331 | 234.98 | 898 | 877 | 172.2 |
| B | 12 | 111 | 21565 | 120.17 | 898 | 877 | 172.2 |
| C | 14 | 238 | 140232 | 686.19 | 864 | 869 | 203.1 |
| C | 7 | 220 | 15111 | 70.12 | 864 | 869 | 203.1 |
| C | 3 | 233 | 12987 | 59.67 | 864 | 869 | 203.1 |
| D | 8 | 195 | 396181 | 1909.09 | 861 | 838 | 207.1 |
| D | 1 | 52 | 304489 | 1466.31 | 861 | 838 | 207.1 |
| D | 2 | 250 | 101172 | 484.51 | 861 | 838 | 207.1 |
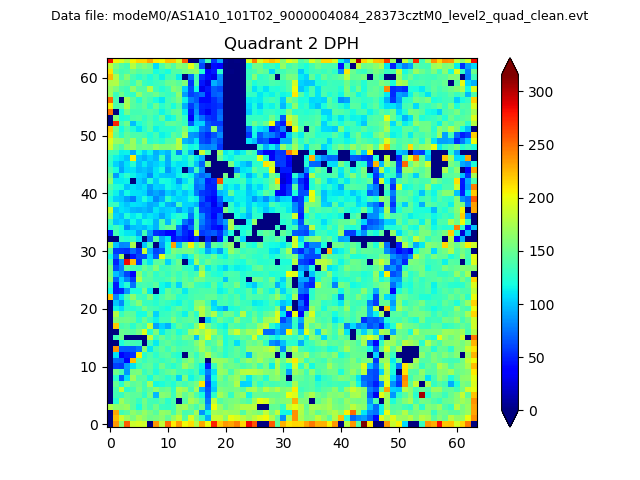
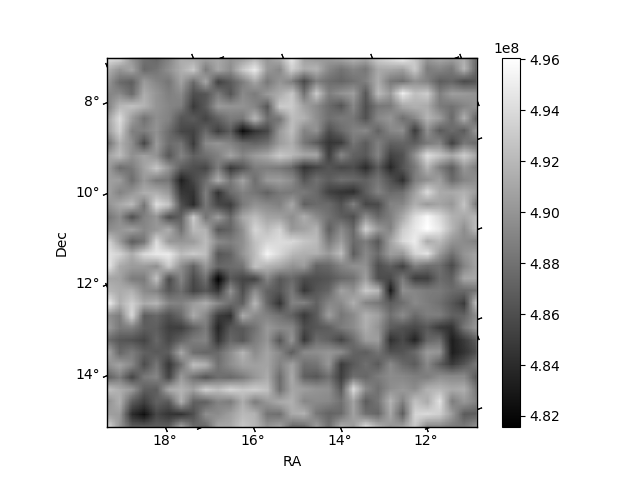
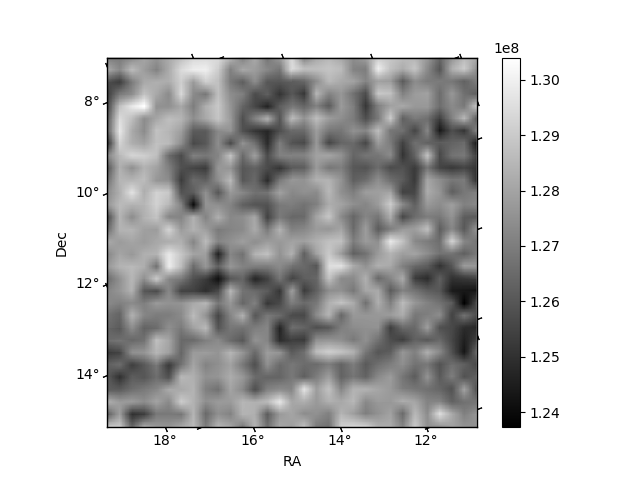
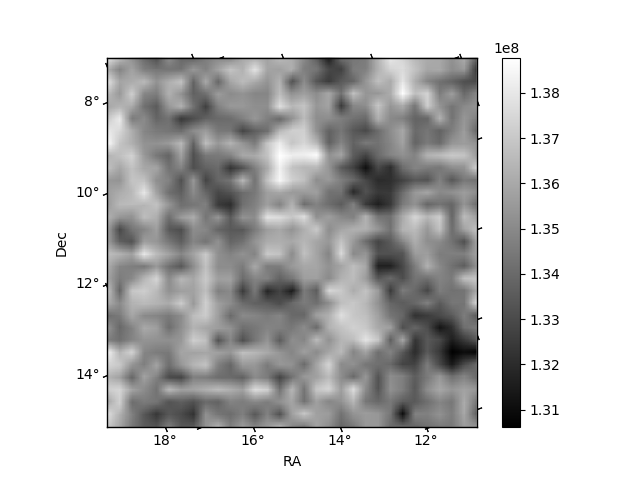
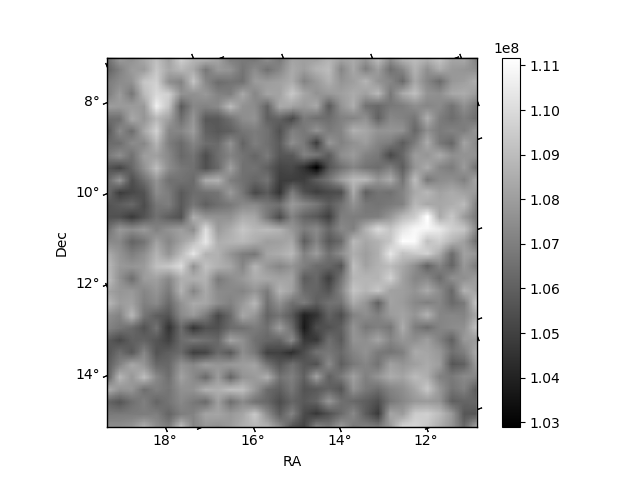
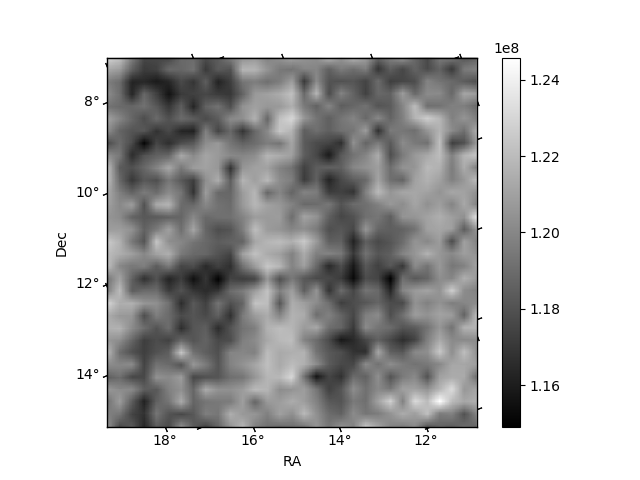
Histogram calculated using DETX and DETY for each event in the final _common_clean file
| Quadrant A | 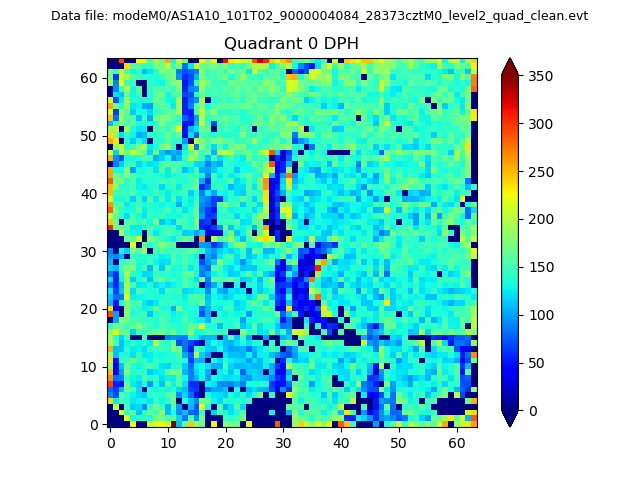 |
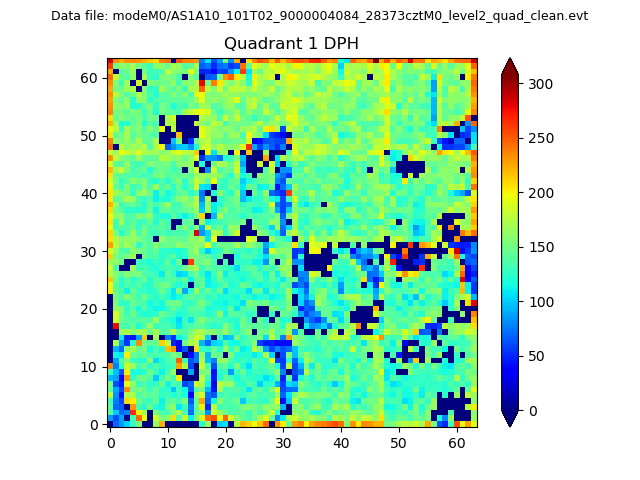 |
Quadrant B |
|---|---|---|---|
| Quadrant D | 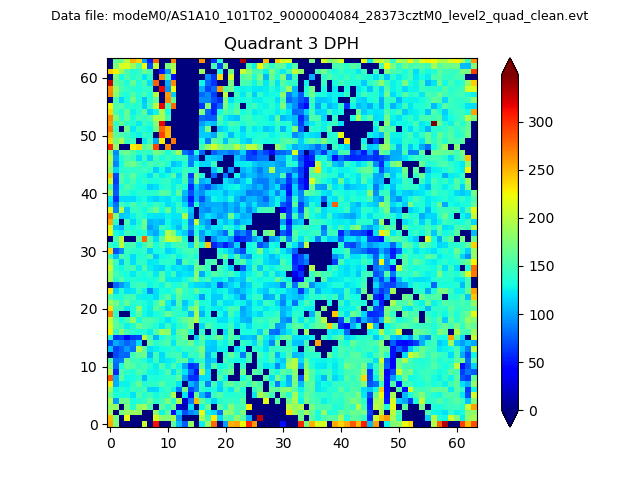 |
 |
Quadrant C |
| Plot type | Count rate plots | Images |
|---|---|---|
| Comparison with Poisson distribution Blue bars denote a histogram of data divided into 1 sec bins. Red curve is a Poisson curve with rate = median count rate of data. |
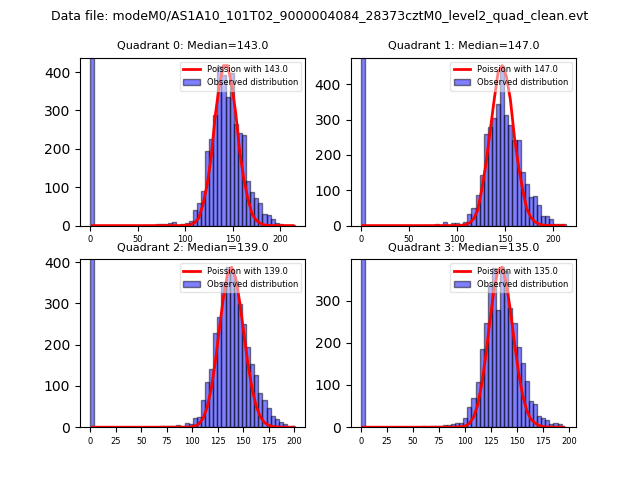 |
 |
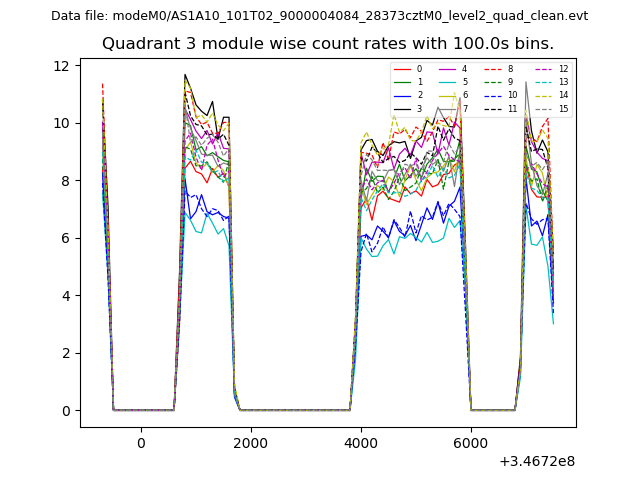
| Quadrant-wise count rates Data is divided into 100 sec bins |
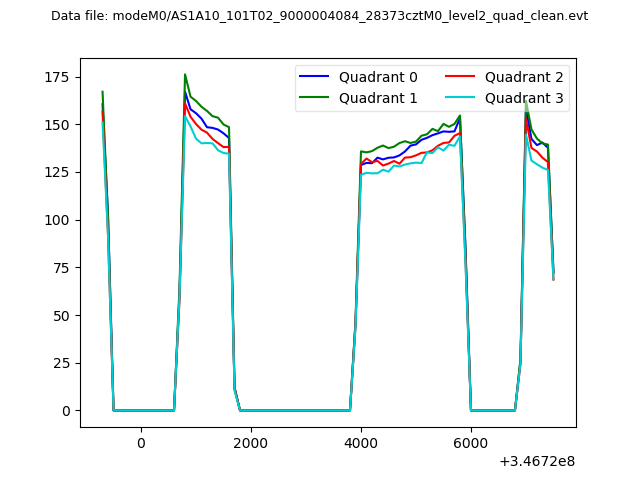 |
|
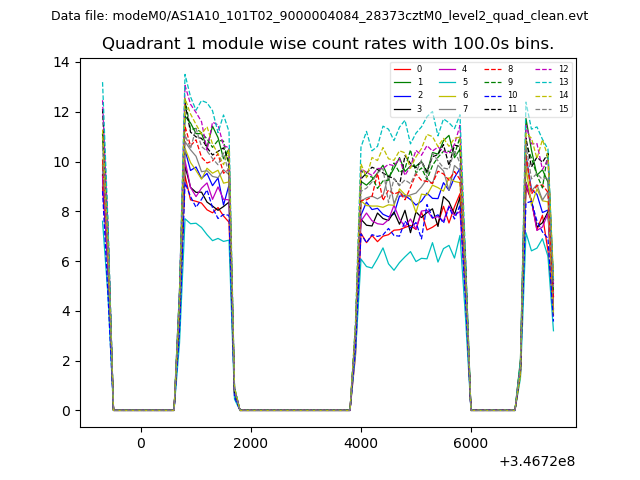
| Module-wise count rates for Quadrant A Data is divided into 100 sec bins |
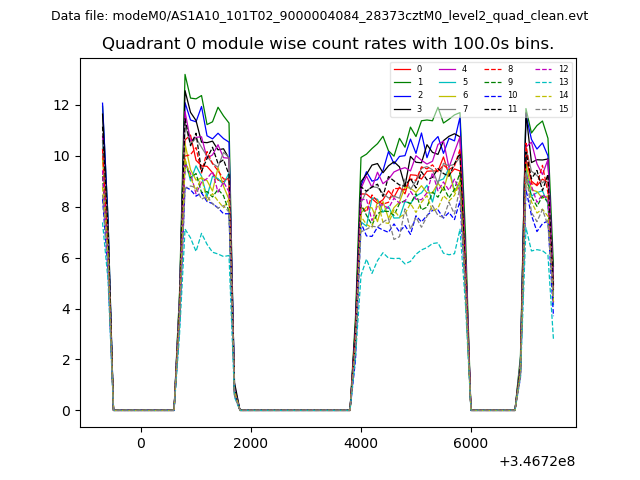 |
 |
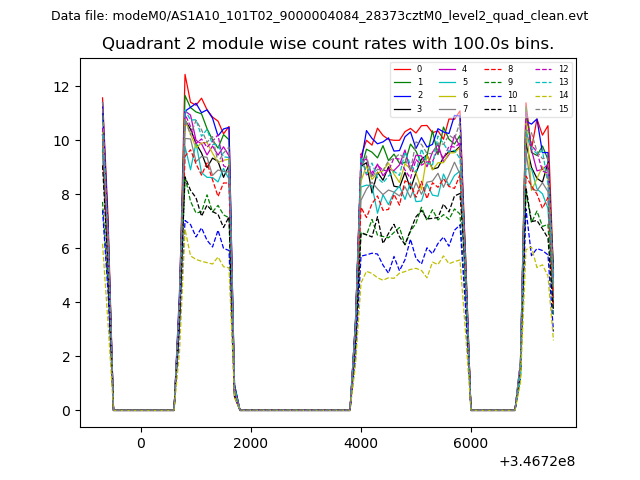
| Module-wise count rates for Quadrant B Data is divided into 100 sec bins |
 |
 |
| Module-wise count rates for Quadrant C Data is divided into 100 sec bins |
 |
 |
| Module-wise count rates for Quadrant D Data is divided into 100 sec bins |
 |
 |
| Parameter | Plot |
|---|---|
| CZT HV Monitor | 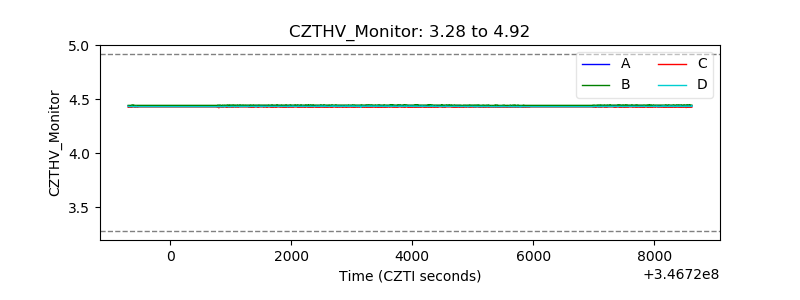 |
| D_VDD | 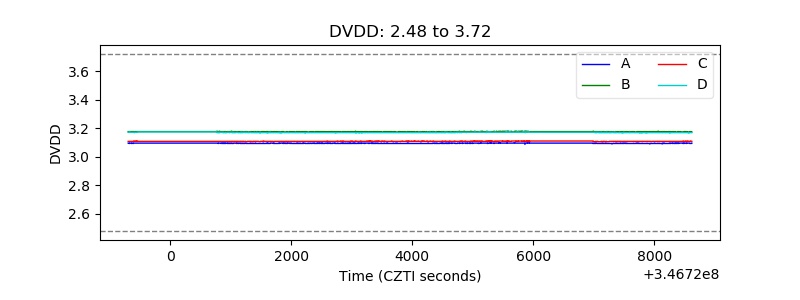 |
| Temperature 1 | 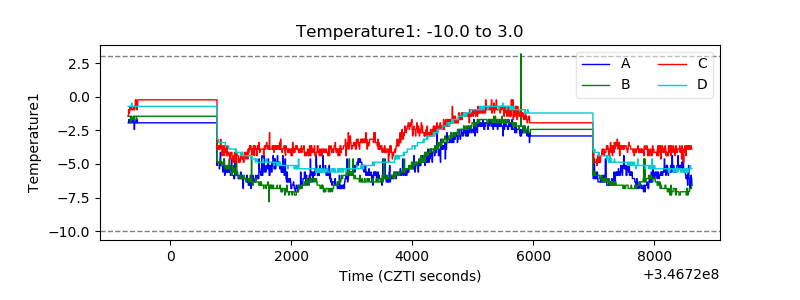 |
| Veto HV Monitor | 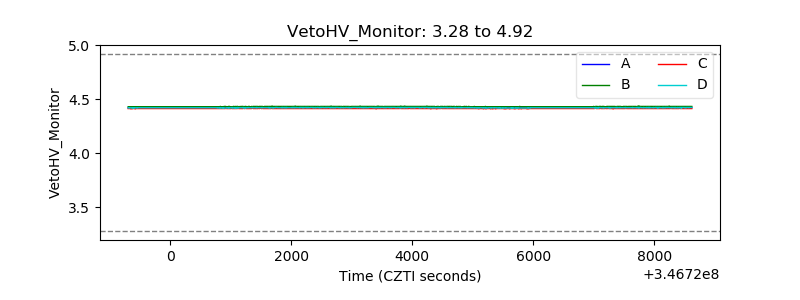 |
| Veto LLD | 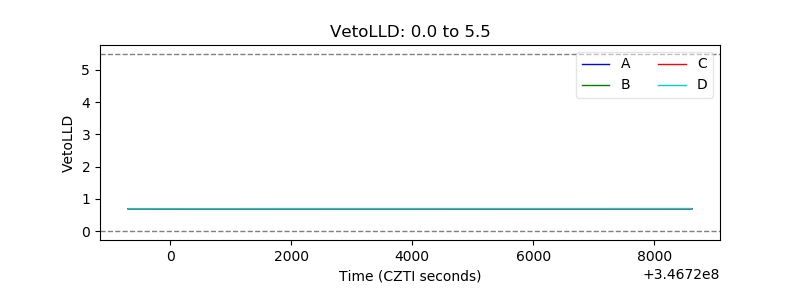 |
| Alpha Counter | 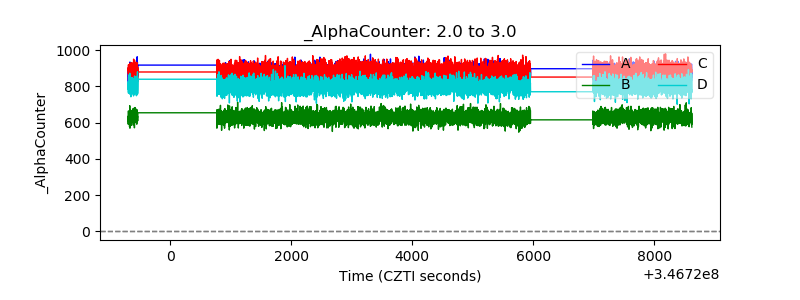 |
| _CPM_Rate | 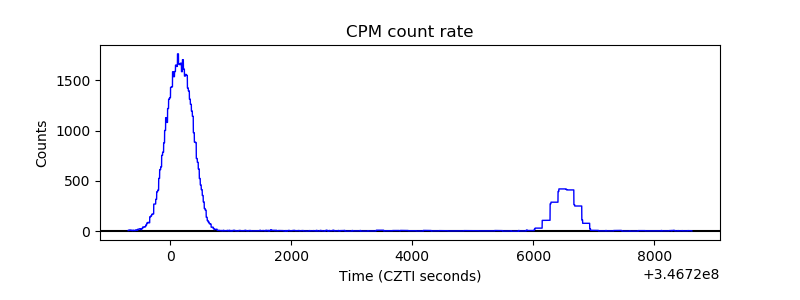 |
| CZT Counter |  |
| +2.5 Volts monitor |  |
| +5 Volts monitor | 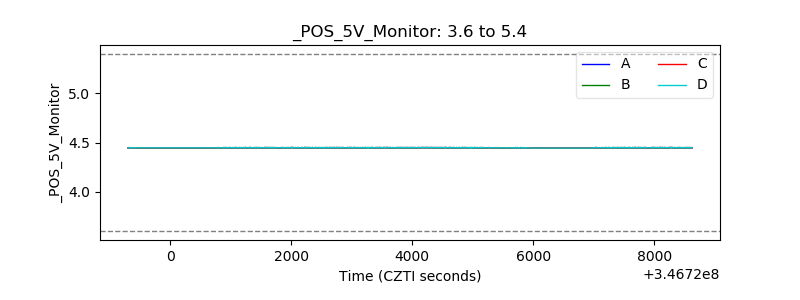 |
| _ROLL_ROT | 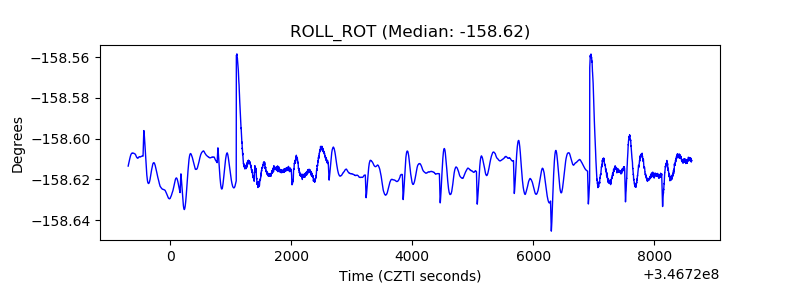 |
| _Roll_DEC | 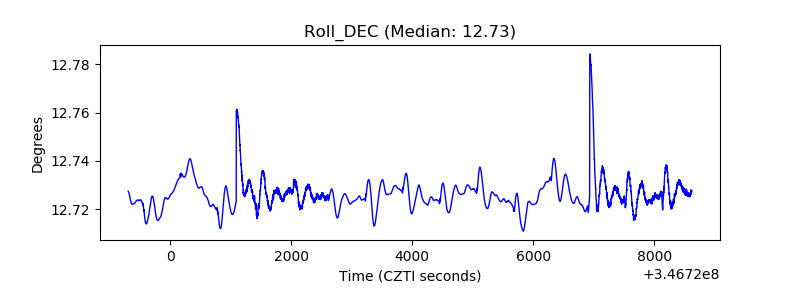 |
| _Roll_RA | 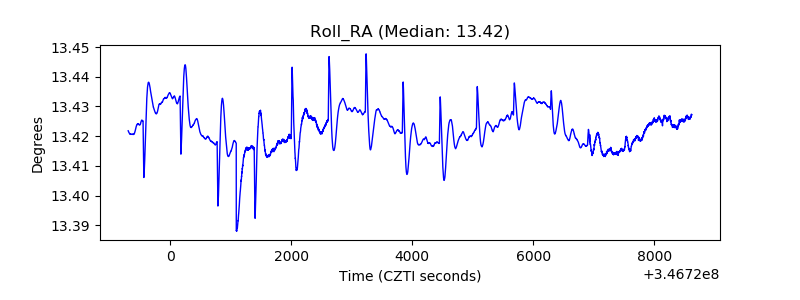 |
| Veto Counter | 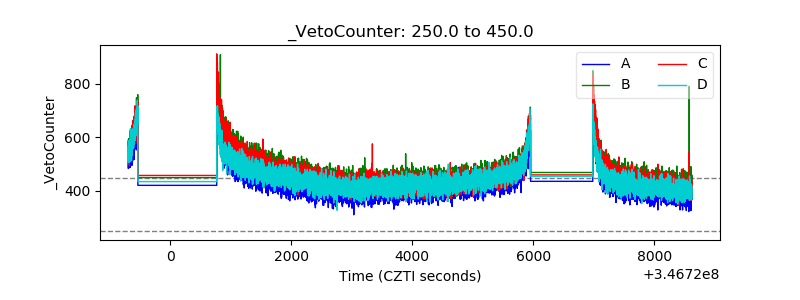 |