| Param | Original file | Final file |
|---|---|---|
| Filename | modeM0/AS1A10_101T02_9000004084_28374cztM0_level2.evt | modeM0/AS1A10_101T02_9000004084_28374cztM0_level2_quad_clean.evt |
| Size (bytes) | 536,391,360 | 79,416,000 |
| Size | 511.5 MB | 75.7 MB |
| Events in quadrant A | 3,557,863 | 483,113 |
| Events in quadrant B | 3,768,475 | 493,995 |
| Events in quadrant C | 3,529,840 | 468,157 |
| Events in quadrant D | 4,898,768 | 456,939 |
| Mode M0 | |||
|---|---|---|---|
| Quadrant | BADHDUFLAG | Total packets | Discarded packets |
| A | 0 | 15144 | 0 |
| B | 0 | 15581 | 0 |
| C | 0 | 14942 | 0 |
| D | 0 | 19420 | 0 |
| Mode M9 | |||
|---|---|---|---|
| Quadrant | BADHDUFLAG | Total packets | Discarded packets |
| A | 0 | 12 | 0 |
| B | 0 | 13 | 0 |
| C | 0 | 13 | 0 |
| D | 0 | 13 | 0 |
| Quadrant | Total seconds | Saturated seconds | Saturation percentage |
|---|---|---|---|
| A | 7219 | 105 | 1.454495% |
| B | 7219 | 115 | 1.593018% |
| C | 7219 | 113 | 1.565314% |
| D | 7219 | 123 | 1.703837% |
Noise dominated data is calculated using 1-second bins in cleaned event files. If a bin has >2000 counts, and if more than 50% of those come from <1% of pixels, then it is considered to be noise-dominated and hence unusable.
| Quadrant | # 1 sec bins | Bins with >0 counts | Bins with >2000 counts | High rate bins dominated by noise | Noise dominated (total time) | Noise dominated (detector-on time) | Marked lightcurve |
|---|---|---|---|---|---|---|---|
| A | 7804 | 7220 | 21 | 21 | 0.27% | 0.29% | 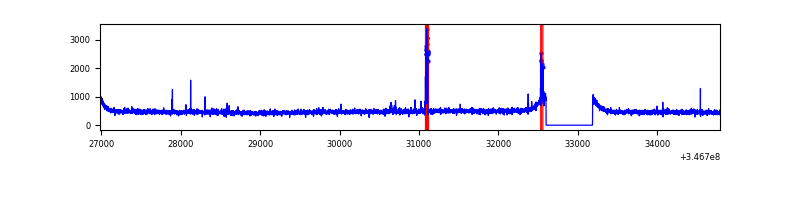 |
| B | 7804 | 7220 | 8 | 8 | 0.10% | 0.11% | 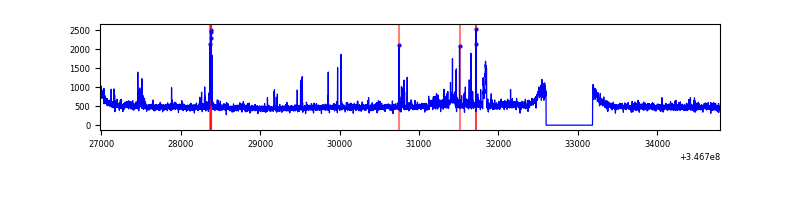 |
| C | 7804 | 7220 | 0 | 0 | 0.00% | 0.00% | 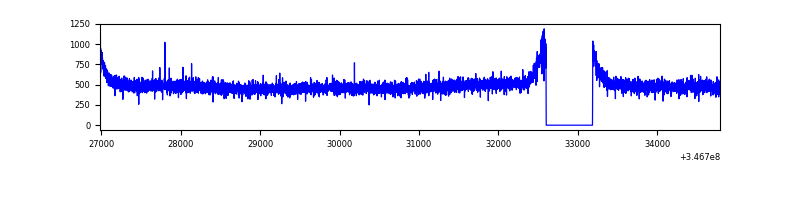 |
| D | 7804 | 7220 | 80 | 80 | 1.03% | 1.11% | 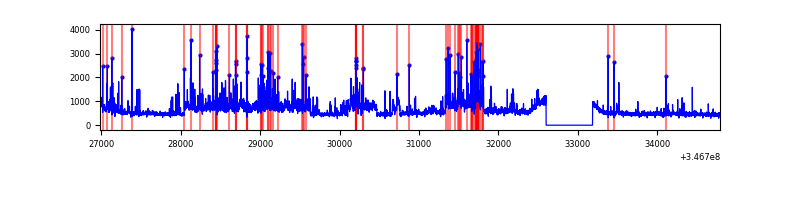 |
Top three noisy pixels from each quadrant. If the there are fewer than three noisy pixels in the level2.evt file, extra rows are filled as -1
| Pixel properties | Quadrant properties | ||||||
|---|---|---|---|---|---|---|---|
| Quadrant | DetID | PixID | Counts | Sigma | Mean | Median | Sigma |
| A | 15 | 174 | 64488 | 351.24 | 897 | 878 | 181.1 |
| A | 12 | 96 | 27175 | 145.21 | 897 | 878 | 181.1 |
| A | 13 | 254 | 11848 | 60.57 | 897 | 878 | 181.1 |
| B | 10 | 245 | 179946 | 1026.85 | 900 | 876 | 174.4 |
| B | 10 | 246 | 32827 | 183.22 | 900 | 876 | 174.4 |
| B | 12 | 111 | 21805 | 120.01 | 900 | 876 | 174.4 |
| C | 14 | 238 | 137231 | 663.45 | 868 | 872 | 205.5 |
| C | 7 | 220 | 6266 | 26.24 | 868 | 872 | 205.5 |
| C | 13 | 61 | 5847 | 24.21 | 868 | 872 | 205.5 |
| D | 8 | 195 | 1156847 | 5512.04 | 868 | 843 | 209.7 |
| D | 1 | 52 | 319981 | 1521.71 | 868 | 843 | 209.7 |
| D | 2 | 250 | 91537 | 432.45 | 868 | 843 | 209.7 |
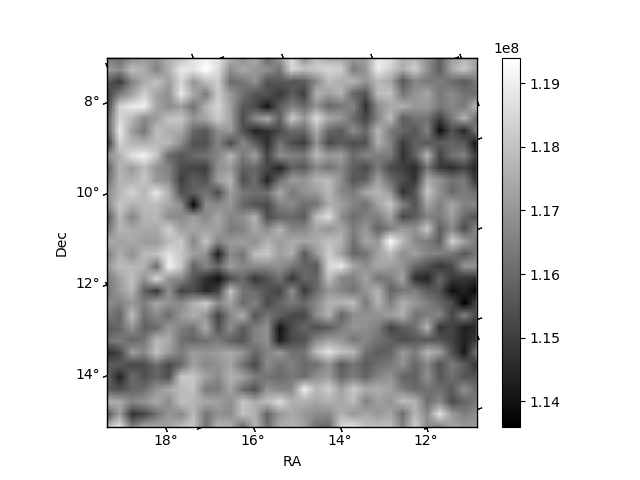
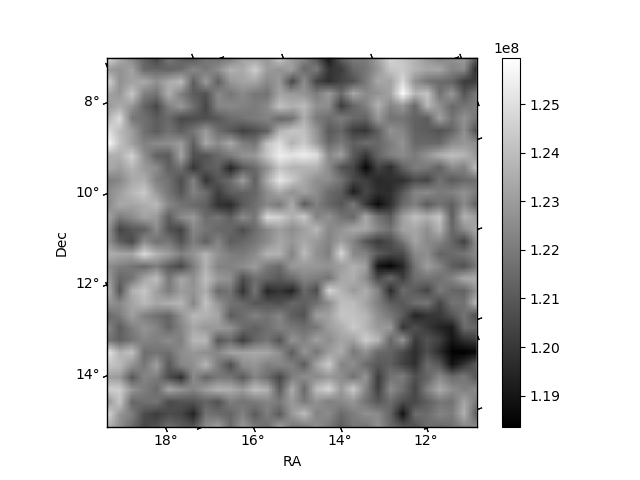
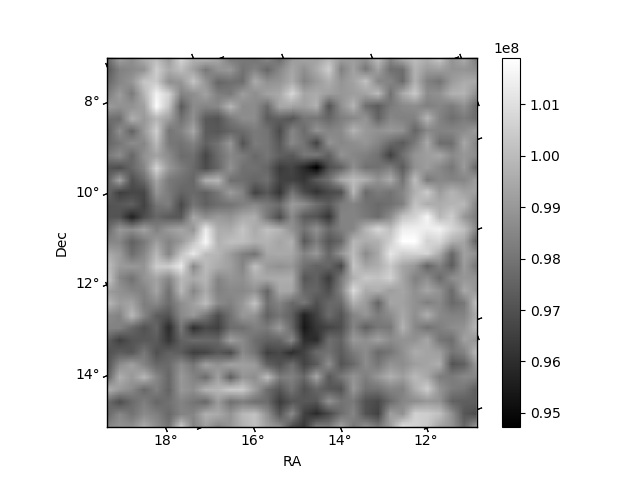
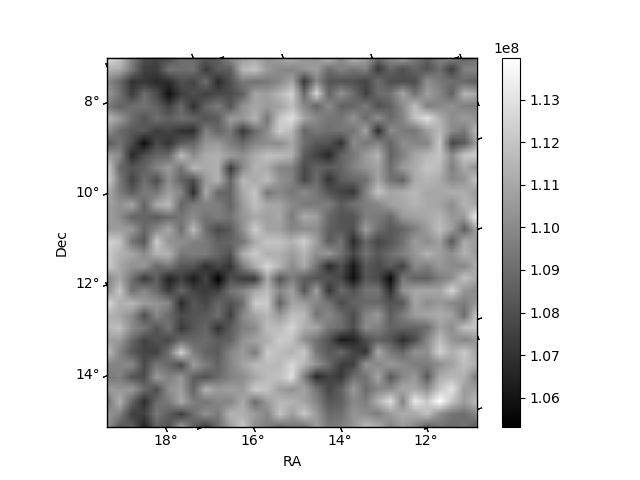
Histogram calculated using DETX and DETY for each event in the final _common_clean file
| Quadrant A | 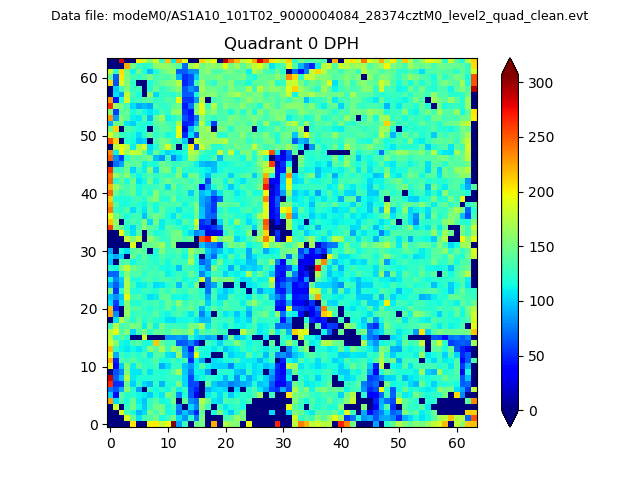 |
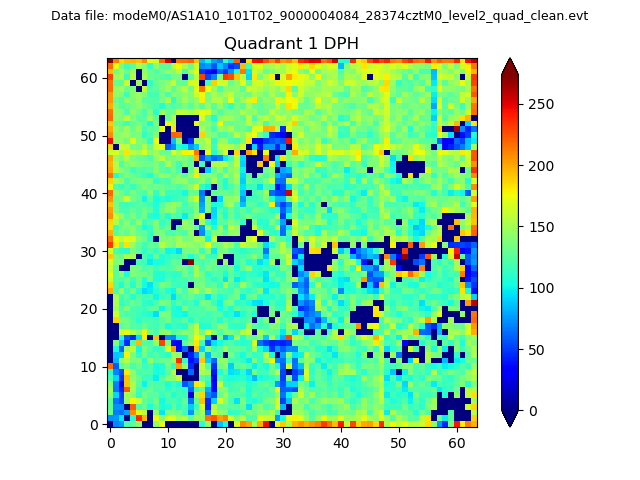 |
Quadrant B |
|---|---|---|---|
| Quadrant D | 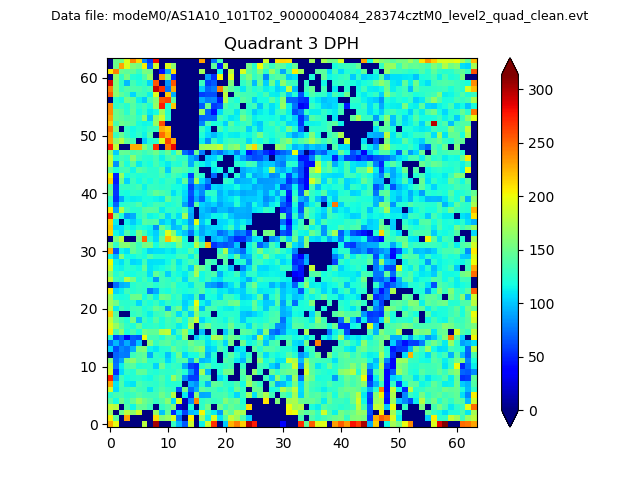 |
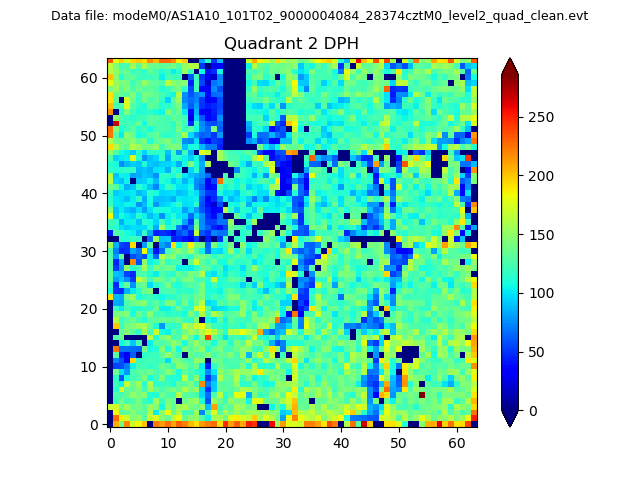 |
Quadrant C |
| Plot type | Count rate plots | Images |
|---|---|---|
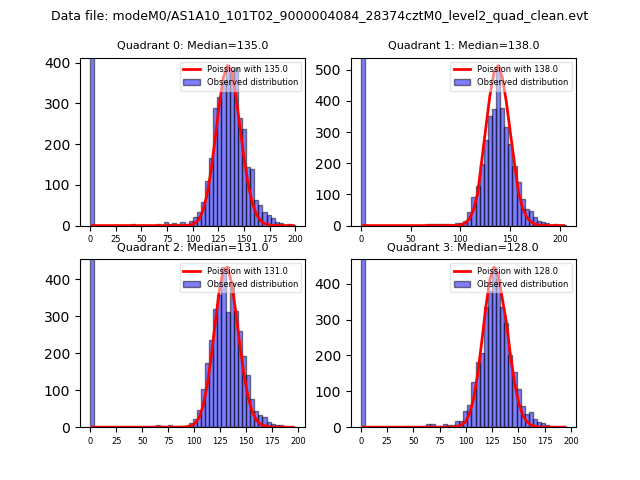
| Comparison with Poisson distribution Blue bars denote a histogram of data divided into 1 sec bins. Red curve is a Poisson curve with rate = median count rate of data. |
 |
 |
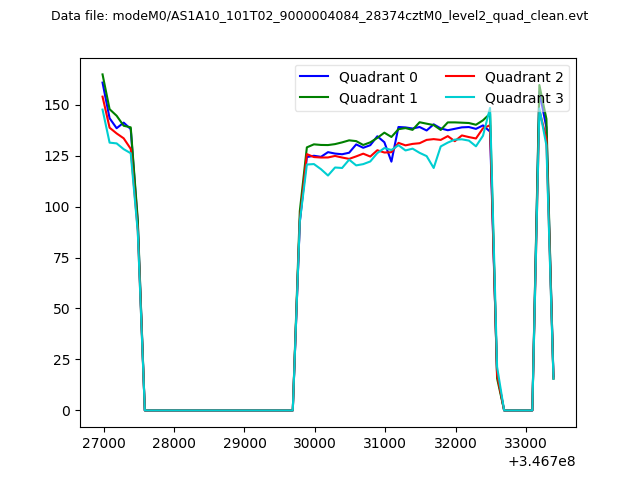
| Quadrant-wise count rates Data is divided into 100 sec bins |
 |
|
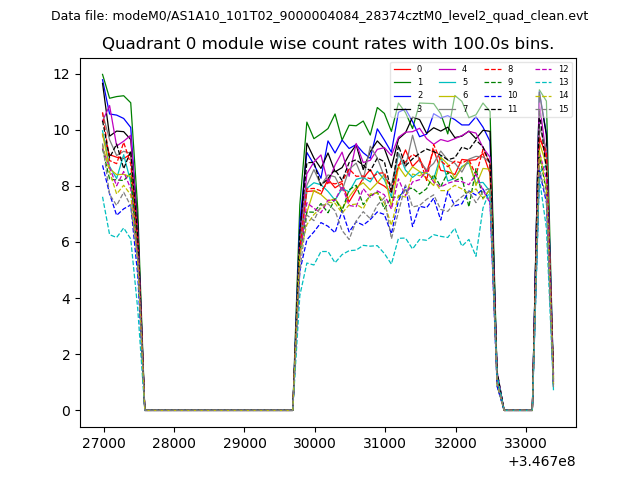
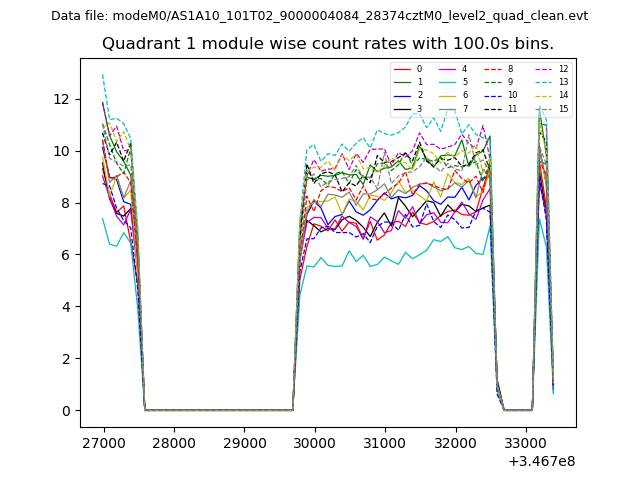
| Module-wise count rates for Quadrant A Data is divided into 100 sec bins |
 |
 |
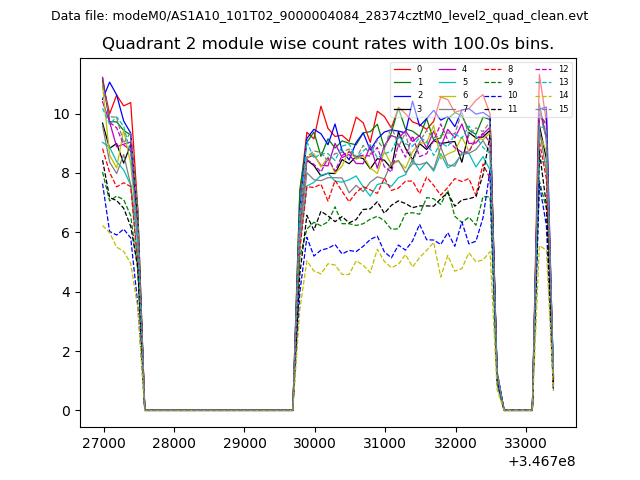
| Module-wise count rates for Quadrant B Data is divided into 100 sec bins |
 |
 |
| Module-wise count rates for Quadrant C Data is divided into 100 sec bins |
 |
 |
| Module-wise count rates for Quadrant D Data is divided into 100 sec bins |
 |
 |
| Parameter | Plot |
|---|---|
| CZT HV Monitor | 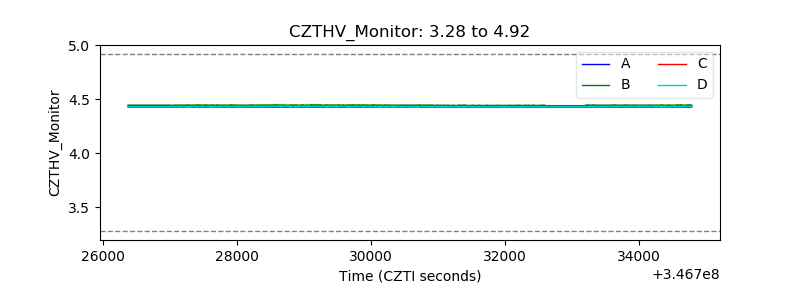 |
| D_VDD | 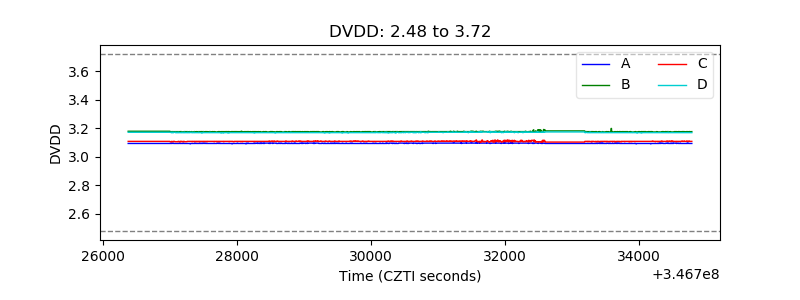 |
| Temperature 1 | 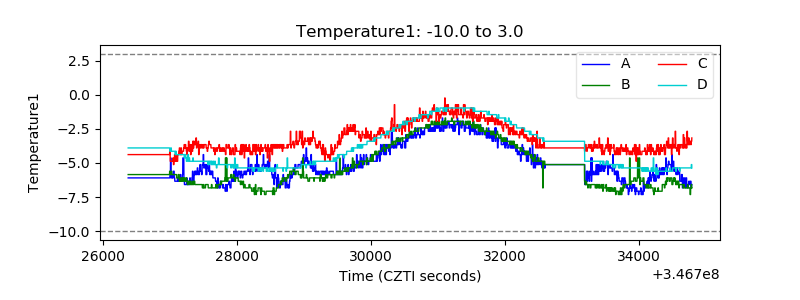 |
| Veto HV Monitor | 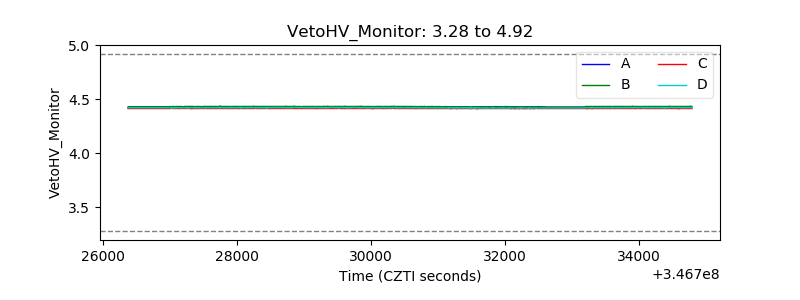 |
| Veto LLD | 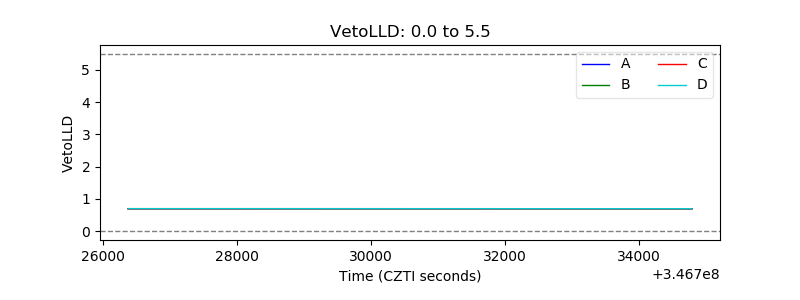 |
| Alpha Counter | 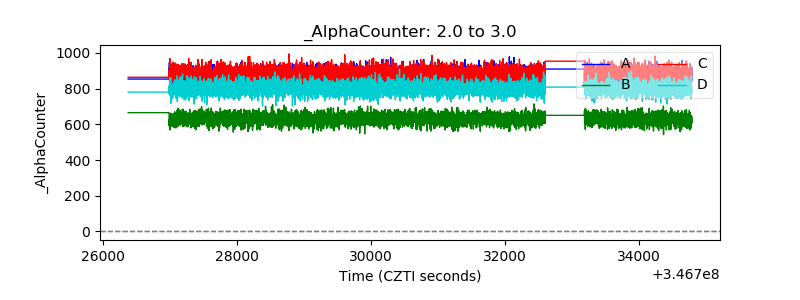 |
| _CPM_Rate | 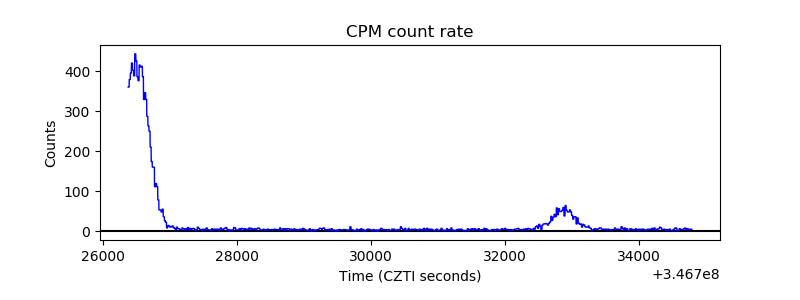 |
| CZT Counter | 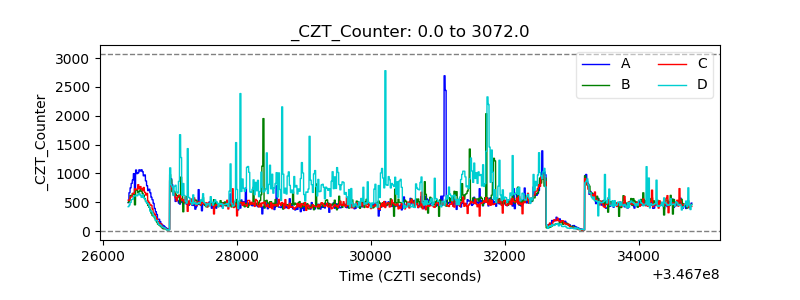 |
| +2.5 Volts monitor |  |
| +5 Volts monitor | 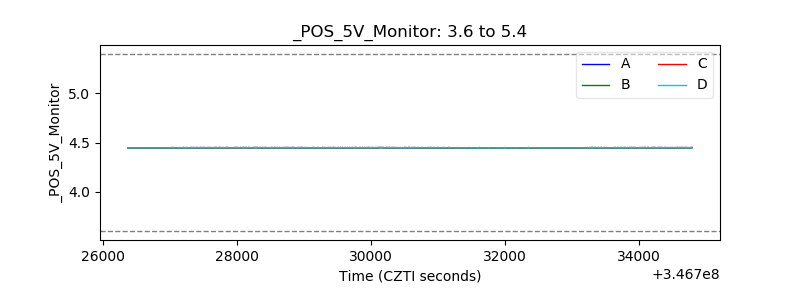 |
| _ROLL_ROT | 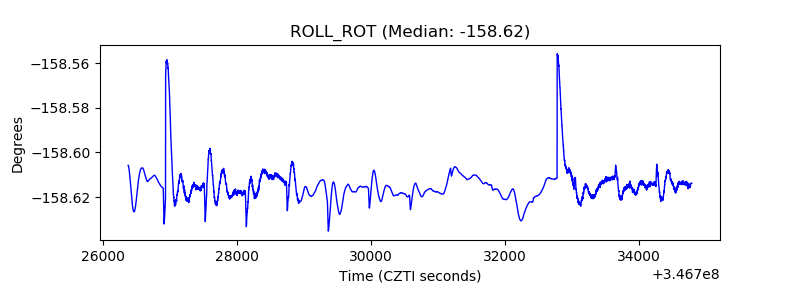 |
| _Roll_DEC | 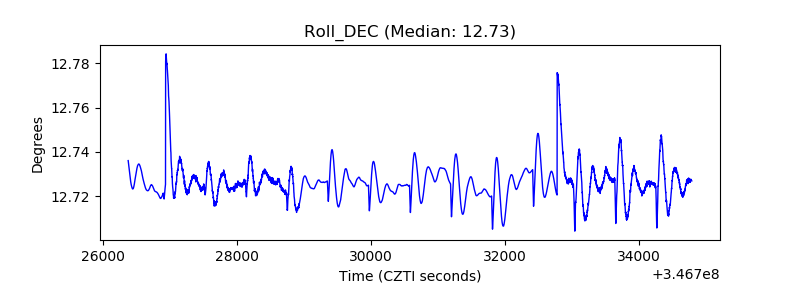 |
| _Roll_RA | 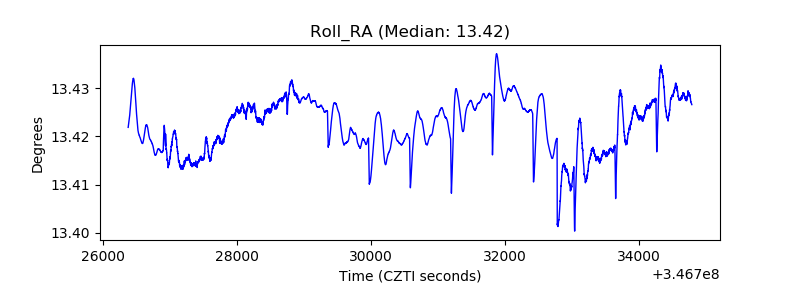 |
| Veto Counter |  |