| Param | Original file | Final file |
|---|---|---|
| Filename | modeM0/AS1A10_101T02_9000004084_28375cztM0_level2.evt | modeM0/AS1A10_101T02_9000004084_28375cztM0_level2_quad_clean.evt |
| Size (bytes) | 532,198,080 | 77,820,480 |
| Size | 507.5 MB | 74.2 MB |
| Events in quadrant A | 3,637,710 | 467,257 |
| Events in quadrant B | 3,931,175 | 472,457 |
| Events in quadrant C | 3,685,559 | 453,555 |
| Events in quadrant D | 4,355,227 | 442,588 |
| Mode M0 | |||
|---|---|---|---|
| Quadrant | BADHDUFLAG | Total packets | Discarded packets |
| A | 0 | 15607 | 0 |
| B | 0 | 16279 | 0 |
| C | 0 | 15654 | 0 |
| D | 0 | 17958 | 0 |
| Mode M9 | |||
|---|---|---|---|
| Quadrant | BADHDUFLAG | Total packets | Discarded packets |
| A | 0 | 1 | 0 |
| B | 0 | 1 | 0 |
| C | 0 | 1 | 0 |
| D | 0 | 1 | 0 |
| Quadrant | Total seconds | Saturated seconds | Saturation percentage |
|---|---|---|---|
| A | 7486 | 211 | 2.818595% |
| B | 7486 | 264 | 3.526583% |
| C | 7487 | 241 | 3.218913% |
| D | 7487 | 147 | 1.963403% |
Noise dominated data is calculated using 1-second bins in cleaned event files. If a bin has >2000 counts, and if more than 50% of those come from <1% of pixels, then it is considered to be noise-dominated and hence unusable.
| Quadrant | # 1 sec bins | Bins with >0 counts | Bins with >2000 counts | High rate bins dominated by noise | Noise dominated (total time) | Noise dominated (detector-on time) | Marked lightcurve |
|---|---|---|---|---|---|---|---|
| A | 7561 | 7487 | 0 | 0 | 0.00% | 0.00% | 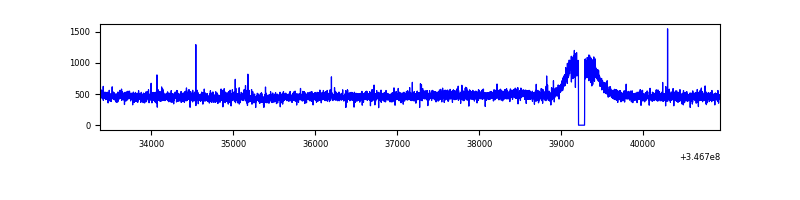 |
| B | 7561 | 7487 | 2 | 2 | 0.03% | 0.03% | 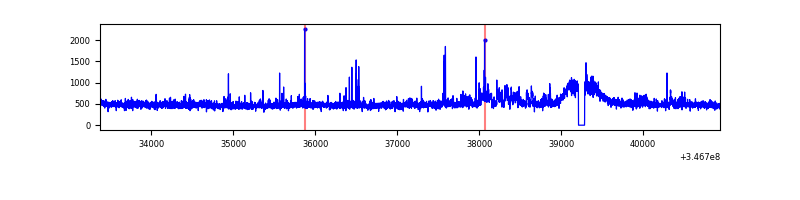 |
| C | 7562 | 7488 | 0 | 0 | 0.00% | 0.00% | 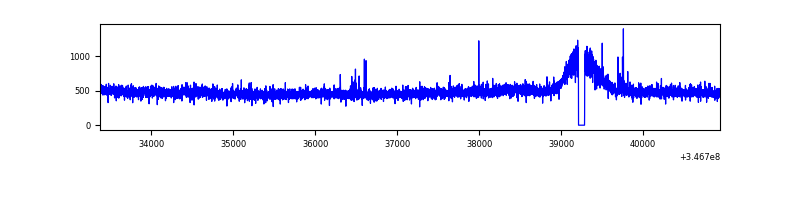 |
| D | 7562 | 7488 | 26 | 26 | 0.34% | 0.35% | 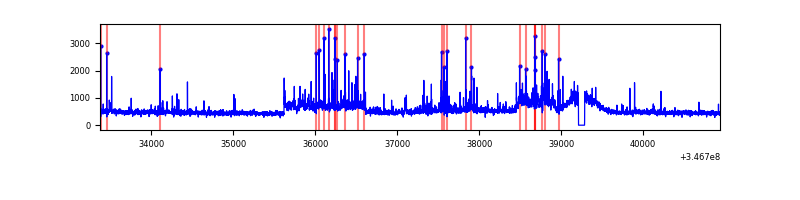 |
Top three noisy pixels from each quadrant. If the there are fewer than three noisy pixels in the level2.evt file, extra rows are filled as -1
| Pixel properties | Quadrant properties | ||||||
|---|---|---|---|---|---|---|---|
| Quadrant | DetID | PixID | Counts | Sigma | Mean | Median | Sigma |
| A | 13 | 254 | 12525 | 60.75 | 938 | 916 | 191.1 |
| A | 6 | 16 | 11748 | 56.68 | 938 | 916 | 191.1 |
| A | 3 | 137 | 9702 | 45.97 | 938 | 916 | 191.1 |
| B | 10 | 245 | 230729 | 1251.56 | 934 | 908 | 183.6 |
| B | 12 | 111 | 23281 | 121.84 | 934 | 908 | 183.6 |
| B | 11 | 111 | 21179 | 110.39 | 934 | 908 | 183.6 |
| C | 14 | 238 | 142757 | 661.69 | 903 | 906 | 214.4 |
| C | 7 | 220 | 20073 | 89.41 | 903 | 906 | 214.4 |
| C | 13 | 61 | 6149 | 24.46 | 903 | 906 | 214.4 |
| D | 8 | 195 | 699086 | 3163.2 | 913 | 887 | 220.7 |
| D | 1 | 52 | 104005 | 467.18 | 913 | 887 | 220.7 |
| D | 2 | 250 | 38103 | 168.61 | 913 | 887 | 220.7 |
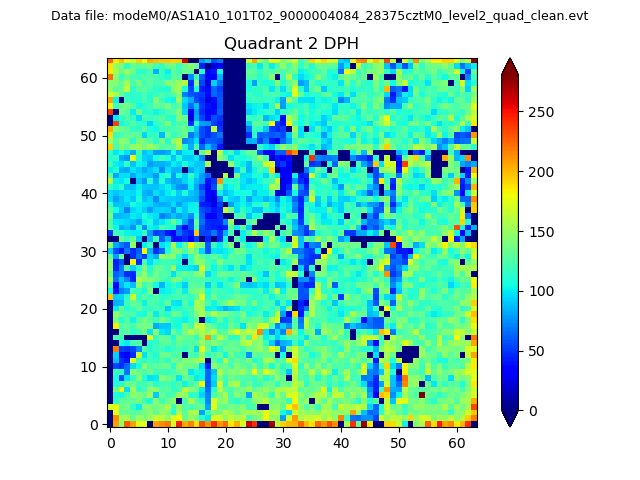
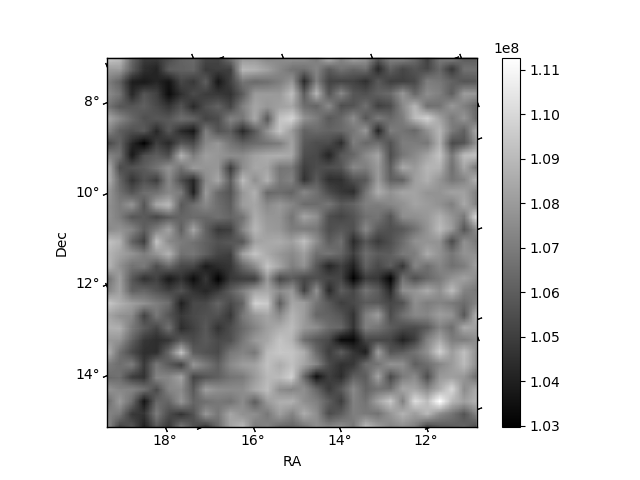
Histogram calculated using DETX and DETY for each event in the final _common_clean file
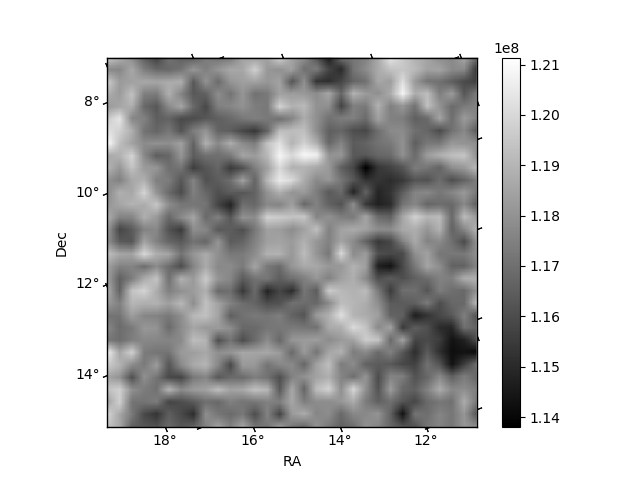
| Quadrant A | 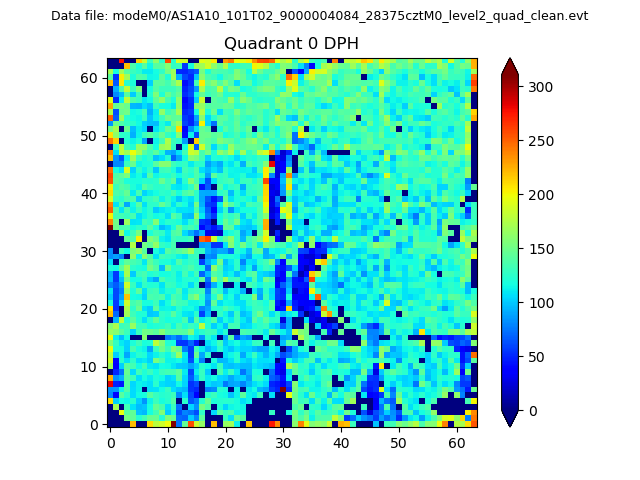 |
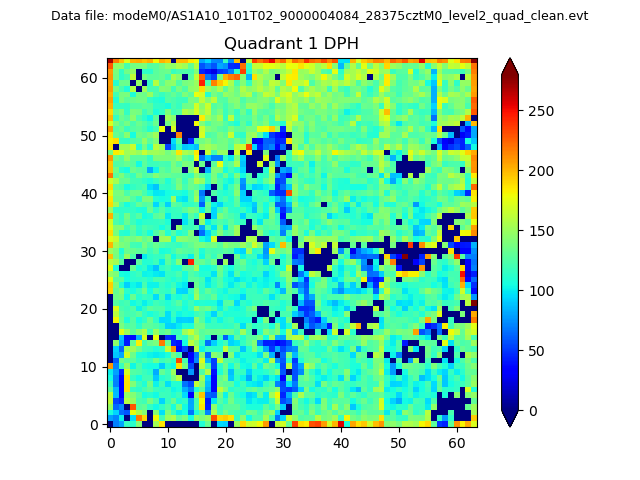 |
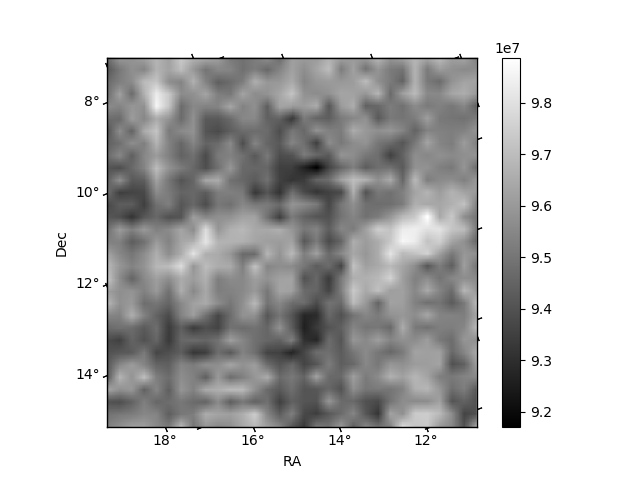
Quadrant B |
|---|---|---|---|
| Quadrant D | 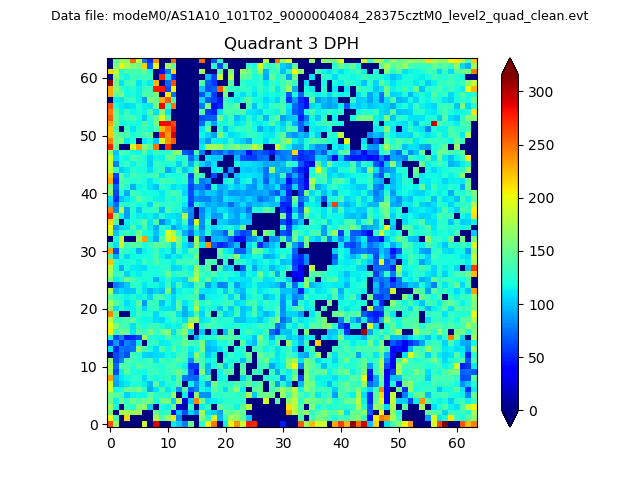 |
 |
Quadrant C |
| Plot type | Count rate plots | Images |
|---|---|---|
| Comparison with Poisson distribution Blue bars denote a histogram of data divided into 1 sec bins. Red curve is a Poisson curve with rate = median count rate of data. |
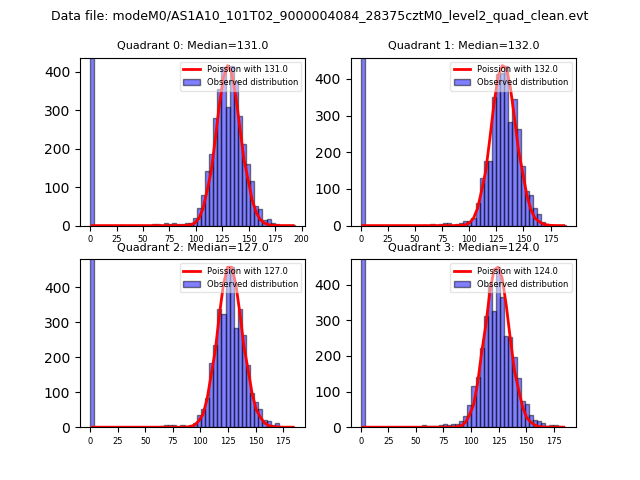 |
 |
| Quadrant-wise count rates Data is divided into 100 sec bins |
 |
|
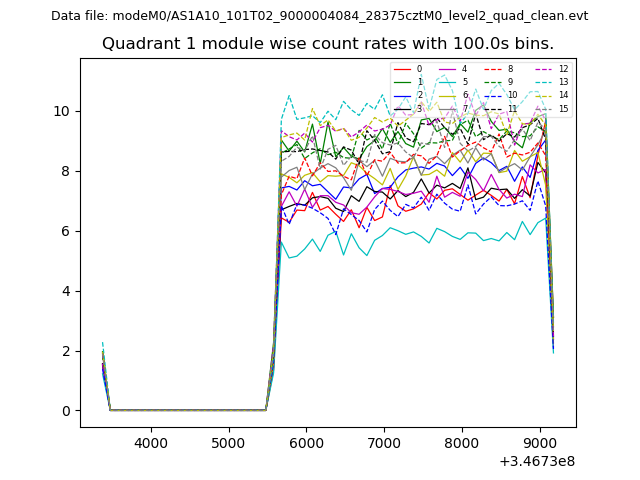
| Module-wise count rates for Quadrant A Data is divided into 100 sec bins |
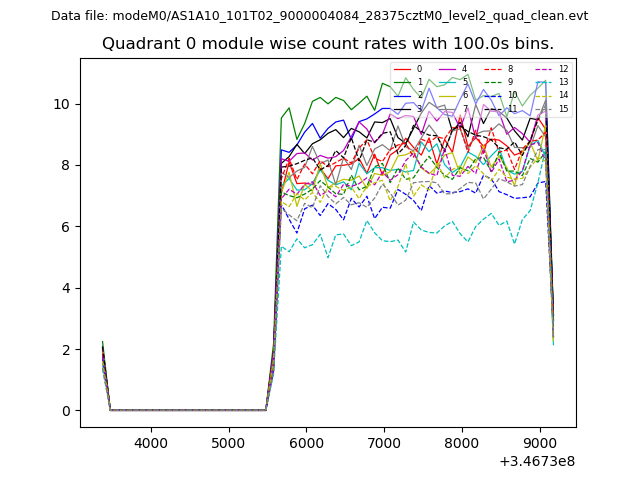 |
 |
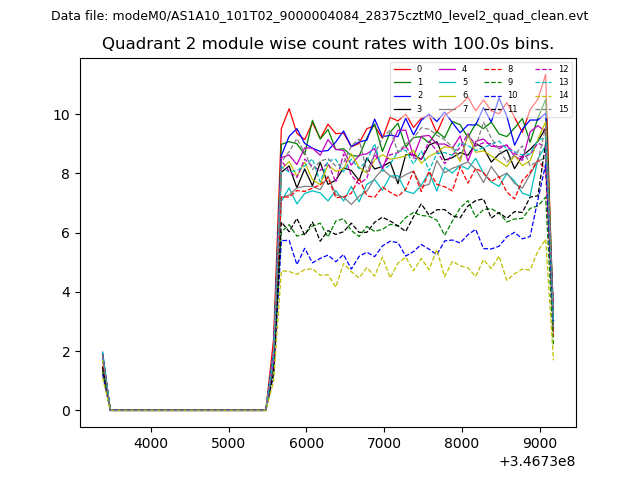
| Module-wise count rates for Quadrant B Data is divided into 100 sec bins |
 |
 |
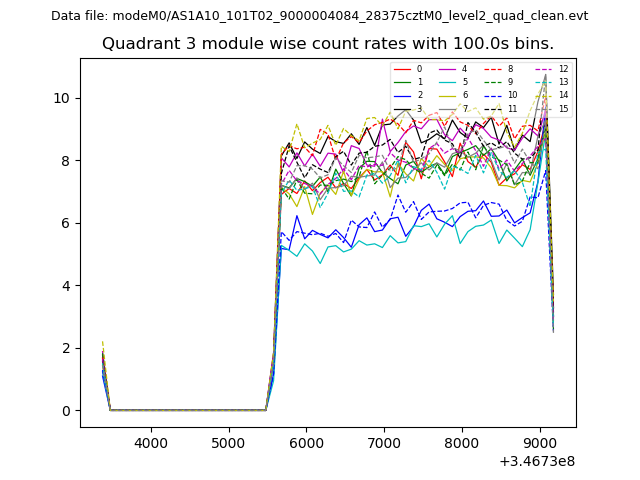
| Module-wise count rates for Quadrant C Data is divided into 100 sec bins |
 |
 |
| Module-wise count rates for Quadrant D Data is divided into 100 sec bins |
 |
 |
| Parameter | Plot |
|---|---|
| CZT HV Monitor | 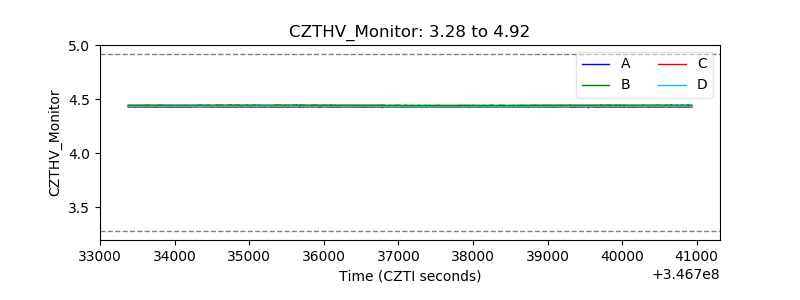 |
| D_VDD | 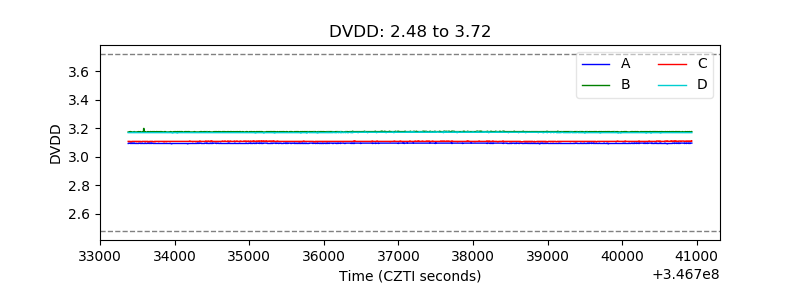 |
| Temperature 1 | 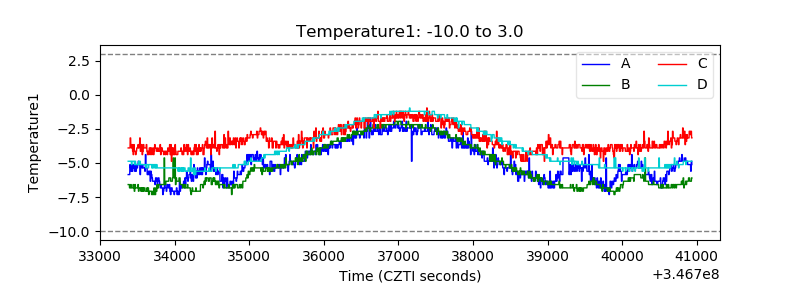 |
| Veto HV Monitor | 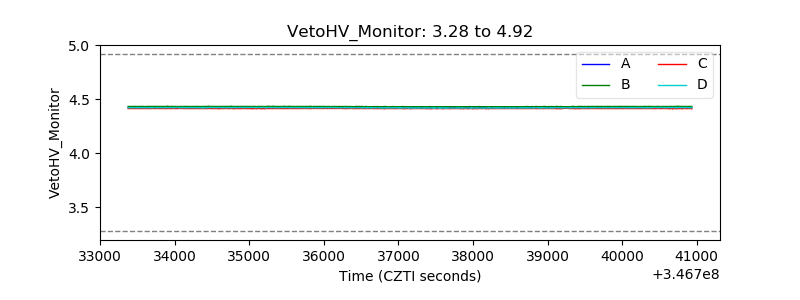 |
| Veto LLD | 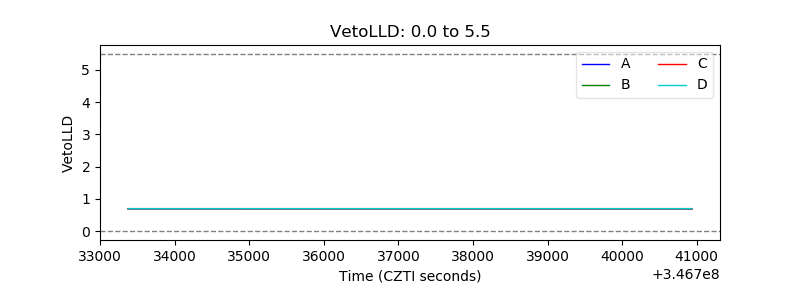 |
| Alpha Counter | 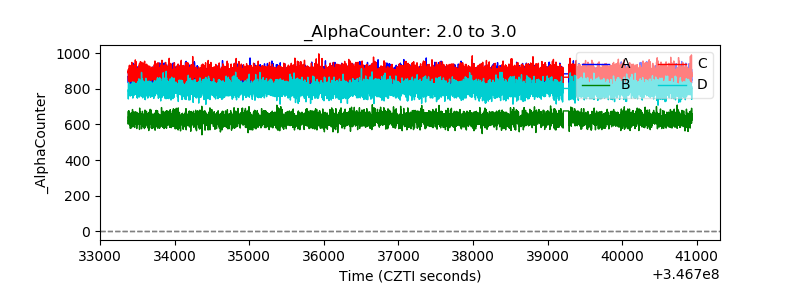 |
| _CPM_Rate | 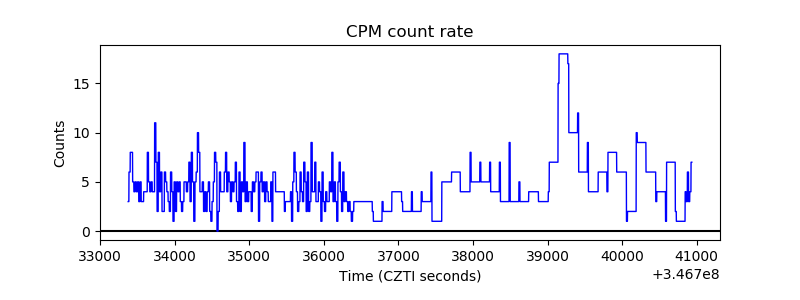 |
| CZT Counter | 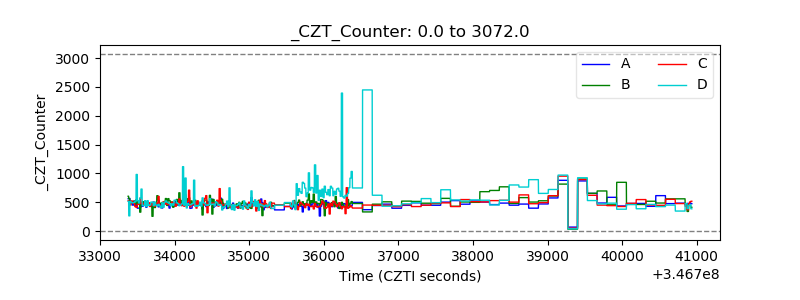 |
| +2.5 Volts monitor |  |
| +5 Volts monitor |  |
| _ROLL_ROT | 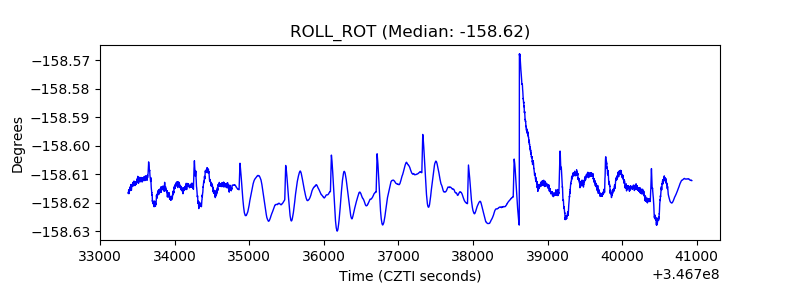 |
| _Roll_DEC | 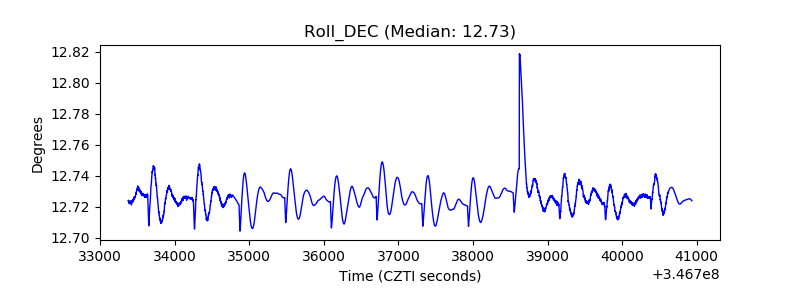 |
| _Roll_RA | 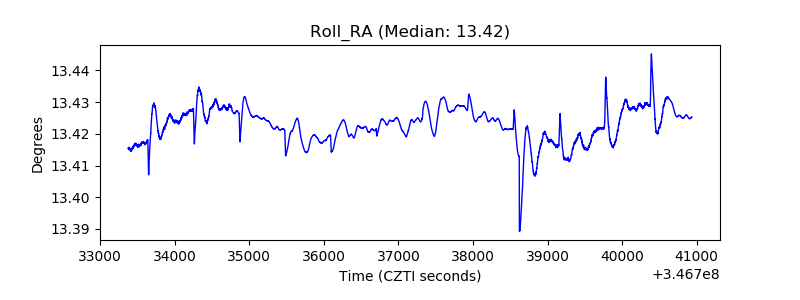 |
| Veto Counter | 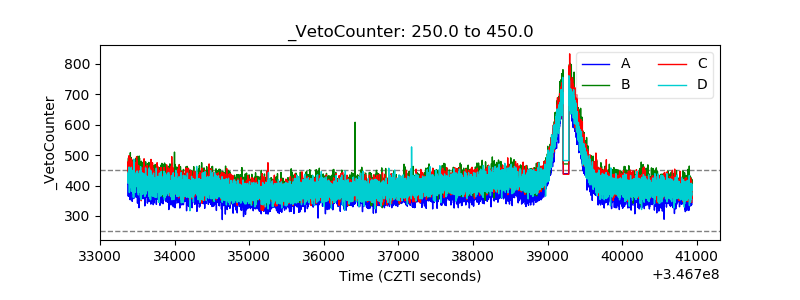 |