| Param | Original file | Final file |
|---|---|---|
| Filename | modeM0/AS1A10_101T02_9000004084_28376cztM0_level2.evt | modeM0/AS1A10_101T02_9000004084_28376cztM0_level2_quad_clean.evt |
| Size (bytes) | 543,369,600 | 77,546,880 |
| Size | 518.2 MB | 74.0 MB |
| Events in quadrant A | 3,662,705 | 460,217 |
| Events in quadrant B | 4,002,780 | 466,930 |
| Events in quadrant C | 3,809,782 | 447,577 |
| Events in quadrant D | 4,458,197 | 438,010 |
| Mode M0 | |||
|---|---|---|---|
| Quadrant | BADHDUFLAG | Total packets | Discarded packets |
| A | 0 | 15824 | 0 |
| B | 0 | 16565 | 0 |
| C | 0 | 16137 | 0 |
| D | 0 | 18316 | 0 |
| Mode M9 | |||
|---|---|---|---|
| Quadrant | BADHDUFLAG | Total packets | Discarded packets |
| A | 0 | 1 | 0 |
| B | 0 | 1 | 0 |
| C | 0 | 1 | 0 |
| D | 0 | 1 | 0 |
| Quadrant | Total seconds | Saturated seconds | Saturation percentage |
|---|---|---|---|
| A | 7696 | 178 | 2.312890% |
| B | 7697 | 278 | 3.611797% |
| C | 7697 | 219 | 2.845264% |
| D | 7697 | 196 | 2.546447% |
Noise dominated data is calculated using 1-second bins in cleaned event files. If a bin has >2000 counts, and if more than 50% of those come from <1% of pixels, then it is considered to be noise-dominated and hence unusable.
| Quadrant | # 1 sec bins | Bins with >0 counts | Bins with >2000 counts | High rate bins dominated by noise | Noise dominated (total time) | Noise dominated (detector-on time) | Marked lightcurve |
|---|---|---|---|---|---|---|---|
| A | 7806 | 7697 | 0 | 0 | 0.00% | 0.00% | 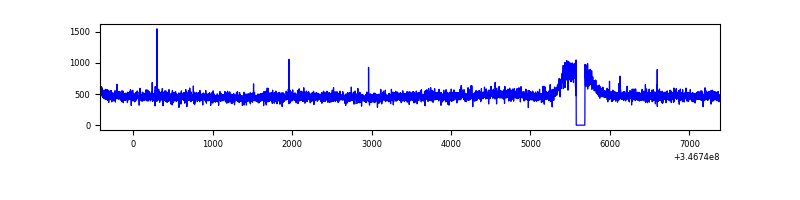 |
| B | 7807 | 7697 | 36 | 36 | 0.46% | 0.47% | 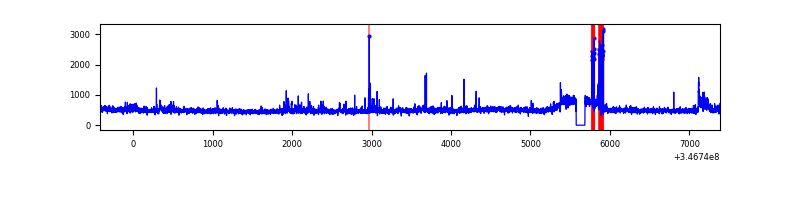 |
| C | 7807 | 7698 | 12 | 12 | 0.15% | 0.16% | 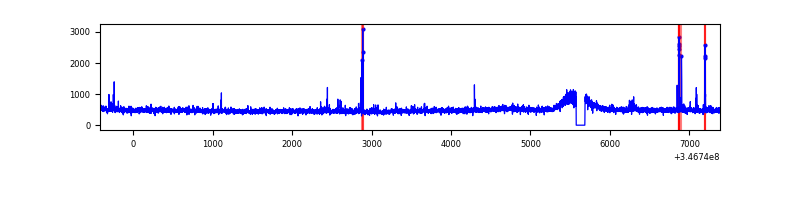 |
| D | 7807 | 7697 | 44 | 44 | 0.56% | 0.57% | 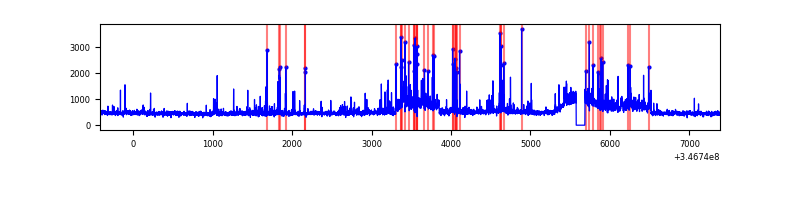 |
Top three noisy pixels from each quadrant. If the there are fewer than three noisy pixels in the level2.evt file, extra rows are filled as -1
| Pixel properties | Quadrant properties | ||||||
|---|---|---|---|---|---|---|---|
| Quadrant | DetID | PixID | Counts | Sigma | Mean | Median | Sigma |
| A | 13 | 254 | 12836 | 61.64 | 949 | 926 | 193.2 |
| A | 3 | 137 | 9895 | 46.42 | 949 | 926 | 193.2 |
| A | 0 | 226 | 7895 | 36.07 | 949 | 926 | 193.2 |
| B | 10 | 245 | 258579 | 1410.91 | 940 | 916 | 182.6 |
| B | 12 | 111 | 23558 | 123.98 | 940 | 916 | 182.6 |
| B | 11 | 111 | 21345 | 111.87 | 940 | 916 | 182.6 |
| C | 14 | 238 | 145026 | 662.28 | 914 | 918 | 217.6 |
| C | 7 | 220 | 103408 | 471.01 | 914 | 918 | 217.6 |
| C | 13 | 61 | 6358 | 25.0 | 914 | 918 | 217.6 |
| D | 8 | 195 | 672671 | 3031.41 | 919 | 890 | 221.6 |
| D | 1 | 52 | 206017 | 925.63 | 919 | 890 | 221.6 |
| D | 2 | 250 | 68613 | 305.6 | 919 | 890 | 221.6 |
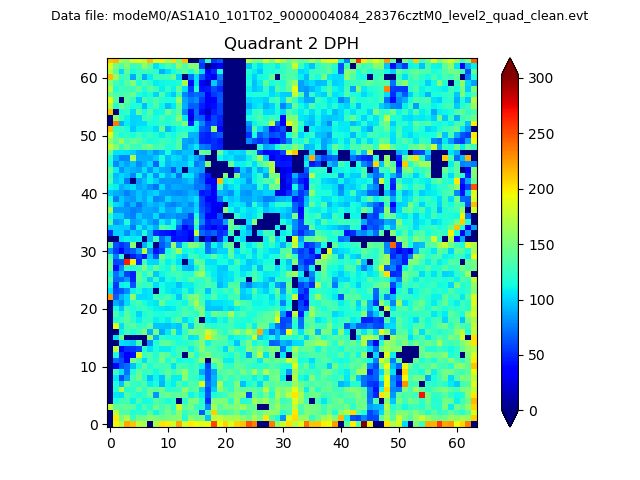
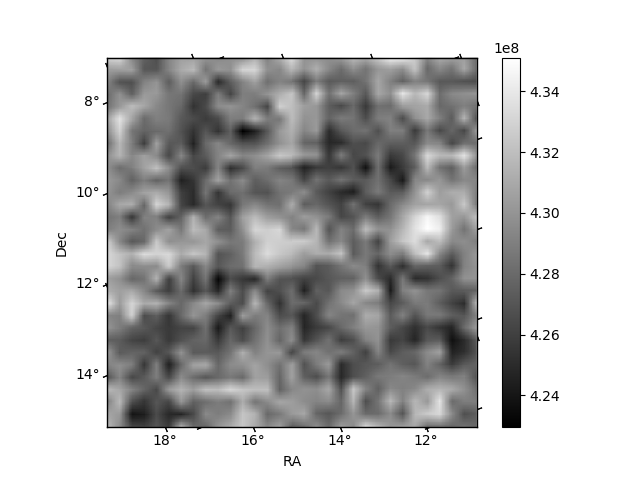
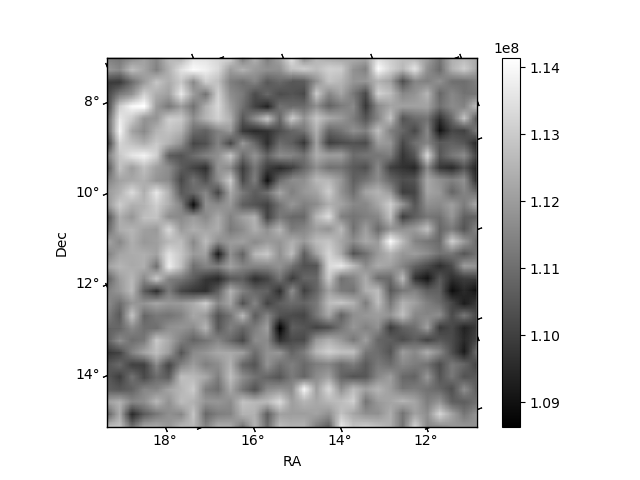
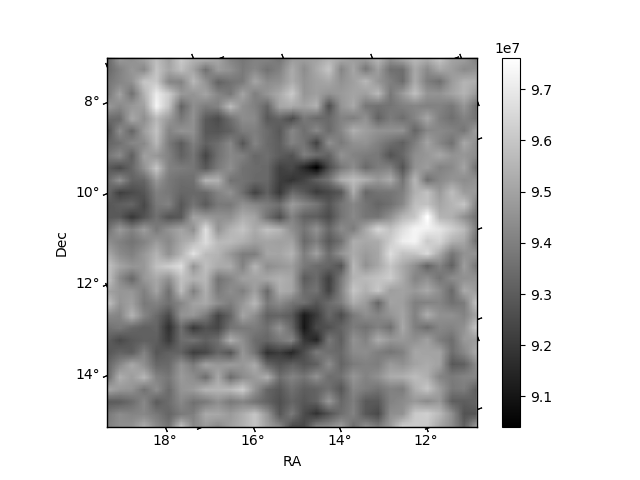
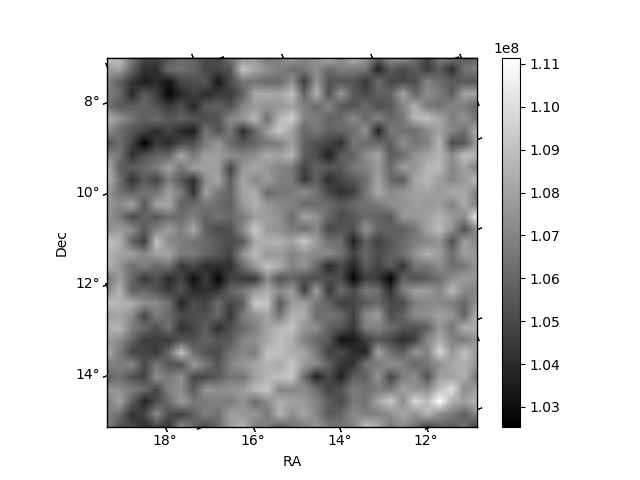
Histogram calculated using DETX and DETY for each event in the final _common_clean file
| Quadrant A | 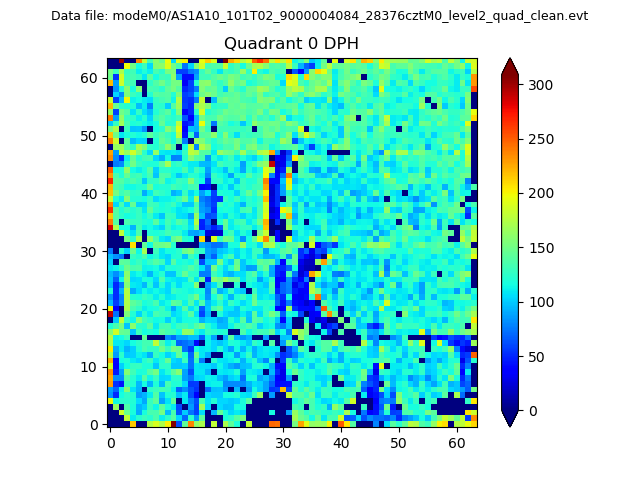 |
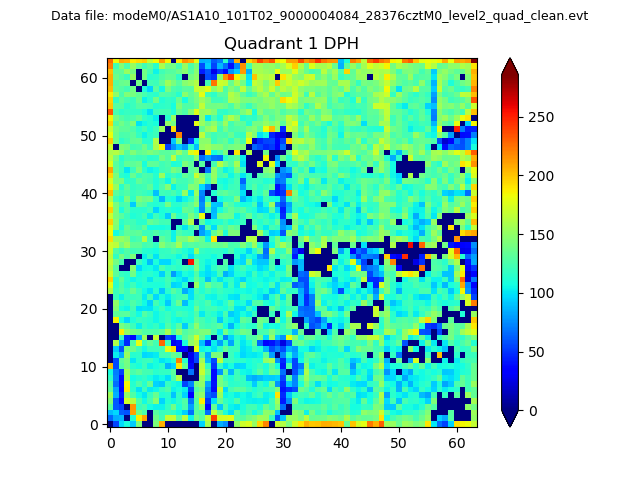 |
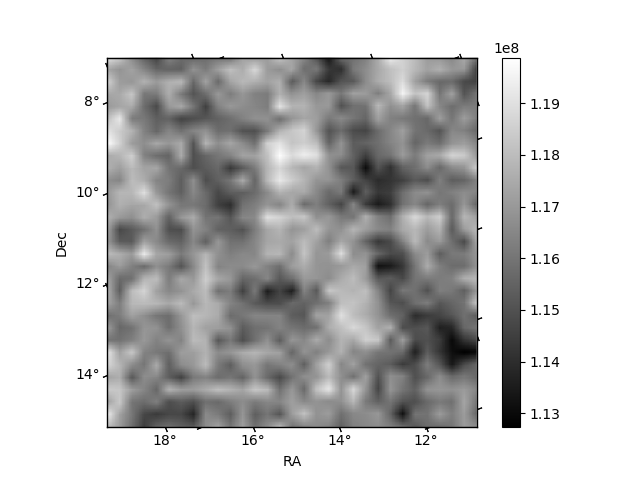
Quadrant B |
|---|---|---|---|
| Quadrant D | 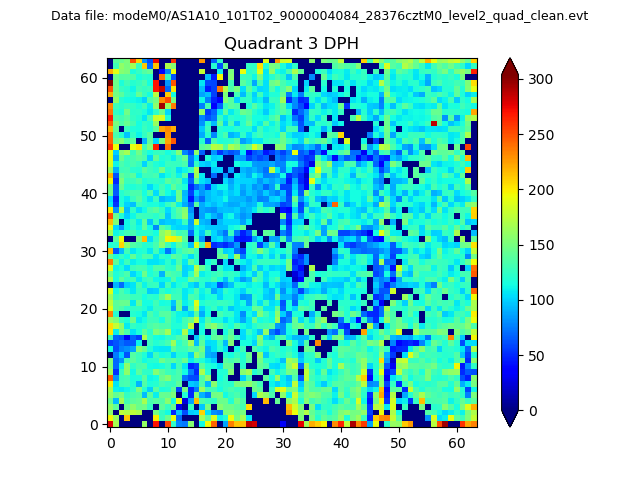 |
 |
Quadrant C |
| Plot type | Count rate plots | Images |
|---|---|---|
| Comparison with Poisson distribution Blue bars denote a histogram of data divided into 1 sec bins. Red curve is a Poisson curve with rate = median count rate of data. |
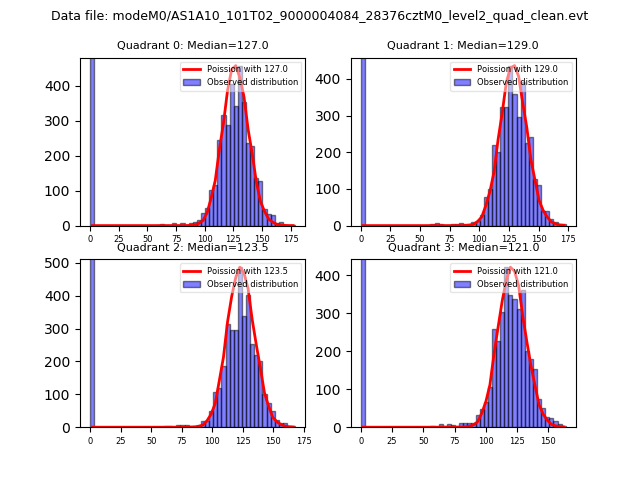 |
 |
| Quadrant-wise count rates Data is divided into 100 sec bins |
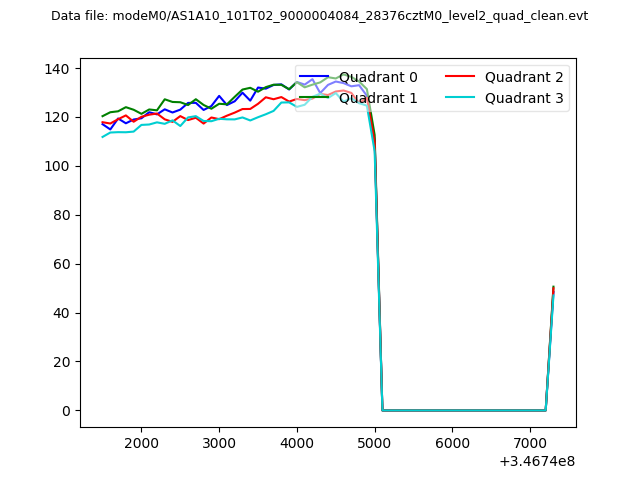 |
|
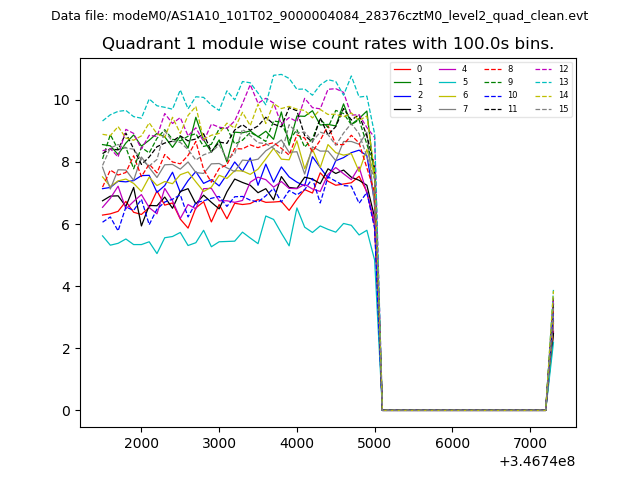
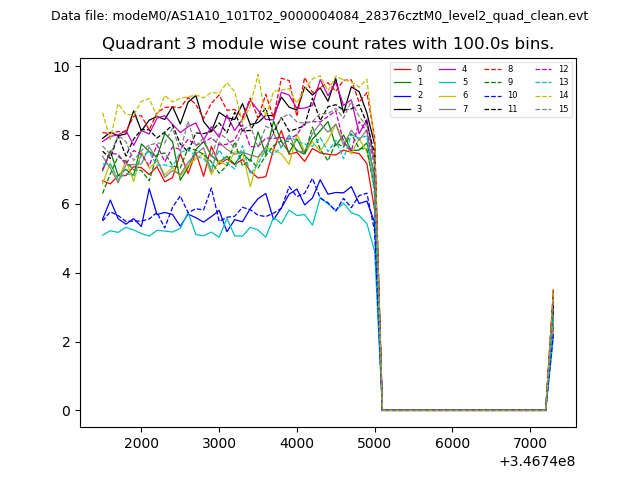
| Module-wise count rates for Quadrant A Data is divided into 100 sec bins |
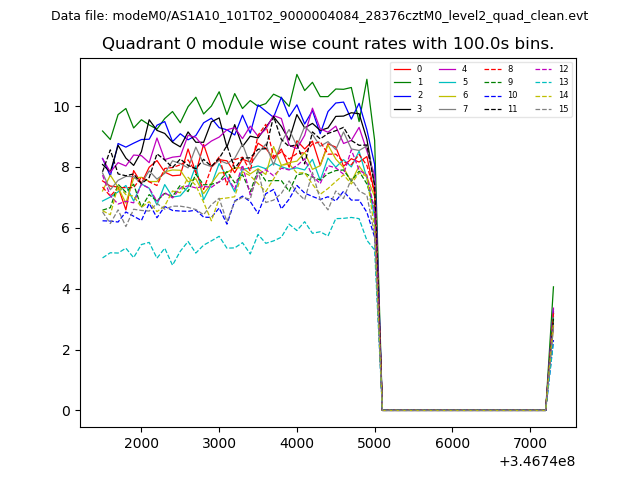 |
 |
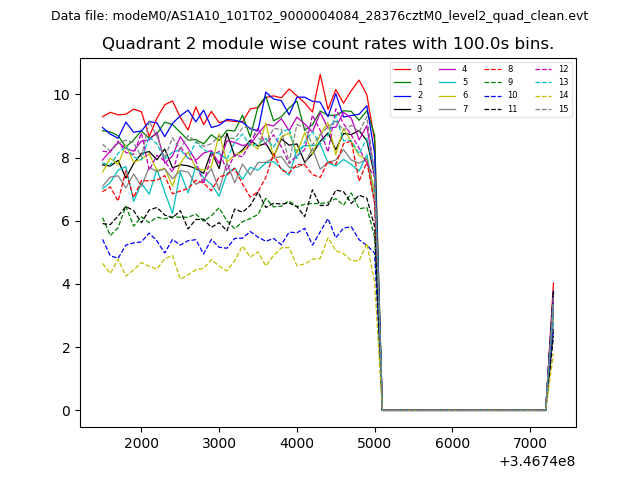
| Module-wise count rates for Quadrant B Data is divided into 100 sec bins |
 |
 |
| Module-wise count rates for Quadrant C Data is divided into 100 sec bins |
 |
 |
| Module-wise count rates for Quadrant D Data is divided into 100 sec bins |
 |
 |
| Parameter | Plot |
|---|---|
| CZT HV Monitor | 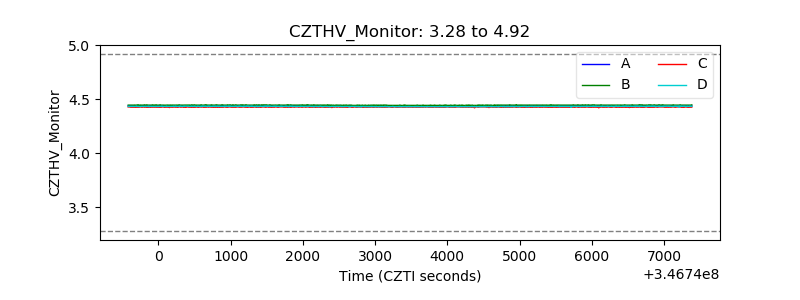 |
| D_VDD | 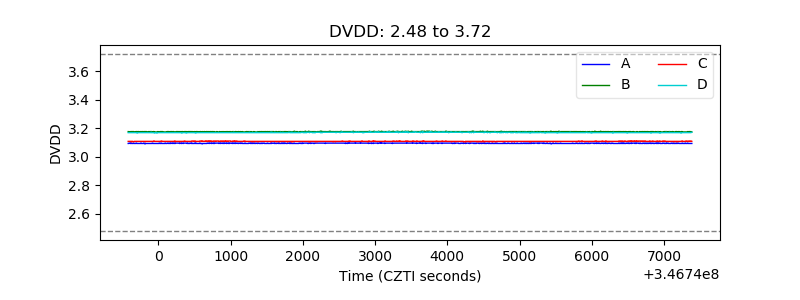 |
| Temperature 1 |  |
| Veto HV Monitor | 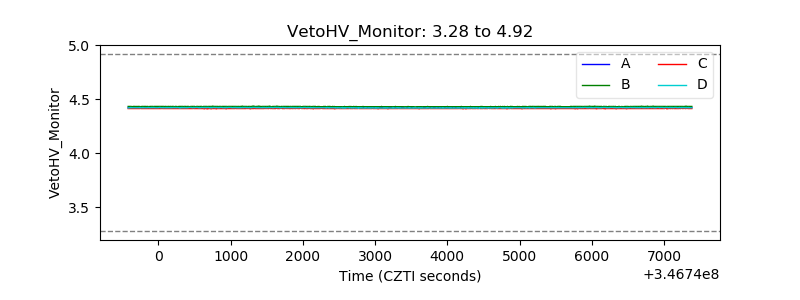 |
| Veto LLD | 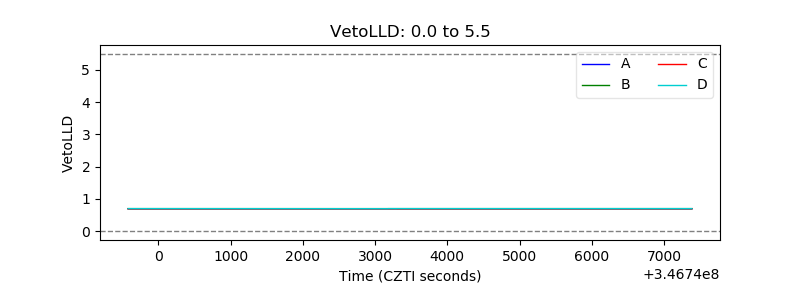 |
| Alpha Counter | 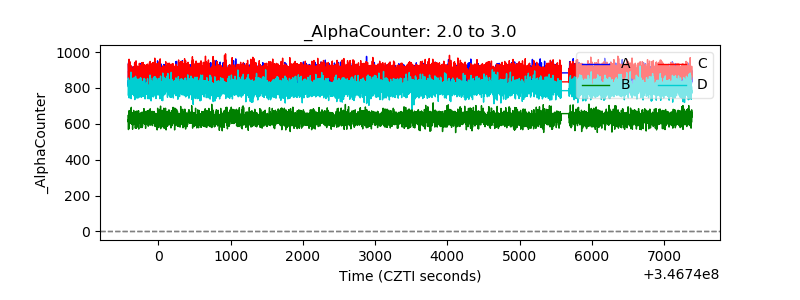 |
| _CPM_Rate | 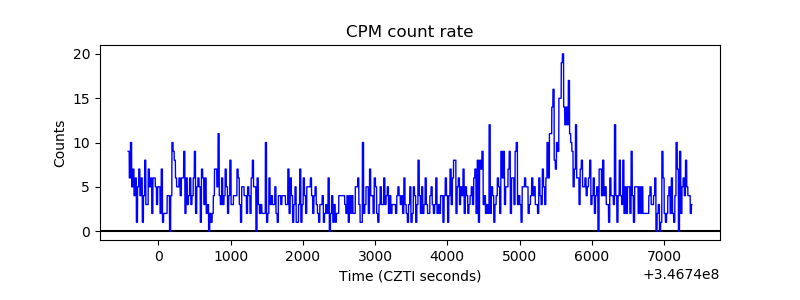 |
| CZT Counter | 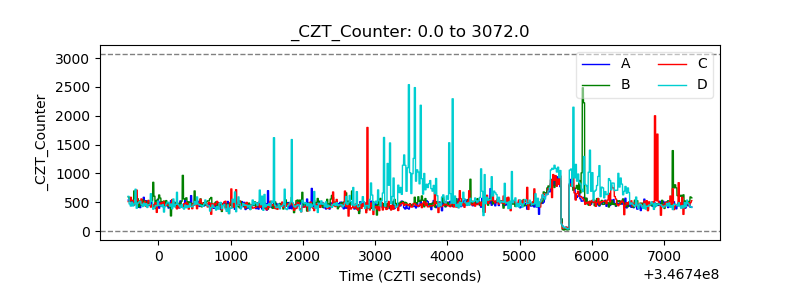 |
| +2.5 Volts monitor |  |
| +5 Volts monitor |  |
| _ROLL_ROT | 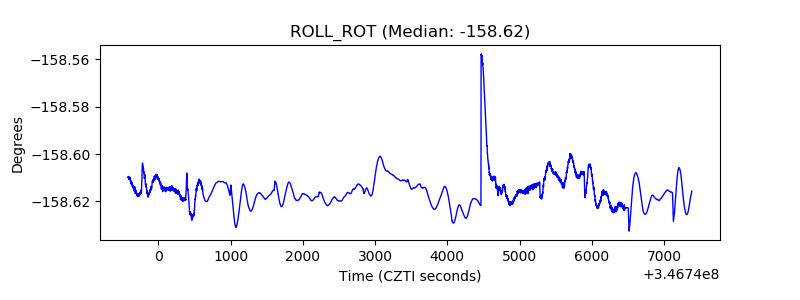 |
| _Roll_DEC | 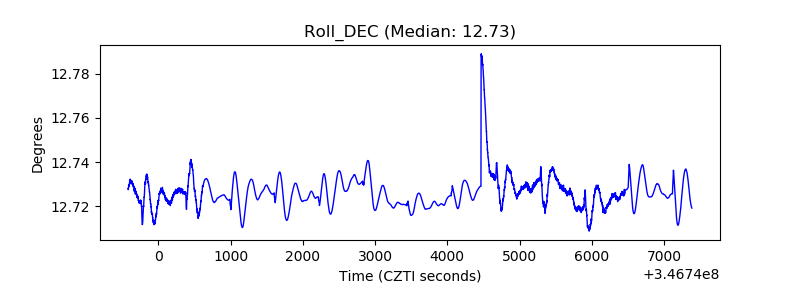 |
| _Roll_RA | 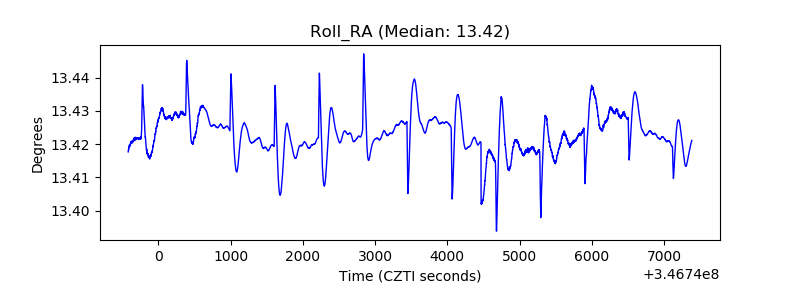 |
| Veto Counter | 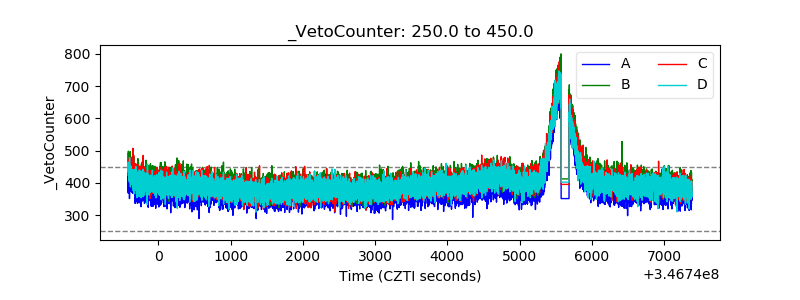 |