| Param | Original file | Final file |
|---|---|---|
| Filename | modeM0/AS1A10_101T02_9000004084_28379cztM0_level2.evt | modeM0/AS1A10_101T02_9000004084_28379cztM0_level2_quad_clean.evt |
| Size (bytes) | 1,398,864,960 | 237,585,600 |
| Size | 1.3 GB | 226.6 MB |
| Events in quadrant A | 9,733,250 | 1,515,022 |
| Events in quadrant B | 10,177,371 | 1,530,743 |
| Events in quadrant C | 9,567,722 | 1,449,425 |
| Events in quadrant D | 11,635,177 | 1,423,974 |
| Mode M0 | |||
|---|---|---|---|
| Quadrant | BADHDUFLAG | Total packets | Discarded packets |
| A | 0 | 40778 | 0 |
| B | 0 | 41960 | 0 |
| C | 0 | 40211 | 0 |
| D | 0 | 47016 | 0 |
| Mode M9 | |||
|---|---|---|---|
| Quadrant | BADHDUFLAG | Total packets | Discarded packets |
| A | 0 | 17 | 0 |
| B | 0 | 17 | 0 |
| C | 0 | 17 | 0 |
| D | 0 | 17 | 0 |
| Quadrant | Total seconds | Saturated seconds | Saturation percentage |
|---|---|---|---|
| A | 18530 | 530 | 2.860227% |
| B | 18531 | 353 | 1.904916% |
| C | 18531 | 554 | 2.989585% |
| D | 18531 | 422 | 2.277265% |
Noise dominated data is calculated using 1-second bins in cleaned event files. If a bin has >2000 counts, and if more than 50% of those come from <1% of pixels, then it is considered to be noise-dominated and hence unusable.
| Quadrant | # 1 sec bins | Bins with >0 counts | Bins with >2000 counts | High rate bins dominated by noise | Noise dominated (total time) | Noise dominated (detector-on time) | Marked lightcurve |
|---|---|---|---|---|---|---|---|
| A | 20229 | 18530 | 317 | 317 | 1.57% | 1.71% | 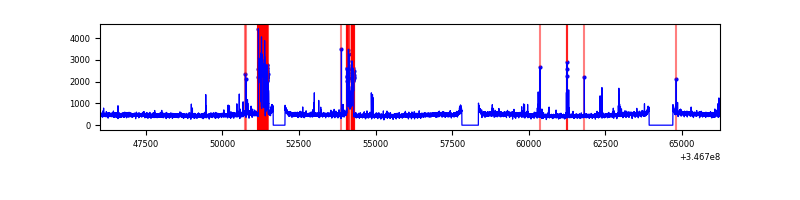 |
| B | 20231 | 18531 | 53 | 53 | 0.26% | 0.29% | 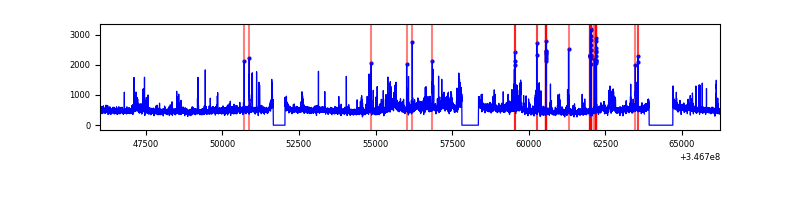 |
| C | 20231 | 18531 | 209 | 209 | 1.03% | 1.13% | 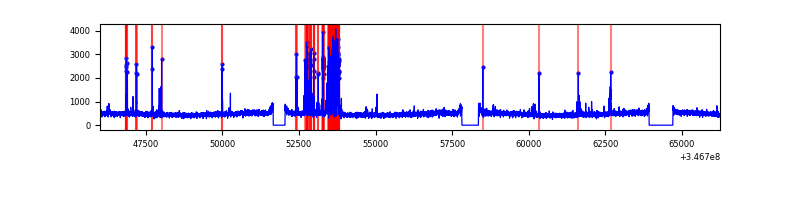 |
| D | 20231 | 18532 | 247 | 247 | 1.22% | 1.33% | 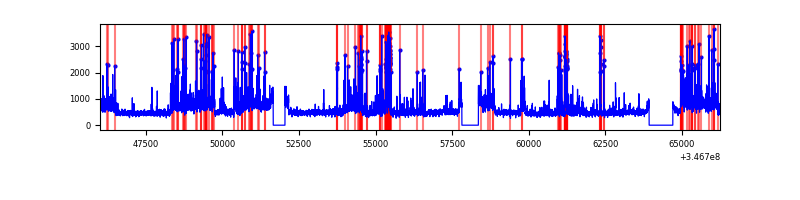 |
Top three noisy pixels from each quadrant. If the there are fewer than three noisy pixels in the level2.evt file, extra rows are filled as -1
| Pixel properties | Quadrant properties | ||||||
|---|---|---|---|---|---|---|---|
| Quadrant | DetID | PixID | Counts | Sigma | Mean | Median | Sigma |
| A | 15 | 174 | 1000694 | 2218.56 | 2231 | 2179 | 450.1 |
| A | 12 | 96 | 114731 | 250.07 | 2231 | 2179 | 450.1 |
| A | 13 | 254 | 30511 | 62.95 | 2231 | 2179 | 450.1 |
| B | 10 | 245 | 1248697 | 2897.4 | 2226 | 2165 | 430.2 |
| B | 0 | 230 | 94123 | 213.74 | 2226 | 2165 | 430.2 |
| B | 4 | 200 | 76822 | 173.53 | 2226 | 2165 | 430.2 |
| C | 7 | 220 | 877647 | 1745.19 | 2138 | 2151 | 501.7 |
| C | 14 | 238 | 344420 | 682.27 | 2138 | 2151 | 501.7 |
| C | 13 | 61 | 14637 | 24.89 | 2138 | 2151 | 501.7 |
| D | 8 | 195 | 2310574 | 4442.78 | 2169 | 2110 | 519.6 |
| D | 2 | 250 | 613810 | 1177.25 | 2169 | 2110 | 519.6 |
| D | 1 | 52 | 469608 | 899.73 | 2169 | 2110 | 519.6 |
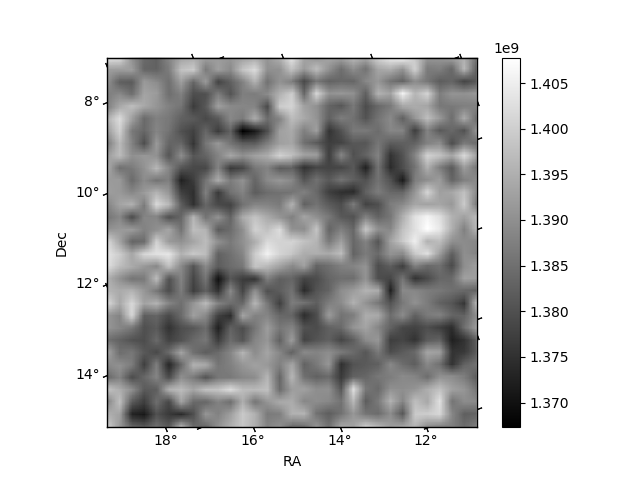
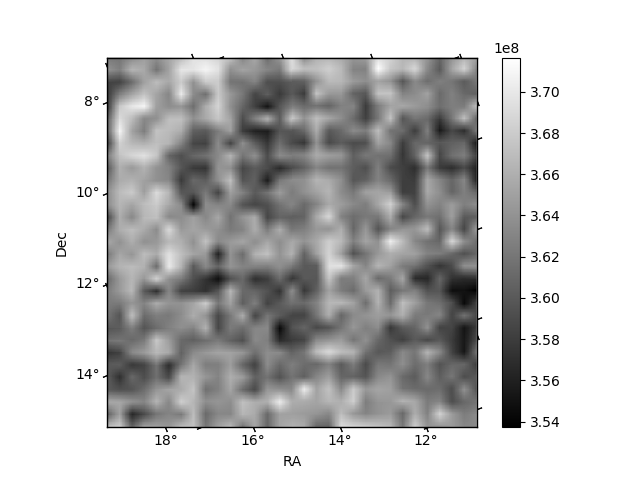
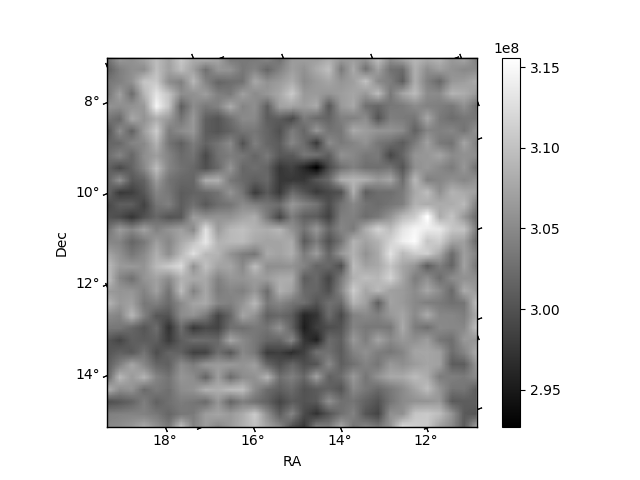
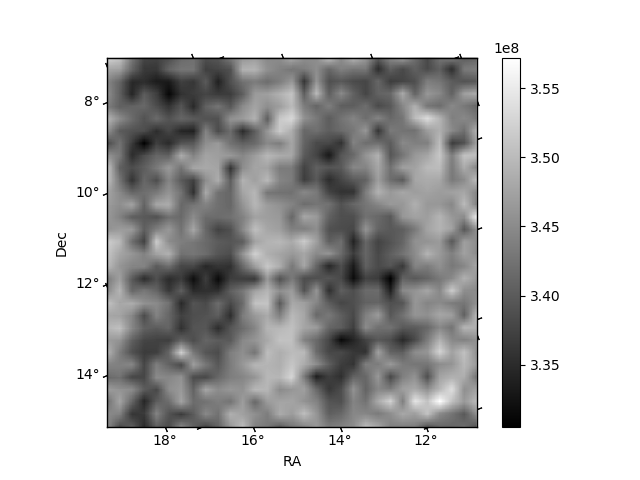
Histogram calculated using DETX and DETY for each event in the final _common_clean file
| Quadrant A | 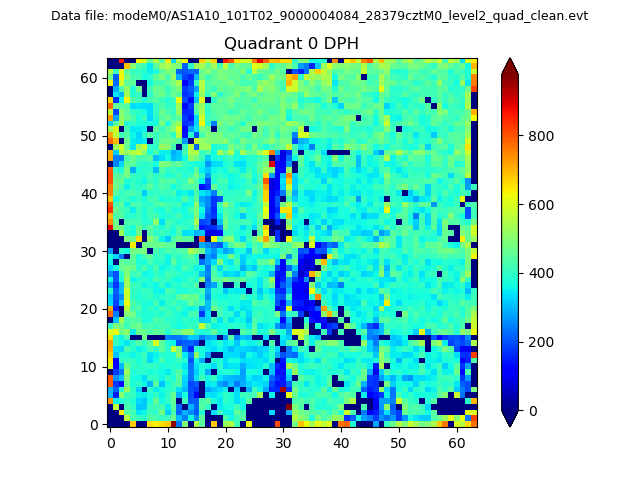 |
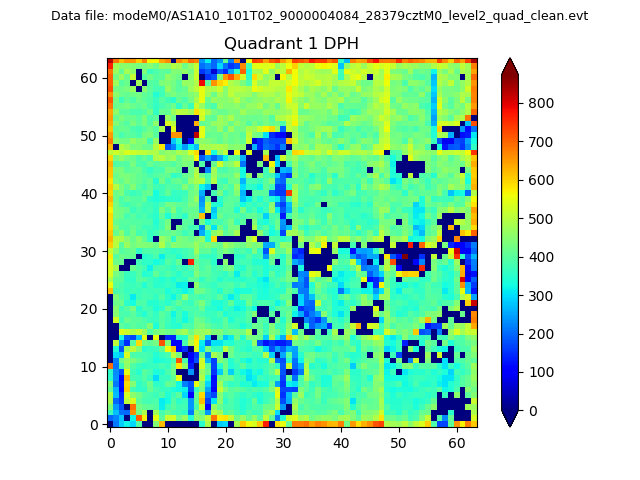 |
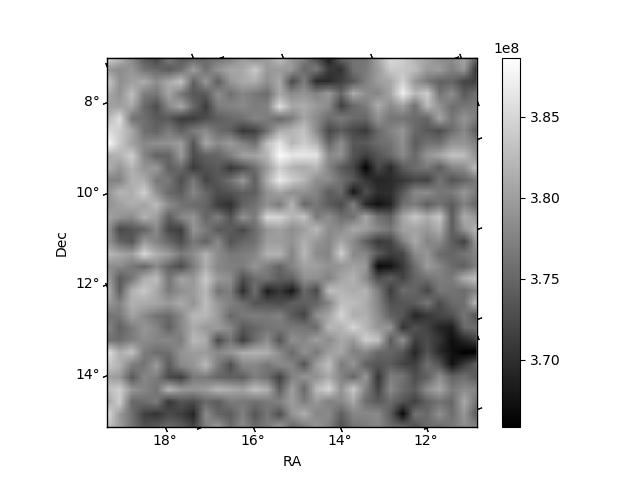
Quadrant B |
|---|---|---|---|
| Quadrant D | 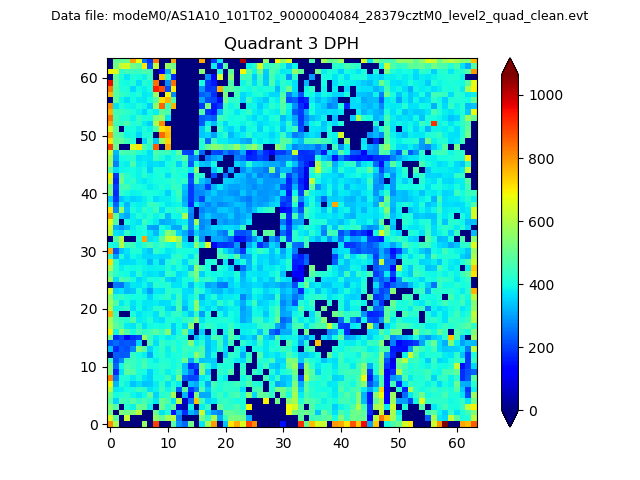 |
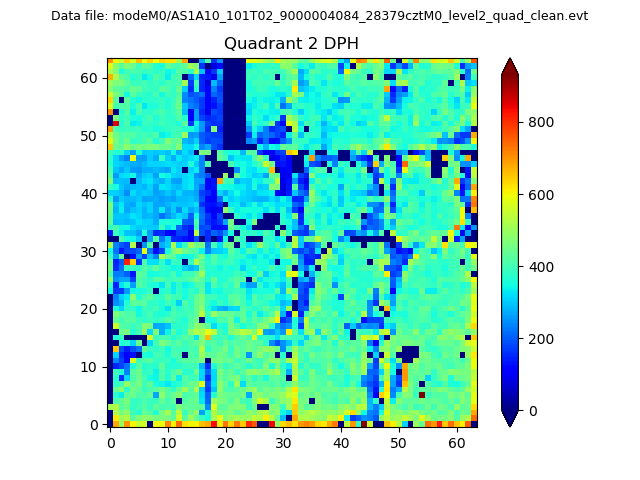 |
Quadrant C |
| Plot type | Count rate plots | Images |
|---|---|---|
| Comparison with Poisson distribution Blue bars denote a histogram of data divided into 1 sec bins. Red curve is a Poisson curve with rate = median count rate of data. |
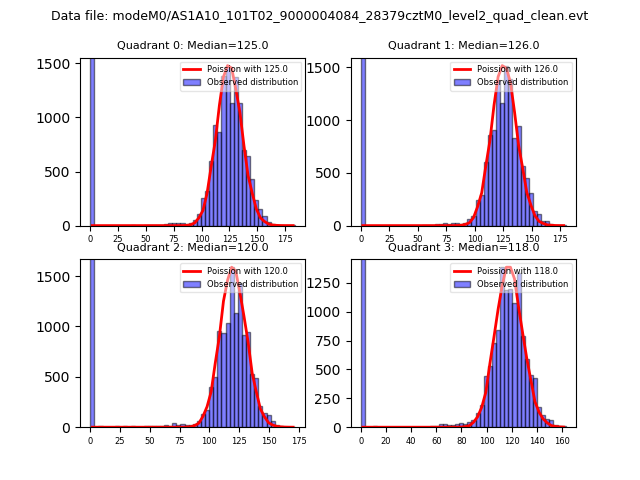 |
 |
| Quadrant-wise count rates Data is divided into 100 sec bins |
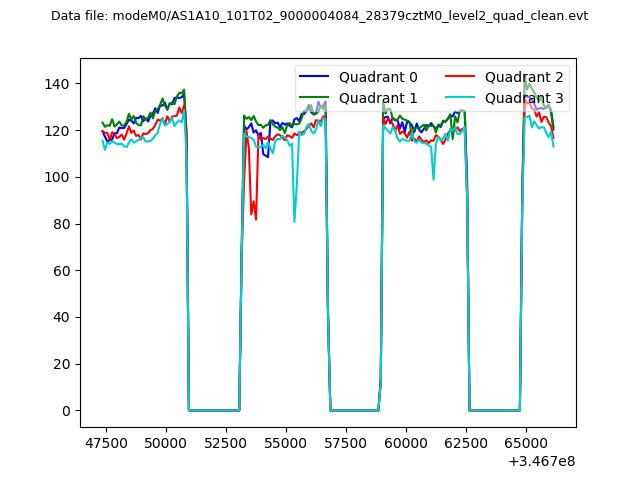 |
|
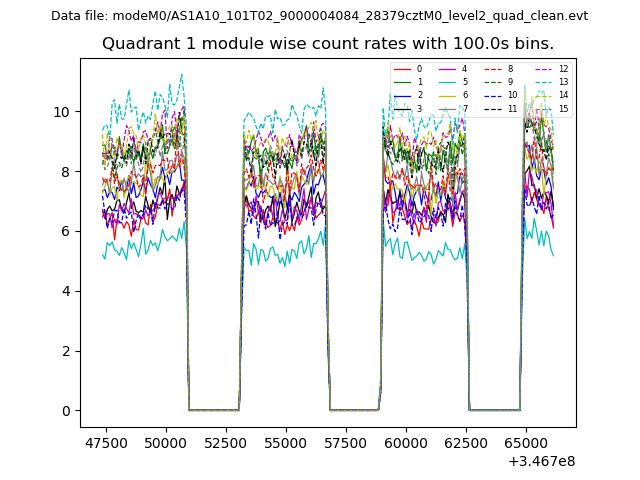
| Module-wise count rates for Quadrant A Data is divided into 100 sec bins |
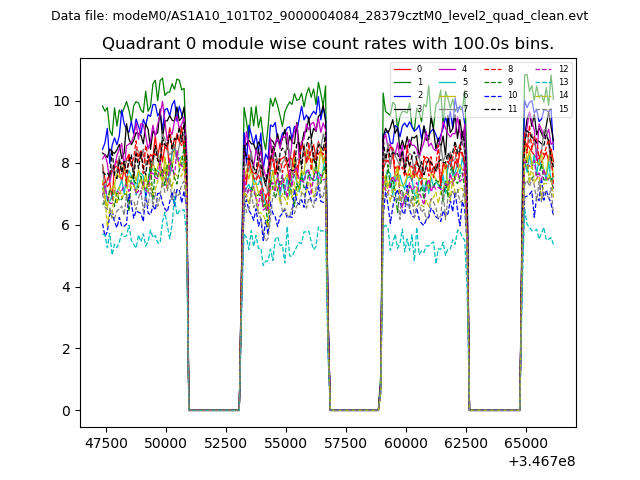 |
 |
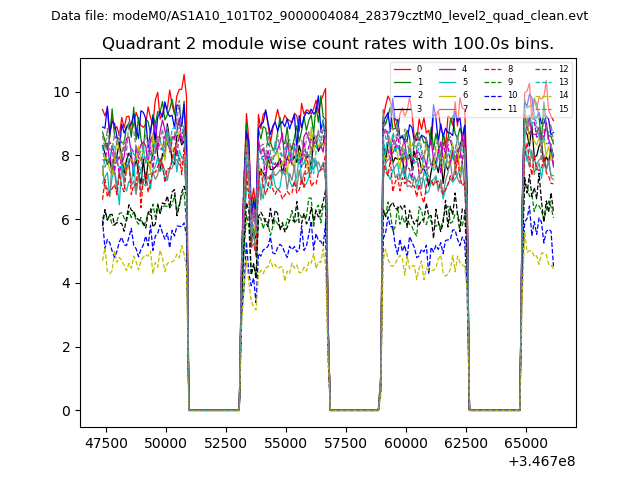
| Module-wise count rates for Quadrant B Data is divided into 100 sec bins |
 |
 |
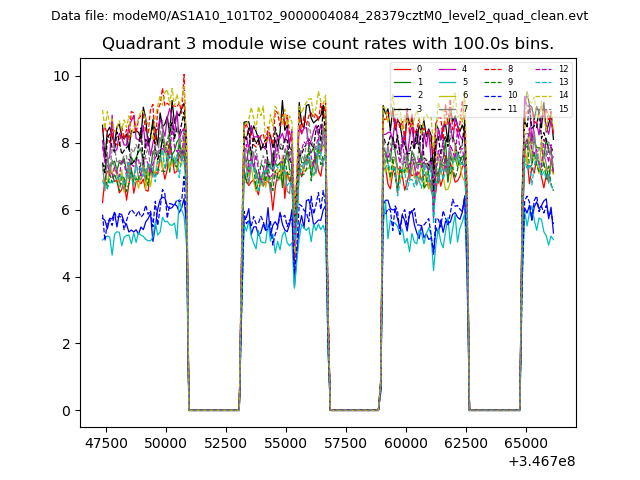
| Module-wise count rates for Quadrant C Data is divided into 100 sec bins |
 |
 |
| Module-wise count rates for Quadrant D Data is divided into 100 sec bins |
 |
 |
| Parameter | Plot |
|---|---|
| CZT HV Monitor | 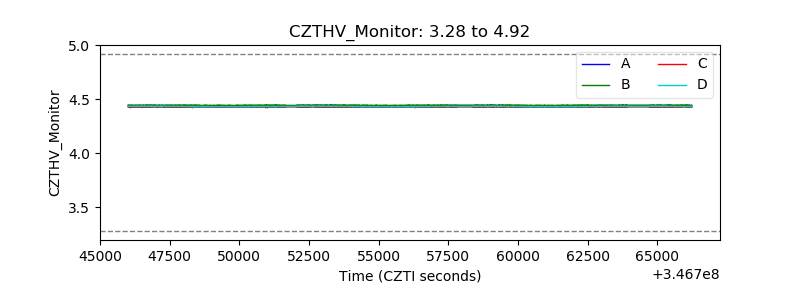 |
| D_VDD | 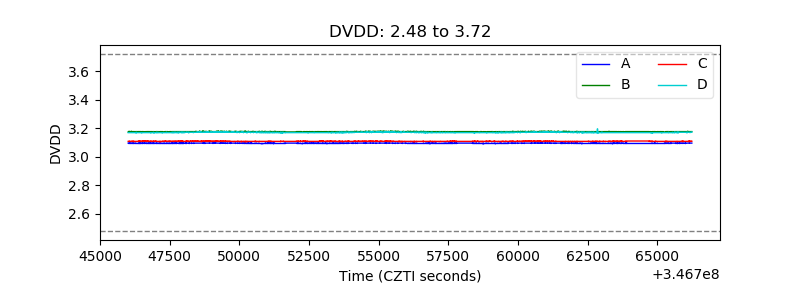 |
| Temperature 1 | 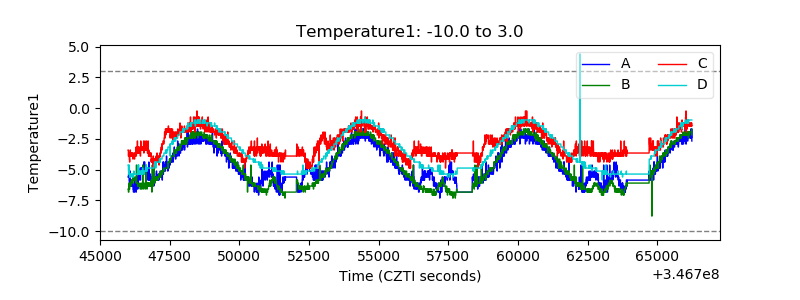 |
| Veto HV Monitor | 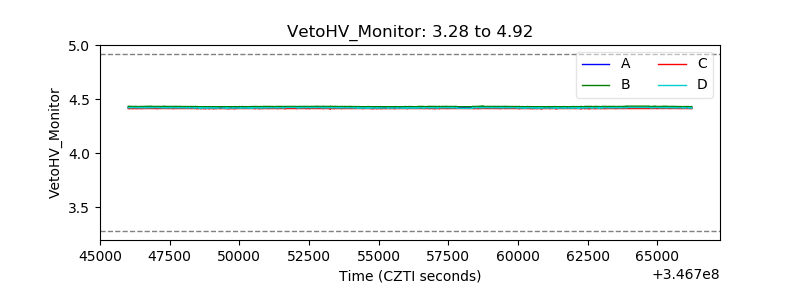 |
| Veto LLD | 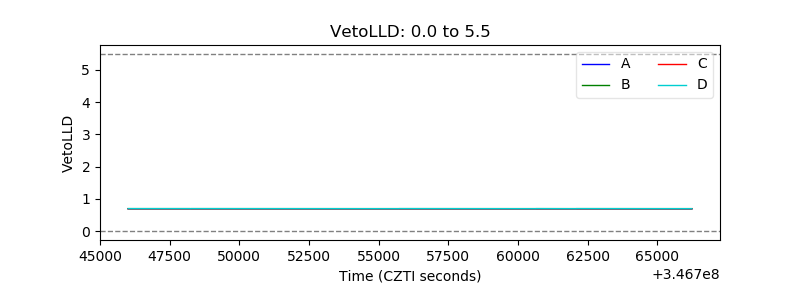 |
| Alpha Counter | 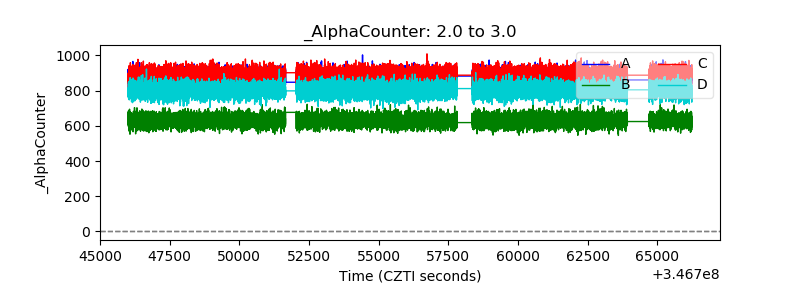 |
| _CPM_Rate | 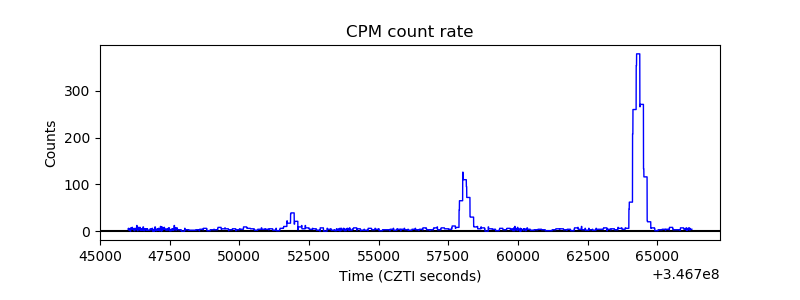 |
| CZT Counter | 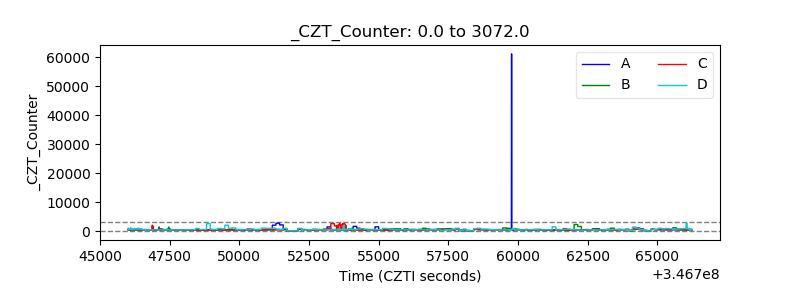 |
| +2.5 Volts monitor | 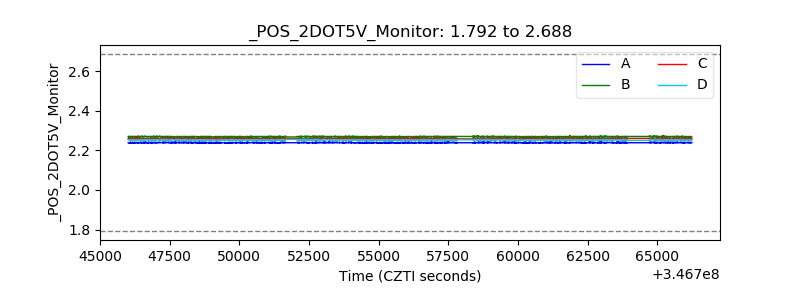 |
| +5 Volts monitor | 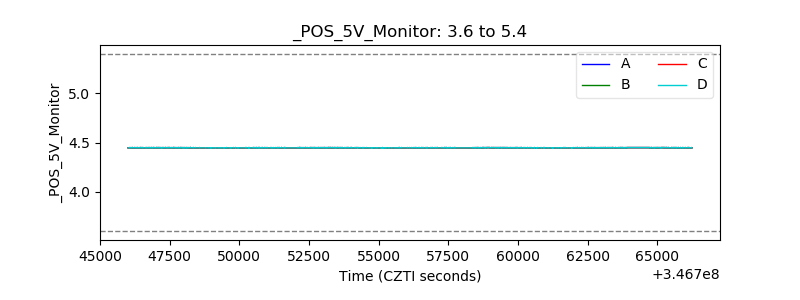 |
| _ROLL_ROT | 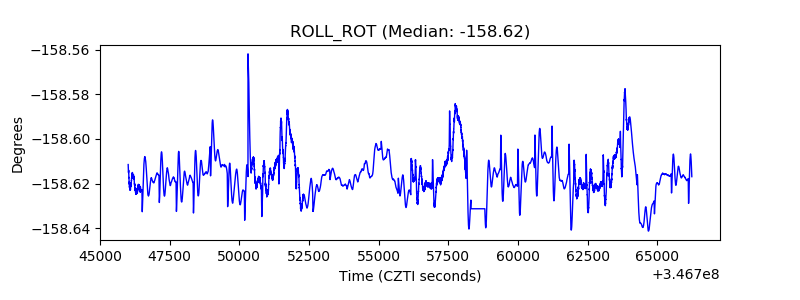 |
| _Roll_DEC | 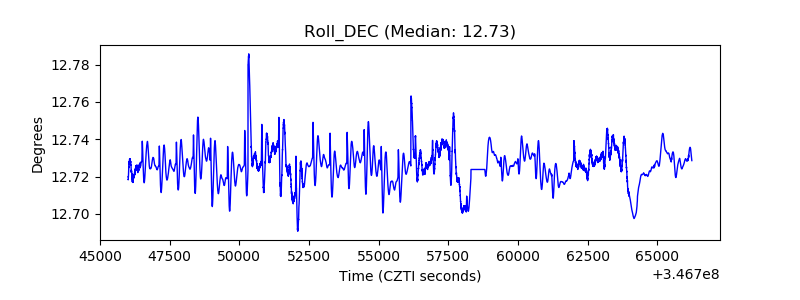 |
| _Roll_RA | 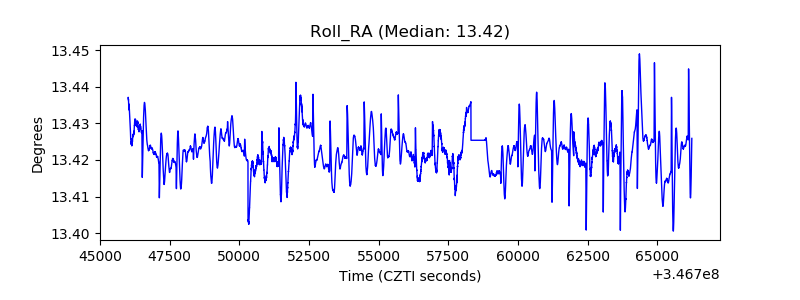 |
| Veto Counter | 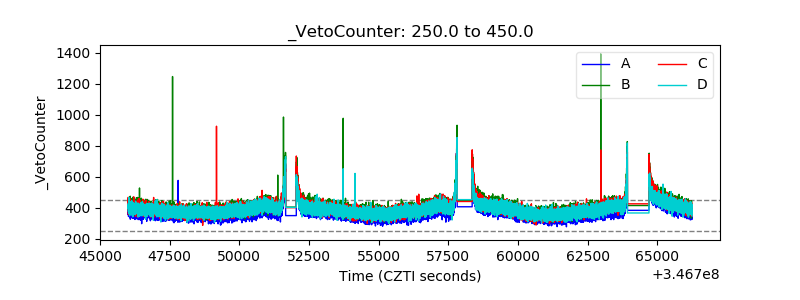 |