| Param | Original file | Final file |
|---|---|---|
| Filename | modeM0/AS1A10_101T02_9000004084_28380cztM0_level2.evt | modeM0/AS1A10_101T02_9000004084_28380cztM0_level2_quad_clean.evt |
| Size (bytes) | 167,984,640 | 41,564,160 |
| Size | 160.2 MB | 39.6 MB |
| Events in quadrant A | 1,040,168 | 281,617 |
| Events in quadrant B | 1,098,596 | 283,791 |
| Events in quadrant C | 1,001,204 | 269,520 |
| Events in quadrant D | 1,792,920 | 261,667 |
| Mode M0 | |||
|---|---|---|---|
| Quadrant | BADHDUFLAG | Total packets | Discarded packets |
| A | 0 | 4588 | 0 |
| B | 0 | 4727 | 0 |
| C | 0 | 4526 | 0 |
| D | 0 | 6945 | 0 |
| Quadrant | Total seconds | Saturated seconds | Saturation percentage |
|---|---|---|---|
| A | 2242 | 10 | 0.446030% |
| B | 2242 | 3 | 0.133809% |
| C | 2242 | 7 | 0.312221% |
| D | 2242 | 56 | 2.497770% |
Noise dominated data is calculated using 1-second bins in cleaned event files. If a bin has >2000 counts, and if more than 50% of those come from <1% of pixels, then it is considered to be noise-dominated and hence unusable.
| Quadrant | # 1 sec bins | Bins with >0 counts | Bins with >2000 counts | High rate bins dominated by noise | Noise dominated (total time) | Noise dominated (detector-on time) | Marked lightcurve |
|---|---|---|---|---|---|---|---|
| A | 2242 | 2242 | 6 | 6 | 0.27% | 0.27% | 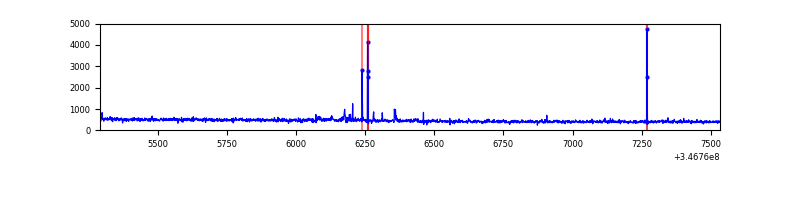 |
| B | 2242 | 2242 | 1 | 1 | 0.04% | 0.04% | 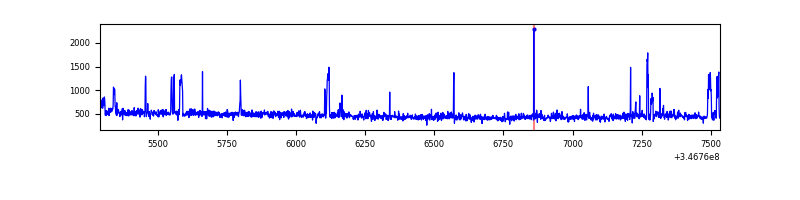 |
| C | 2242 | 2242 | 0 | 0 | 0.00% | 0.00% | 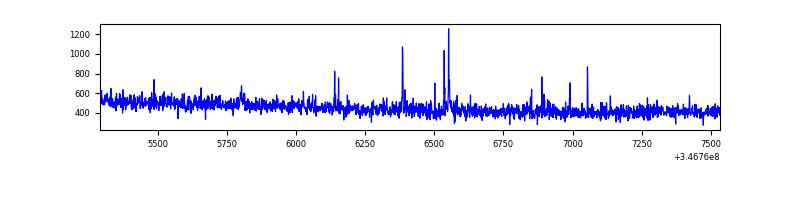 |
| D | 2242 | 2242 | 47 | 47 | 2.10% | 2.10% | 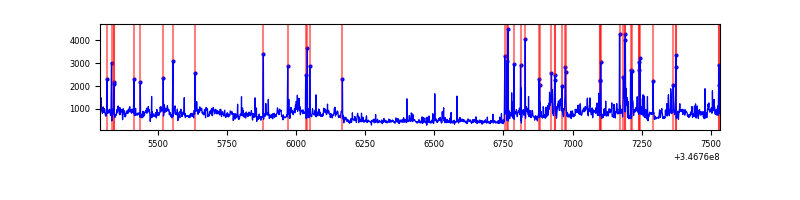 |
Top three noisy pixels from each quadrant. If the there are fewer than three noisy pixels in the level2.evt file, extra rows are filled as -1
| Pixel properties | Quadrant properties | ||||||
|---|---|---|---|---|---|---|---|
| Quadrant | DetID | PixID | Counts | Sigma | Mean | Median | Sigma |
| A | 15 | 174 | 28358 | 524.55 | 259 | 254 | 53.6 |
| A | 12 | 96 | 8109 | 146.61 | 259 | 254 | 53.6 |
| A | 13 | 254 | 3952 | 69.02 | 259 | 254 | 53.6 |
| B | 10 | 245 | 81120 | 1607.7 | 252 | 247 | 50.3 |
| B | 4 | 200 | 9907 | 192.03 | 252 | 247 | 50.3 |
| B | 0 | 230 | 9302 | 180.01 | 252 | 247 | 50.3 |
| C | 14 | 238 | 38509 | 661.97 | 242 | 244 | 57.8 |
| C | 7 | 220 | 15257 | 259.72 | 242 | 244 | 57.8 |
| C | 0 | 207 | 1816 | 27.2 | 242 | 244 | 57.8 |
| D | 8 | 195 | 692212 | 11485.76 | 247 | 241 | 60.2 |
| D | 2 | 250 | 81757 | 1353.05 | 247 | 241 | 60.2 |
| D | 1 | 52 | 65762 | 1087.56 | 247 | 241 | 60.2 |
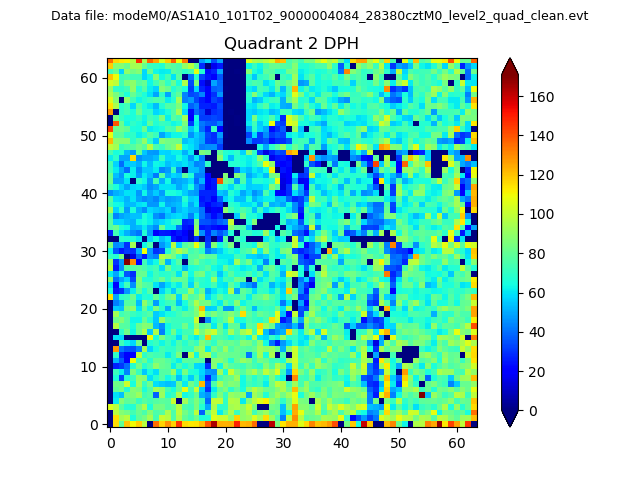
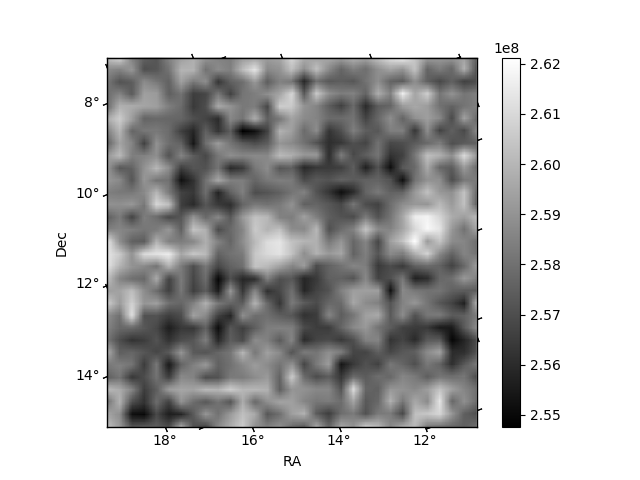
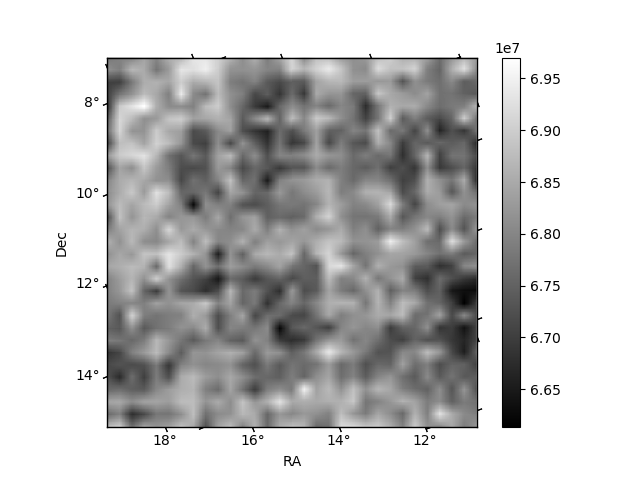
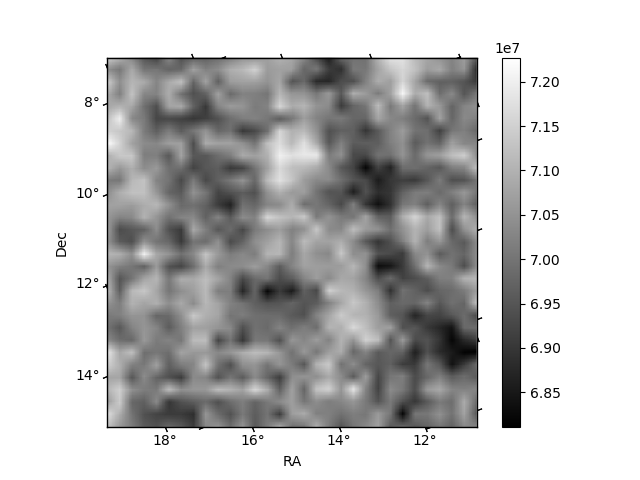
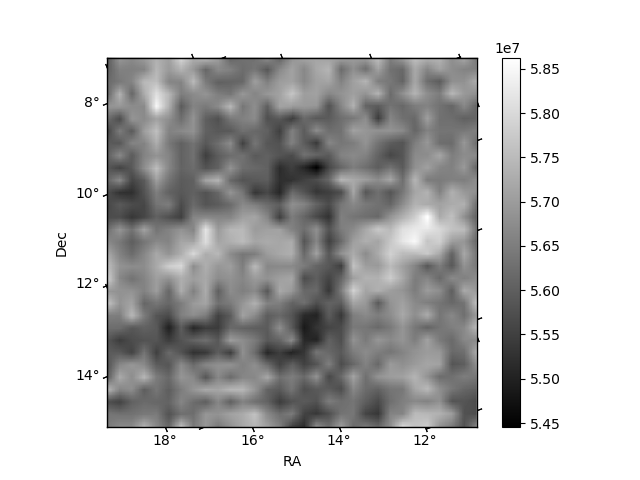
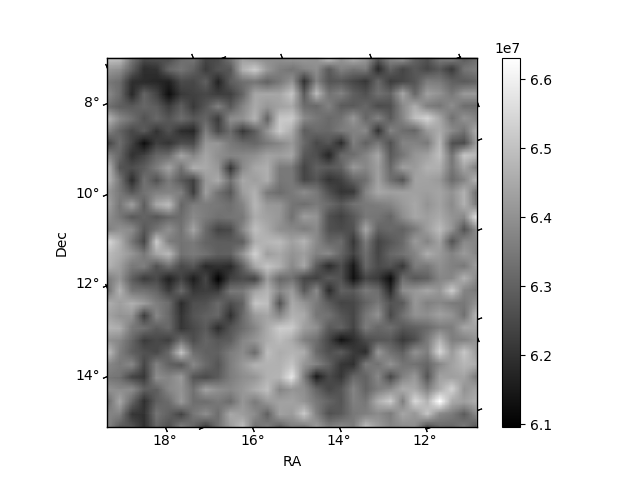
Histogram calculated using DETX and DETY for each event in the final _common_clean file
| Quadrant A | 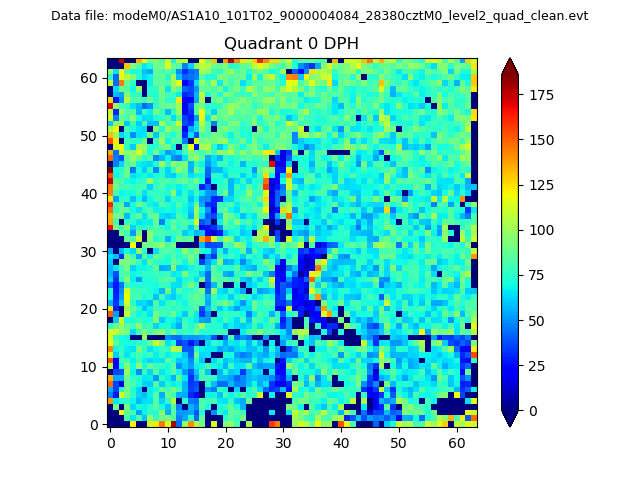 |
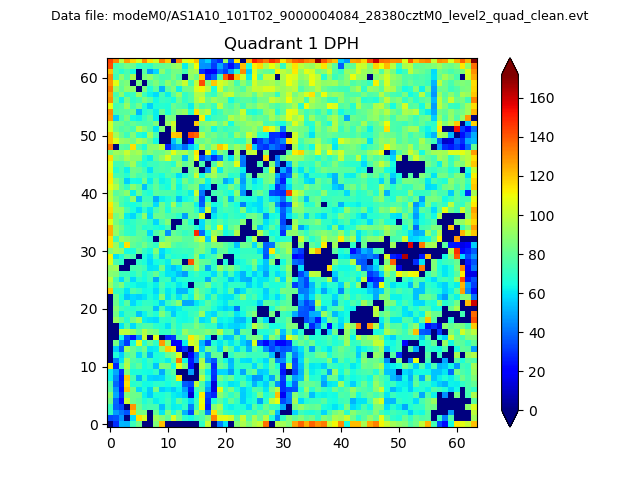 |
Quadrant B |
|---|---|---|---|
| Quadrant D | 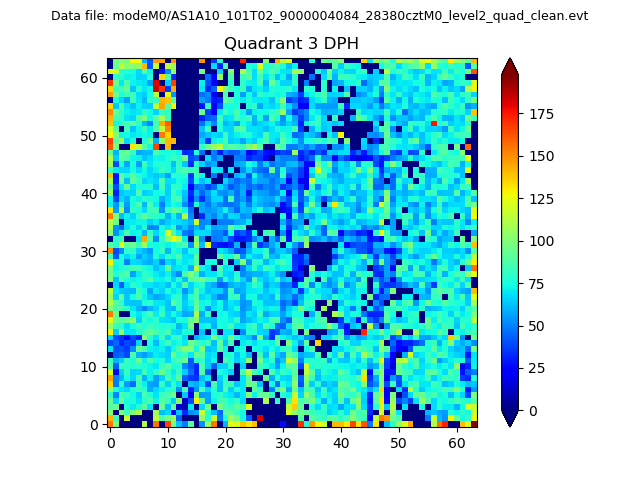 |
 |
Quadrant C |
| Plot type | Count rate plots | Images |
|---|---|---|
| Comparison with Poisson distribution Blue bars denote a histogram of data divided into 1 sec bins. Red curve is a Poisson curve with rate = median count rate of data. |
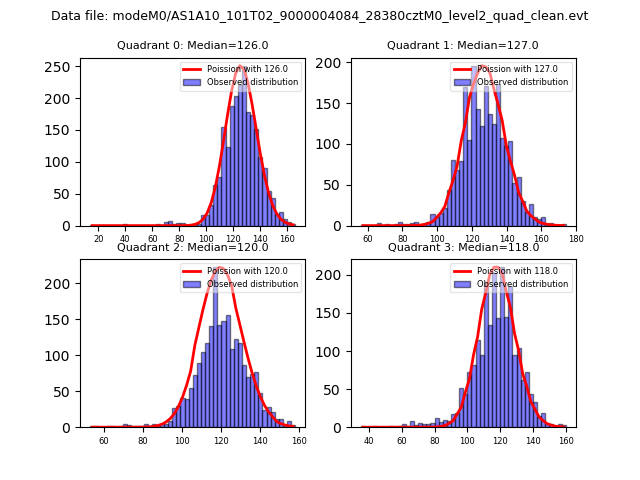 |
 |
| Quadrant-wise count rates Data is divided into 100 sec bins |
 |
|
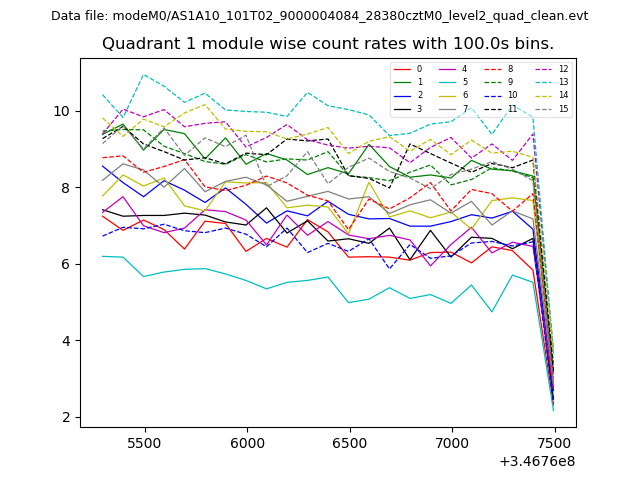
| Module-wise count rates for Quadrant A Data is divided into 100 sec bins |
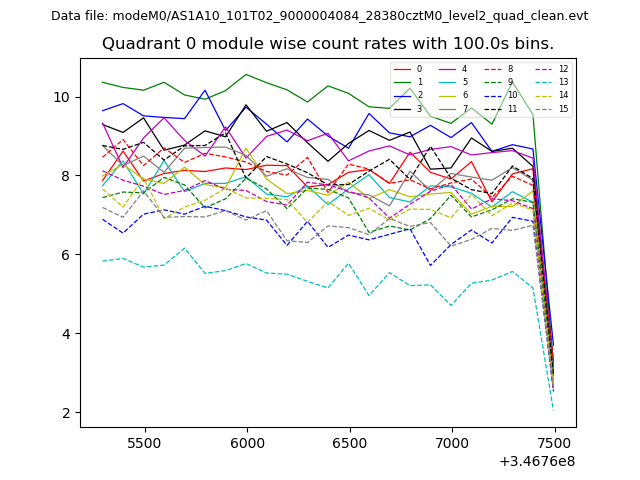 |
 |
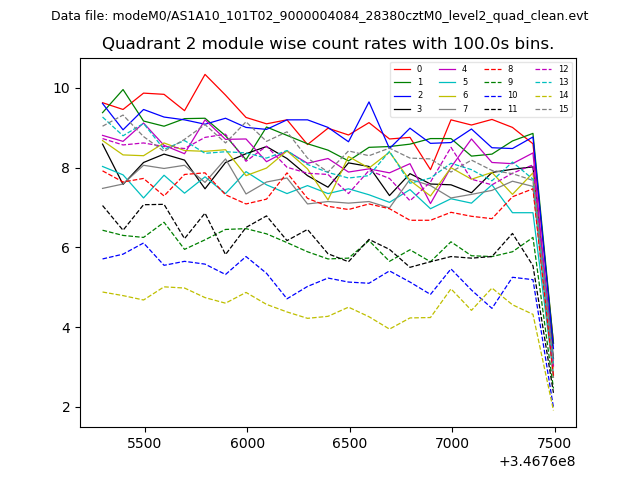
| Module-wise count rates for Quadrant B Data is divided into 100 sec bins |
 |
 |
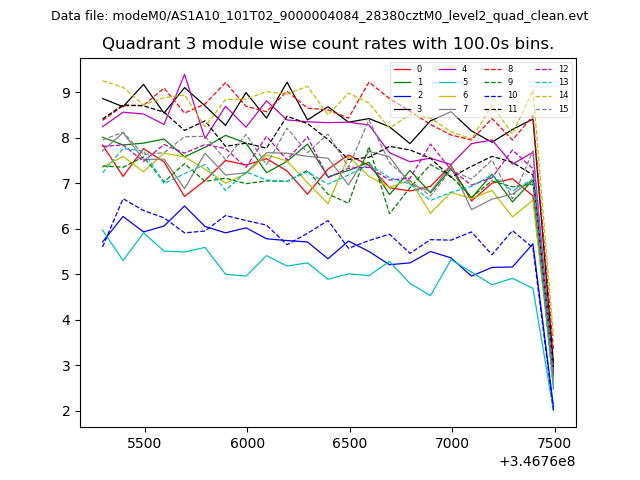
| Module-wise count rates for Quadrant C Data is divided into 100 sec bins |
 |
 |
| Module-wise count rates for Quadrant D Data is divided into 100 sec bins |
 |
 |
| Parameter | Plot |
|---|---|
| CZT HV Monitor |  |
| D_VDD | 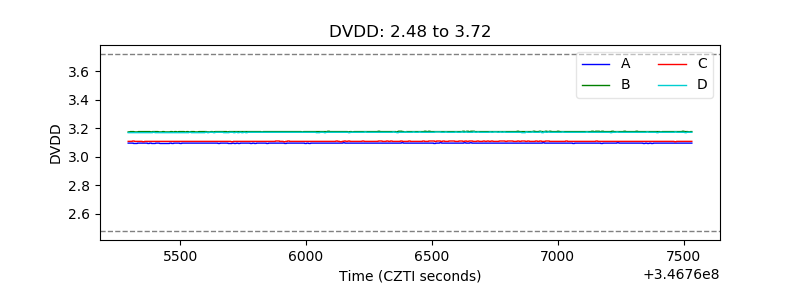 |
| Temperature 1 | 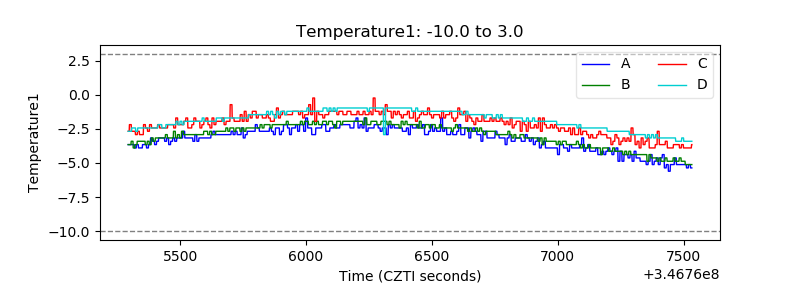 |
| Veto HV Monitor | 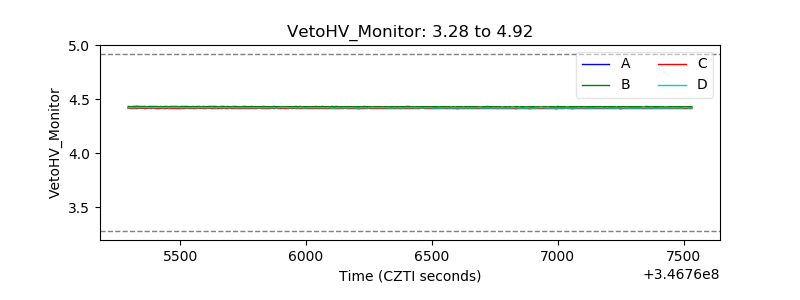 |
| Veto LLD | 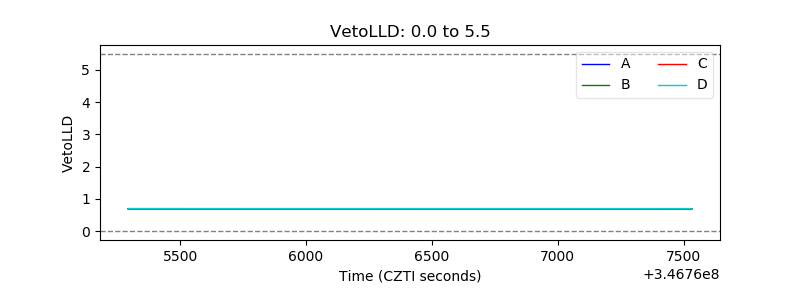 |
| Alpha Counter | 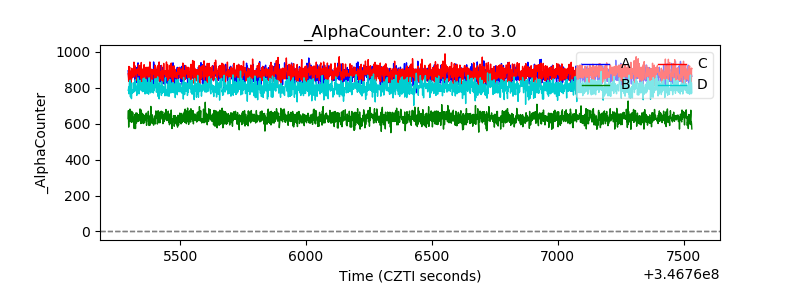 |
| _CPM_Rate | 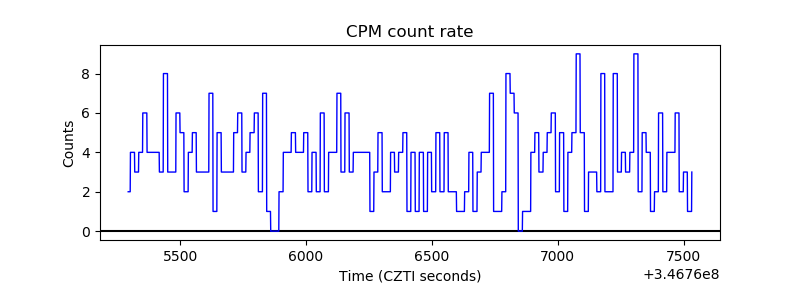 |
| CZT Counter | 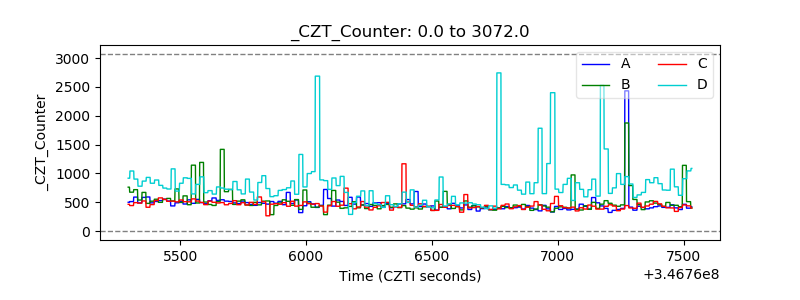 |
| +2.5 Volts monitor | 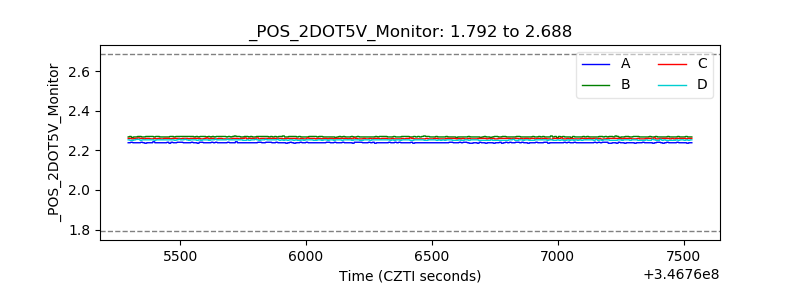 |
| +5 Volts monitor |  |
| _ROLL_ROT | 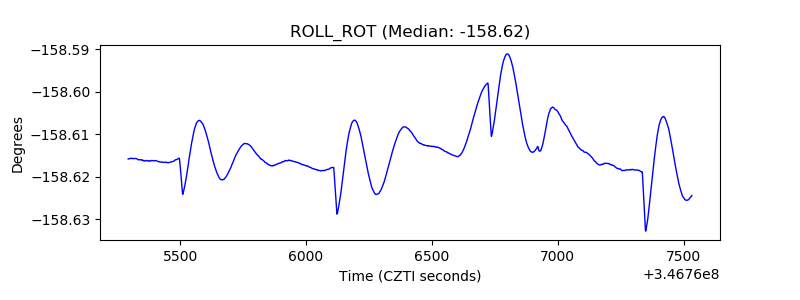 |
| _Roll_DEC | 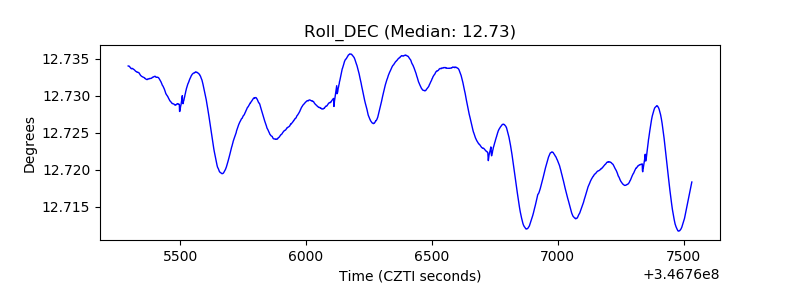 |
| _Roll_RA | 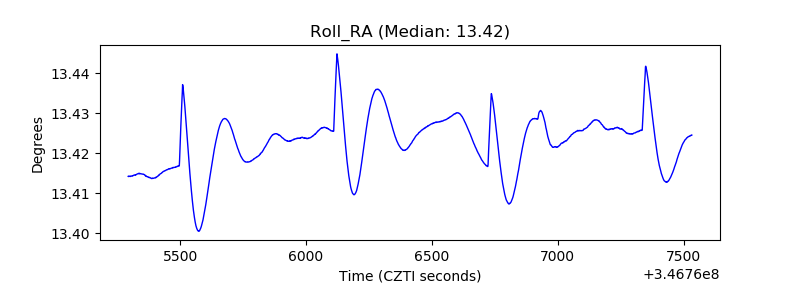 |
| Veto Counter | 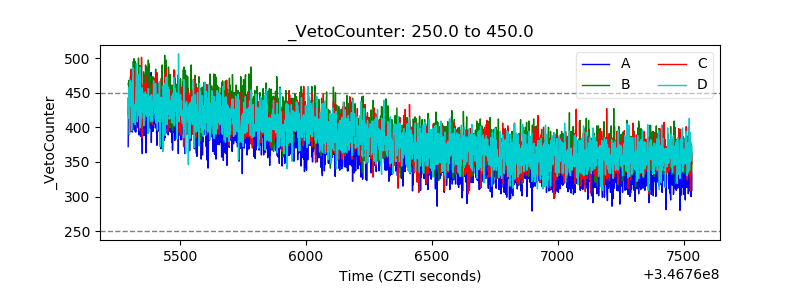 |