| Param | Original file | Final file |
|---|---|---|
| Filename | modeM0/AS1A10_045T05_9000004086_28382cztM0_level2.evt | modeM0/AS1A10_045T05_9000004086_28382cztM0_level2_quad_clean.evt |
| Size (bytes) | 548,979,840 | 67,481,280 |
| Size | 523.5 MB | 64.4 MB |
| Events in quadrant A | 3,442,762 | 400,117 |
| Events in quadrant B | 3,990,923 | 408,047 |
| Events in quadrant C | 3,417,497 | 392,303 |
| Events in quadrant D | 5,325,165 | 379,765 |
| Mode M0 | |||
|---|---|---|---|
| Quadrant | BADHDUFLAG | Total packets | Discarded packets |
| A | 0 | 14523 | 0 |
| B | 0 | 16290 | 0 |
| C | 0 | 14388 | 0 |
| D | 0 | 20320 | 0 |
| Mode M9 | |||
|---|---|---|---|
| Quadrant | BADHDUFLAG | Total packets | Discarded packets |
| A | 0 | 12 | 0 |
| B | 0 | 13 | 0 |
| C | 0 | 13 | 0 |
| D | 0 | 13 | 0 |
| Quadrant | Total seconds | Saturated seconds | Saturation percentage |
|---|---|---|---|
| A | 6642 | 72 | 1.084011% |
| B | 6642 | 68 | 1.023788% |
| C | 6642 | 102 | 1.535682% |
| D | 6641 | 174 | 2.620087% |
Noise dominated data is calculated using 1-second bins in cleaned event files. If a bin has >2000 counts, and if more than 50% of those come from <1% of pixels, then it is considered to be noise-dominated and hence unusable.
| Quadrant | # 1 sec bins | Bins with >0 counts | Bins with >2000 counts | High rate bins dominated by noise | Noise dominated (total time) | Noise dominated (detector-on time) | Marked lightcurve |
|---|---|---|---|---|---|---|---|
| A | 7727 | 6642 | 1 | 1 | 0.01% | 0.02% | 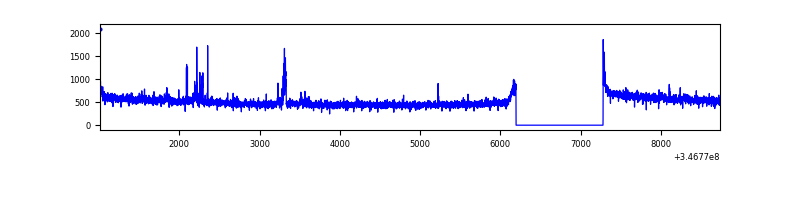 |
| B | 7727 | 6642 | 0 | 0 | 0.00% | 0.00% | 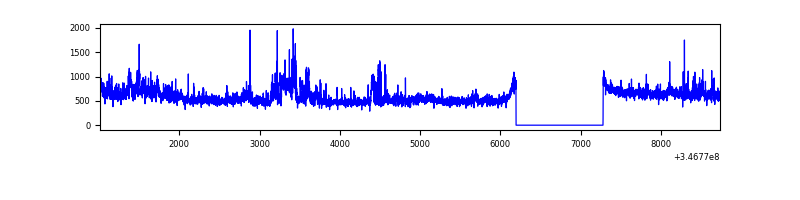 |
| C | 7727 | 6642 | 0 | 0 | 0.00% | 0.00% | 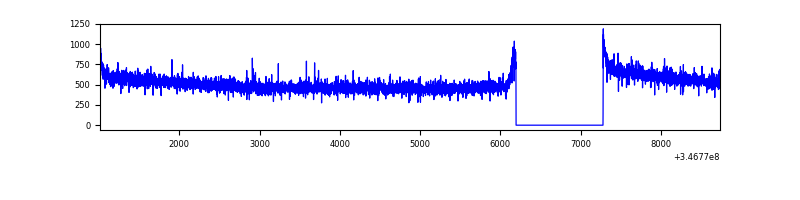 |
| D | 7726 | 6641 | 93 | 93 | 1.20% | 1.40% | 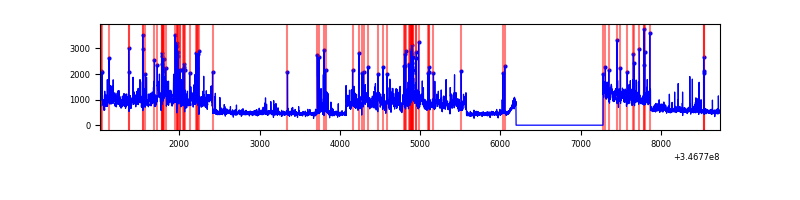 |
Top three noisy pixels from each quadrant. If the there are fewer than three noisy pixels in the level2.evt file, extra rows are filled as -1
| Pixel properties | Quadrant properties | ||||||
|---|---|---|---|---|---|---|---|
| Quadrant | DetID | PixID | Counts | Sigma | Mean | Median | Sigma |
| A | 15 | 174 | 74893 | 423.15 | 870 | 853 | 175.0 |
| A | 13 | 254 | 10629 | 55.87 | 870 | 853 | 175.0 |
| A | 3 | 137 | 8251 | 42.28 | 870 | 853 | 175.0 |
| B | 10 | 245 | 539303 | 3301.18 | 861 | 839 | 163.1 |
| B | 0 | 230 | 75565 | 458.13 | 861 | 839 | 163.1 |
| B | 12 | 111 | 19900 | 116.86 | 861 | 839 | 163.1 |
| C | 14 | 238 | 135923 | 694.16 | 839 | 845 | 194.6 |
| C | 7 | 220 | 7792 | 35.7 | 839 | 845 | 194.6 |
| C | 13 | 61 | 5756 | 25.24 | 839 | 845 | 194.6 |
| D | 8 | 195 | 1735419 | 8574.13 | 846 | 825 | 202.3 |
| D | 1 | 52 | 187941 | 924.92 | 846 | 825 | 202.3 |
| D | 2 | 250 | 180402 | 887.65 | 846 | 825 | 202.3 |
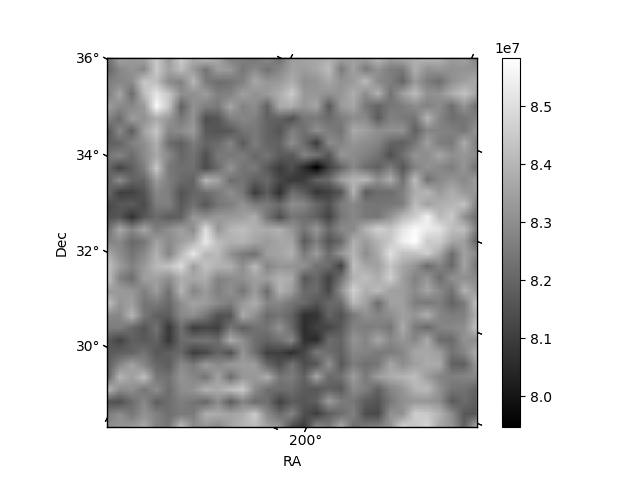
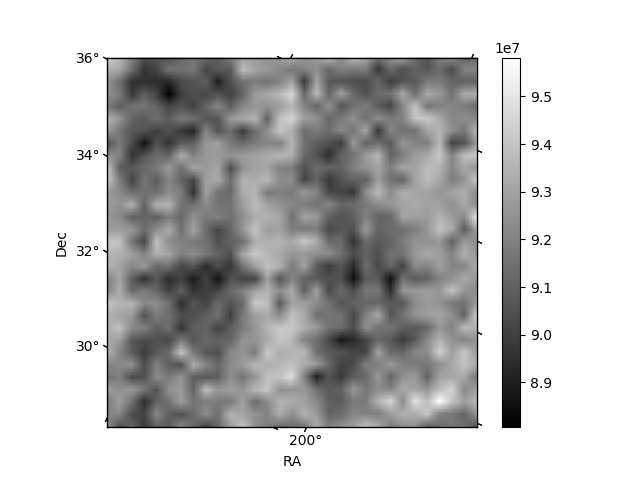
Histogram calculated using DETX and DETY for each event in the final _common_clean file
| Quadrant A | 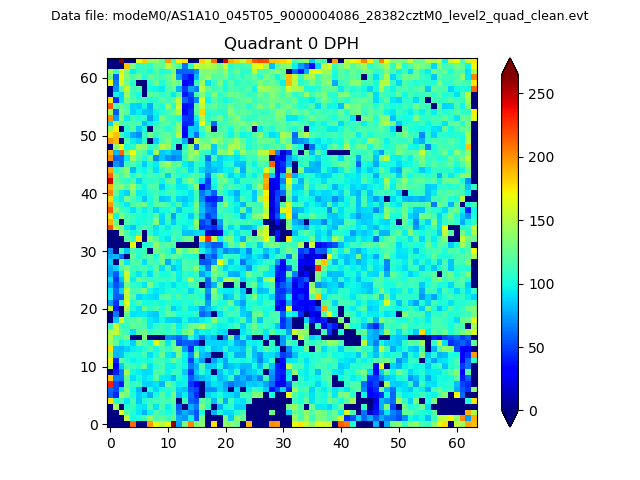 |
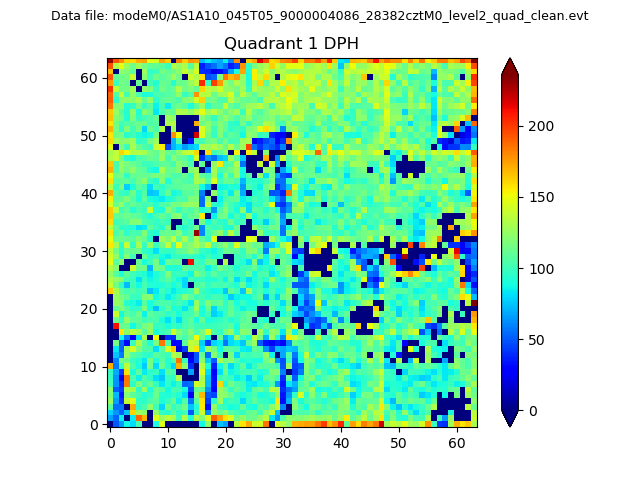 |
Quadrant B |
|---|---|---|---|
| Quadrant D | 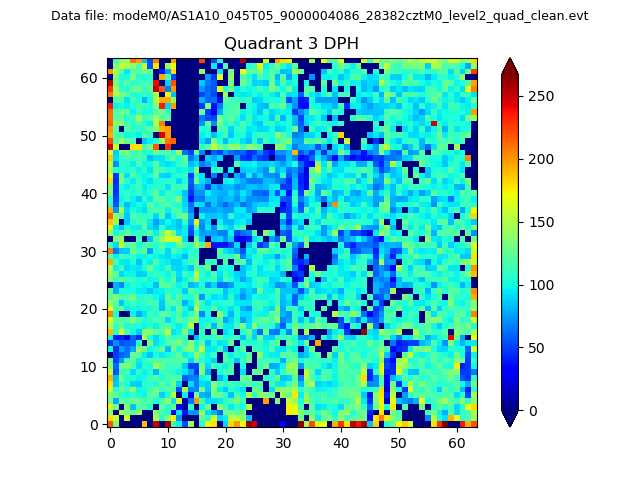 |
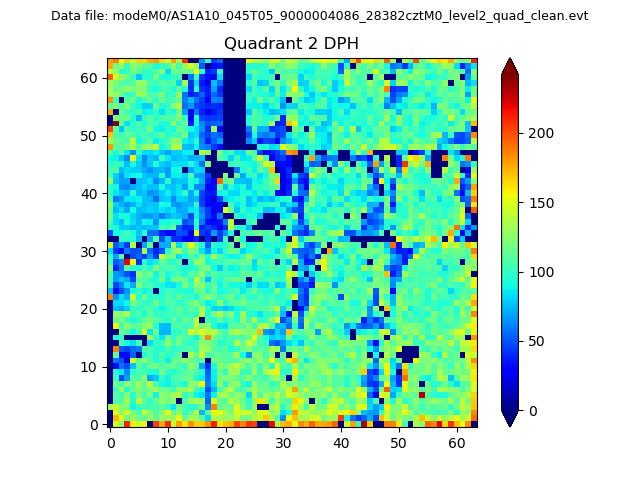 |
Quadrant C |
| Plot type | Count rate plots | Images |
|---|---|---|
| Comparison with Poisson distribution Blue bars denote a histogram of data divided into 1 sec bins. Red curve is a Poisson curve with rate = median count rate of data. |
 |
 |
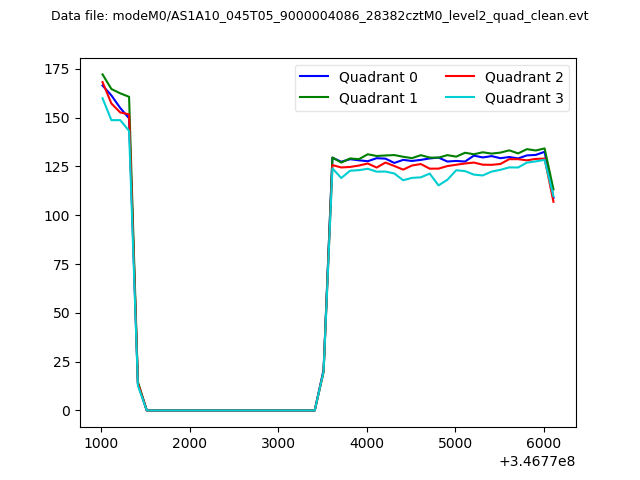
| Quadrant-wise count rates Data is divided into 100 sec bins |
 |
|
| Module-wise count rates for Quadrant A Data is divided into 100 sec bins |
 |
 |
| Module-wise count rates for Quadrant B Data is divided into 100 sec bins |
 |
 |
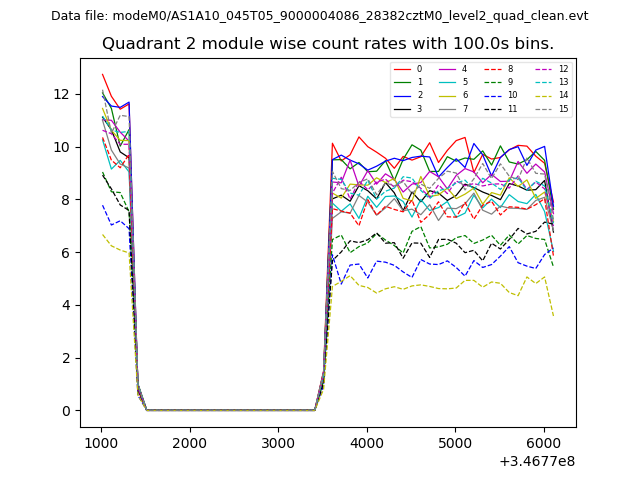
| Module-wise count rates for Quadrant C Data is divided into 100 sec bins |
 |
 |
| Module-wise count rates for Quadrant D Data is divided into 100 sec bins |
 |
 |
| Parameter | Plot |
|---|---|
| CZT HV Monitor |  |
| D_VDD | 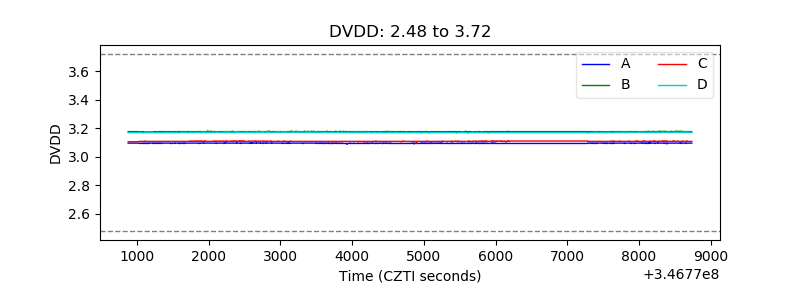 |
| Temperature 1 | 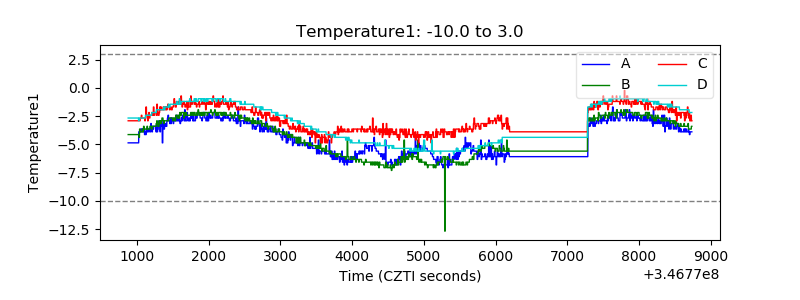 |
| Veto HV Monitor |  |
| Veto LLD | 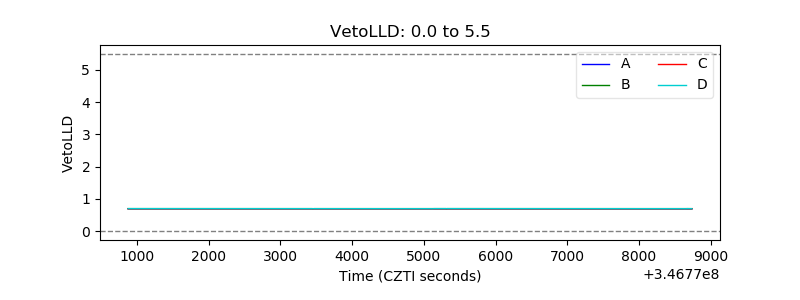 |
| Alpha Counter | 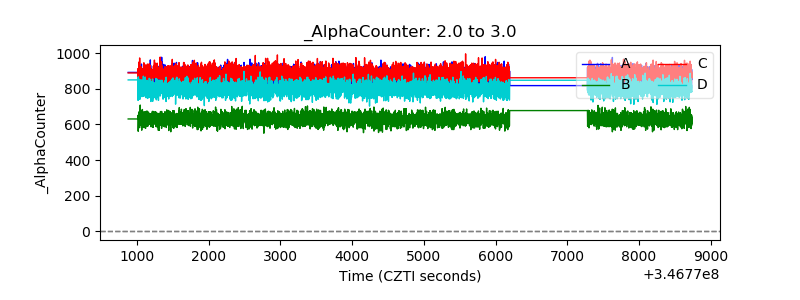 |
| _CPM_Rate | 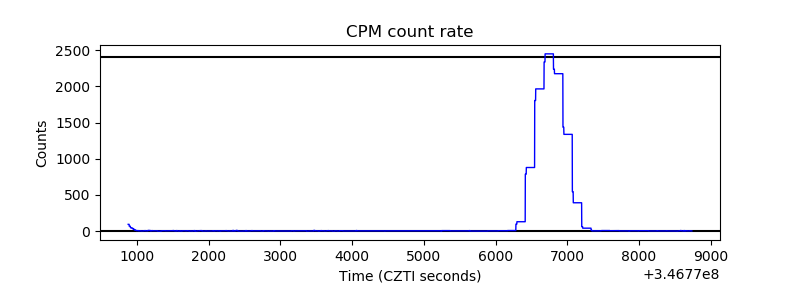 |
| CZT Counter |  |
| +2.5 Volts monitor | 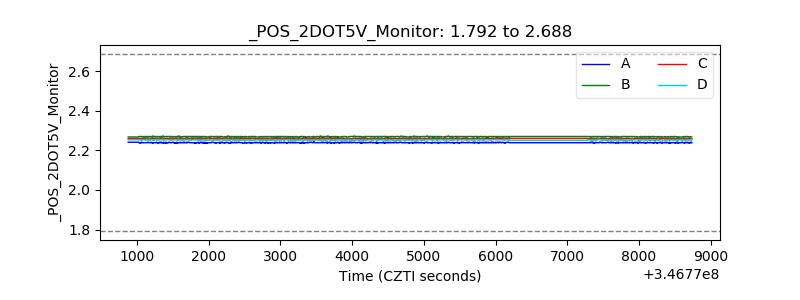 |
| +5 Volts monitor |  |
| _ROLL_ROT | 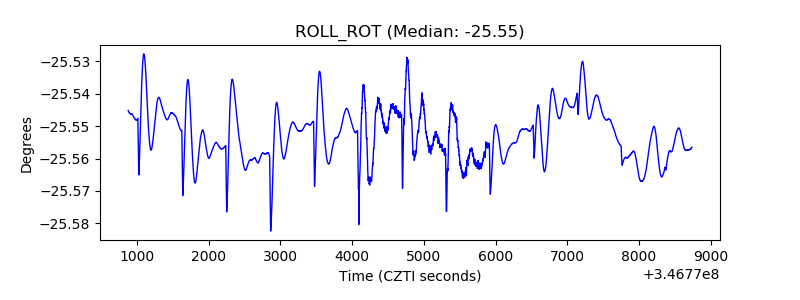 |
| _Roll_DEC | 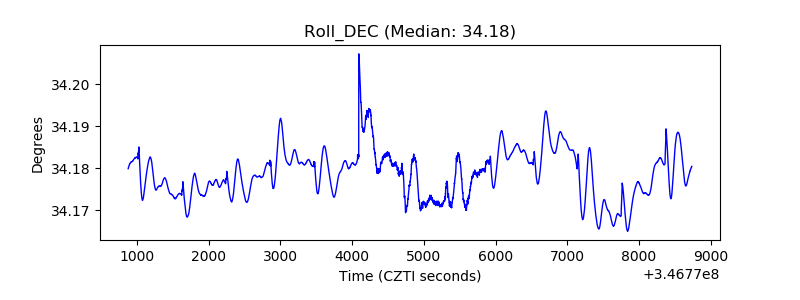 |
| _Roll_RA |  |
| Veto Counter | 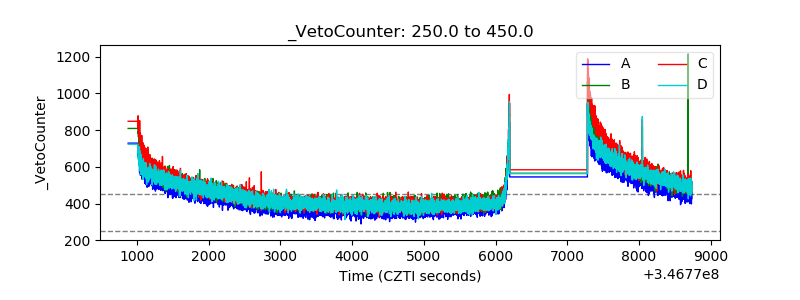 |