| Param | Original file | Final file |
|---|---|---|
| Filename | modeM0/AS1A10_045T05_9000004086_28384cztM0_level2.evt | modeM0/AS1A10_045T05_9000004086_28384cztM0_level2_quad_clean.evt |
| Size (bytes) | 491,872,320 | 73,990,080 |
| Size | 469.1 MB | 70.6 MB |
| Events in quadrant A | 3,230,092 | 459,919 |
| Events in quadrant B | 3,357,585 | 471,765 |
| Events in quadrant C | 3,307,831 | 457,268 |
| Events in quadrant D | 4,603,515 | 442,121 |
| Mode M0 | |||
|---|---|---|---|
| Quadrant | BADHDUFLAG | Total packets | Discarded packets |
| A | 0 | 13460 | 0 |
| B | 0 | 13788 | 0 |
| C | 0 | 13743 | 0 |
| D | 0 | 17707 | 0 |
| Mode M9 | |||
|---|---|---|---|
| Quadrant | BADHDUFLAG | Total packets | Discarded packets |
| A | 0 | 14 | 0 |
| B | 0 | 14 | 0 |
| C | 0 | 14 | 0 |
| D | 0 | 14 | 0 |
| Quadrant | Total seconds | Saturated seconds | Saturation percentage |
|---|---|---|---|
| A | 5865 | 82 | 1.398124% |
| B | 5865 | 73 | 1.244672% |
| C | 5866 | 127 | 2.165019% |
| D | 5865 | 339 | 5.780051% |
Noise dominated data is calculated using 1-second bins in cleaned event files. If a bin has >2000 counts, and if more than 50% of those come from <1% of pixels, then it is considered to be noise-dominated and hence unusable.
| Quadrant | # 1 sec bins | Bins with >0 counts | Bins with >2000 counts | High rate bins dominated by noise | Noise dominated (total time) | Noise dominated (detector-on time) | Marked lightcurve |
|---|---|---|---|---|---|---|---|
| A | 7170 | 5866 | 16 | 16 | 0.22% | 0.27% | 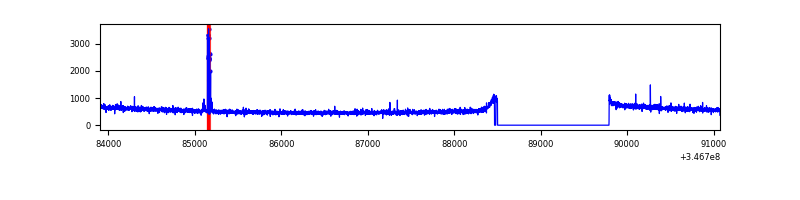 |
| B | 7170 | 5866 | 1 | 1 | 0.01% | 0.02% | 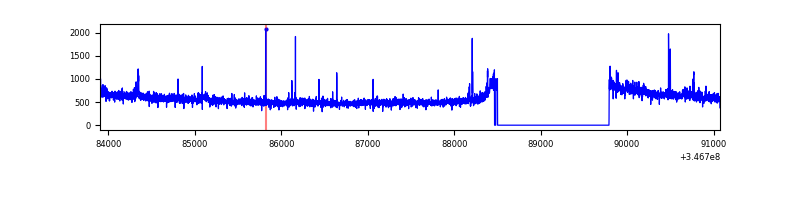 |
| C | 7171 | 5867 | 1 | 1 | 0.01% | 0.02% | 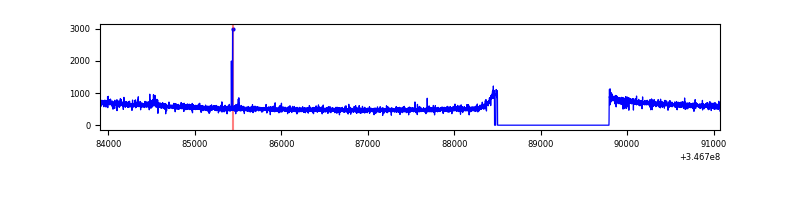 |
| D | 7170 | 5866 | 213 | 213 | 2.97% | 3.63% | 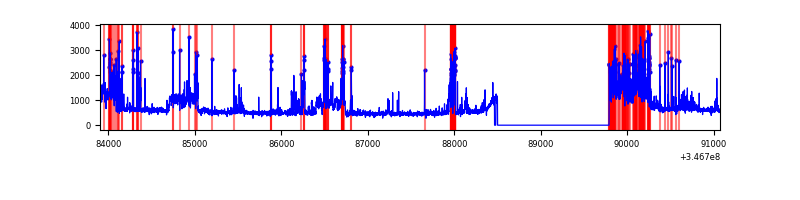 |
Top three noisy pixels from each quadrant. If the there are fewer than three noisy pixels in the level2.evt file, extra rows are filled as -1
| Pixel properties | Quadrant properties | ||||||
|---|---|---|---|---|---|---|---|
| Quadrant | DetID | PixID | Counts | Sigma | Mean | Median | Sigma |
| A | 15 | 174 | 66042 | 401.35 | 819 | 805 | 162.5 |
| A | 13 | 254 | 9202 | 51.66 | 819 | 805 | 162.5 |
| A | 3 | 137 | 7465 | 40.97 | 819 | 805 | 162.5 |
| B | 10 | 245 | 98935 | 640.4 | 820 | 800 | 153.2 |
| B | 0 | 230 | 50186 | 322.27 | 820 | 800 | 153.2 |
| B | 12 | 111 | 17781 | 110.81 | 820 | 800 | 153.2 |
| C | 14 | 238 | 131632 | 703.22 | 807 | 815 | 186.0 |
| C | 7 | 220 | 25723 | 133.9 | 807 | 815 | 186.0 |
| C | 9 | 221 | 6101 | 28.42 | 807 | 815 | 186.0 |
| D | 1 | 52 | 750922 | 3989.44 | 796 | 778 | 188.0 |
| D | 8 | 195 | 748103 | 3974.44 | 796 | 778 | 188.0 |
| D | 7 | 238 | 54271 | 284.49 | 796 | 778 | 188.0 |
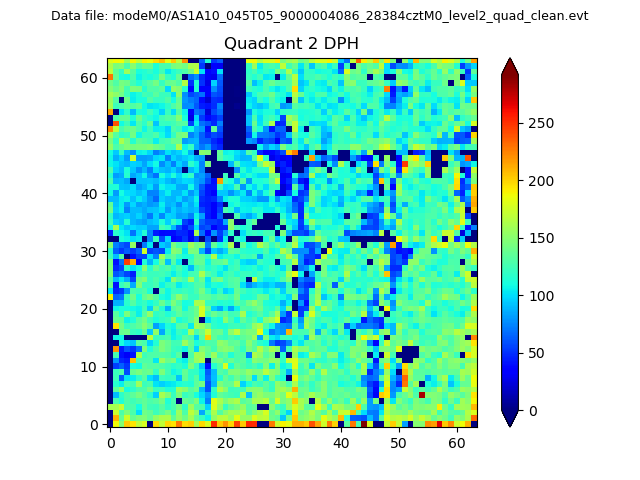
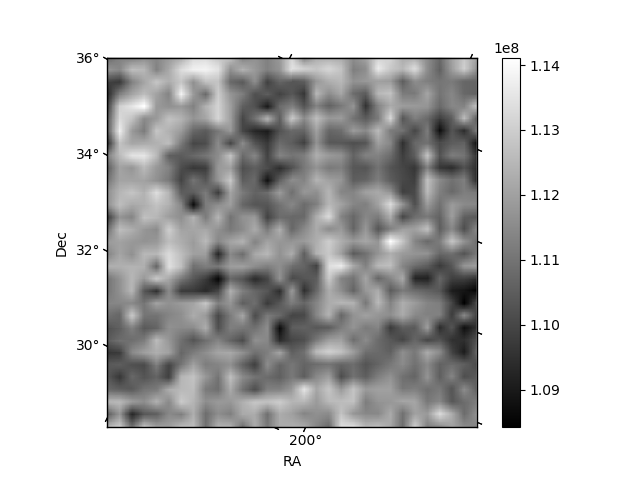
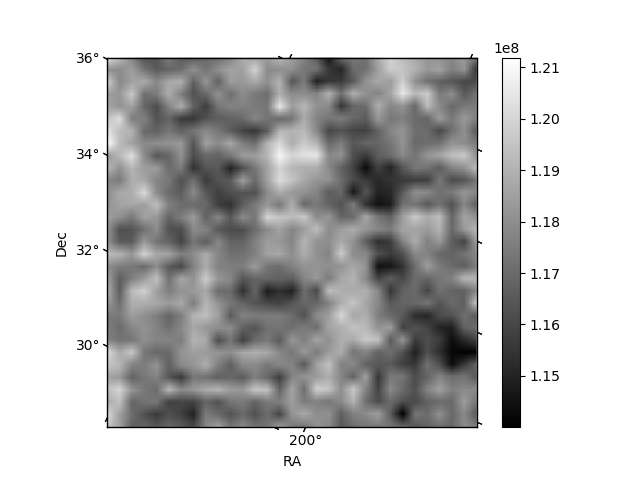
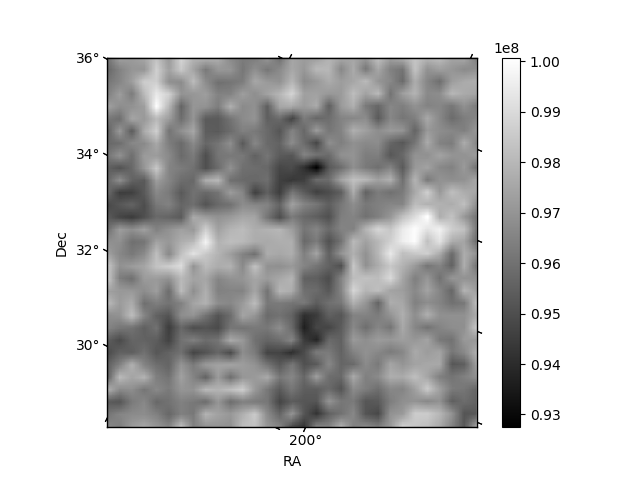
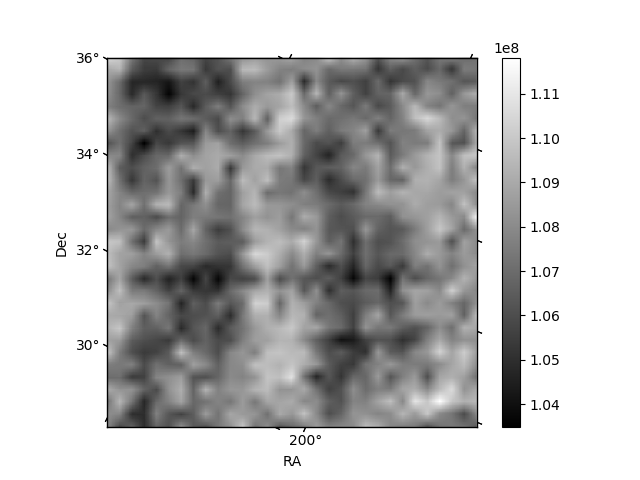
Histogram calculated using DETX and DETY for each event in the final _common_clean file
| Quadrant A | 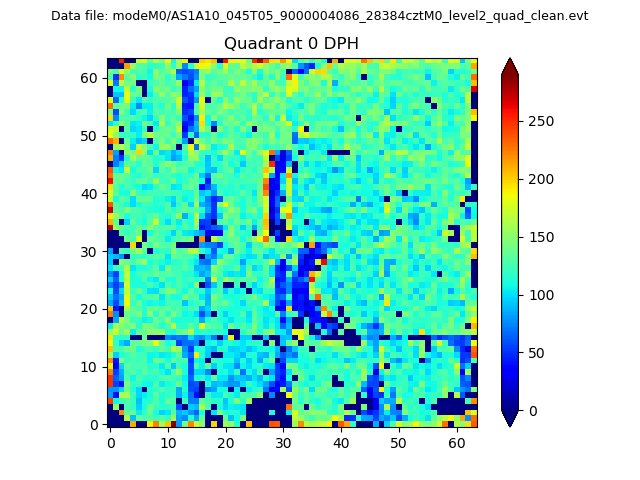 |
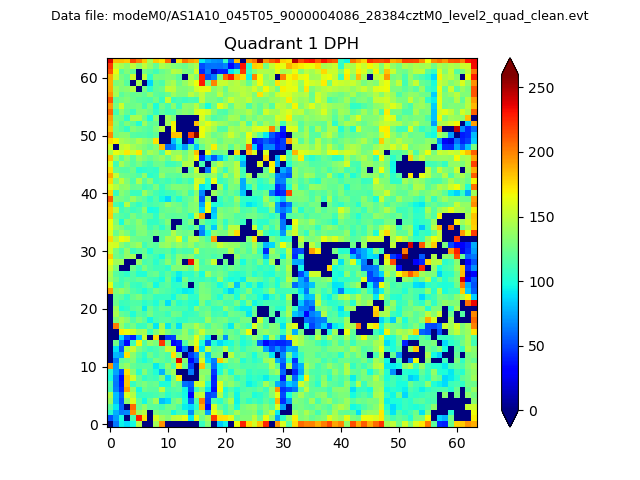 |
Quadrant B |
|---|---|---|---|
| Quadrant D | 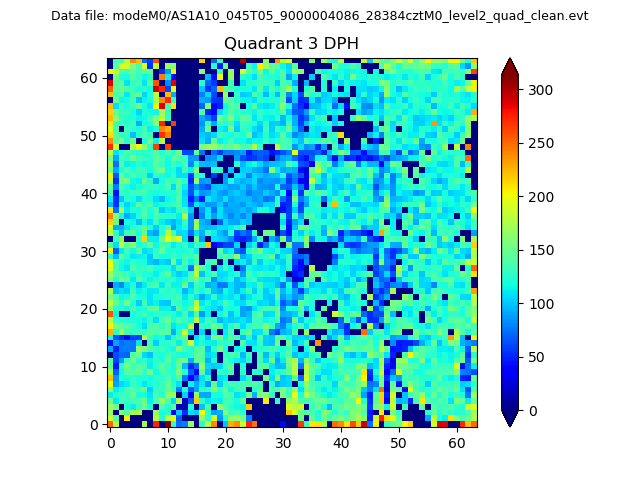 |
 |
Quadrant C |
| Plot type | Count rate plots | Images |
|---|---|---|
| Comparison with Poisson distribution Blue bars denote a histogram of data divided into 1 sec bins. Red curve is a Poisson curve with rate = median count rate of data. |
 |
 |
| Quadrant-wise count rates Data is divided into 100 sec bins |
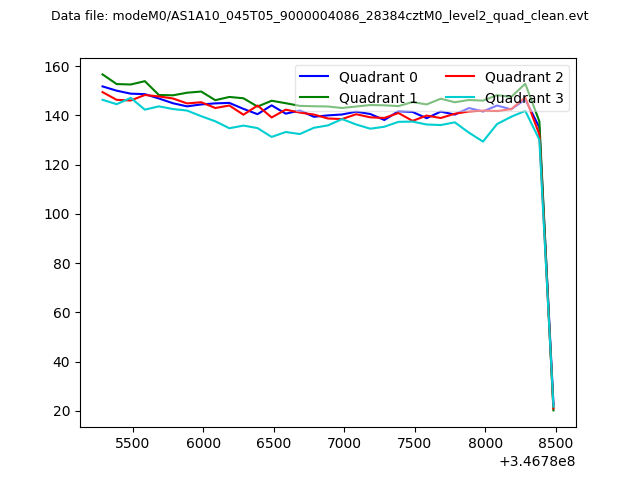 |
|
| Module-wise count rates for Quadrant A Data is divided into 100 sec bins |
 |
 |
| Module-wise count rates for Quadrant B Data is divided into 100 sec bins |
 |
 |
| Module-wise count rates for Quadrant C Data is divided into 100 sec bins |
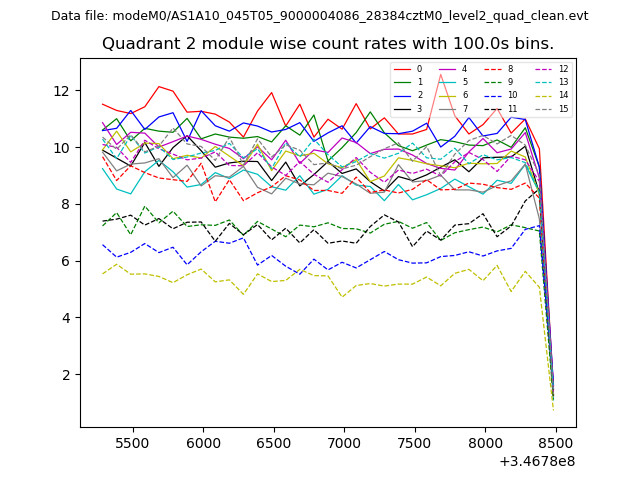 |
 |
| Module-wise count rates for Quadrant D Data is divided into 100 sec bins |
 |
 |
| Parameter | Plot |
|---|---|
| CZT HV Monitor | 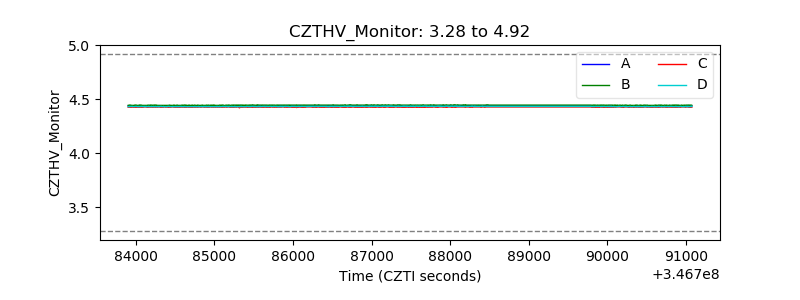 |
| D_VDD | 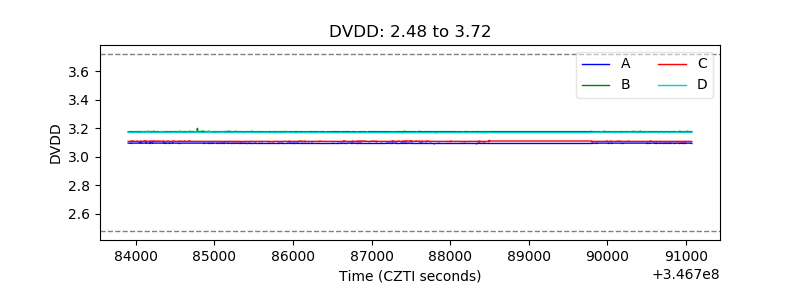 |
| Temperature 1 | 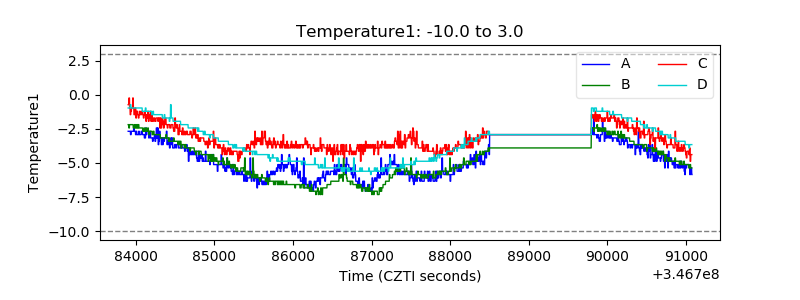 |
| Veto HV Monitor |  |
| Veto LLD | 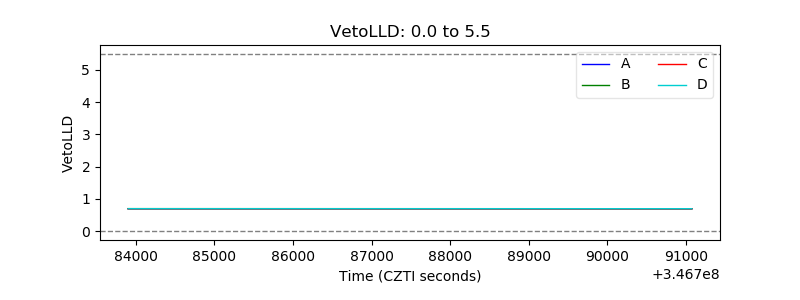 |
| Alpha Counter | 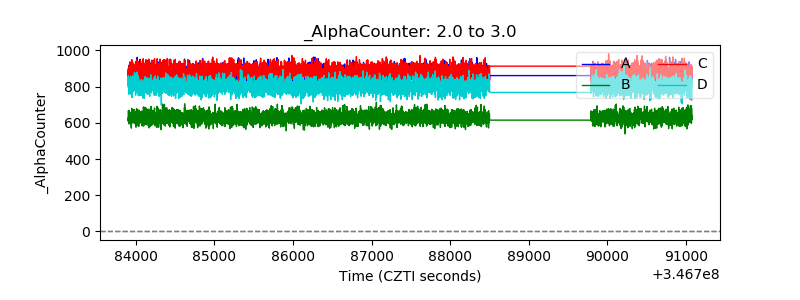 |
| _CPM_Rate | 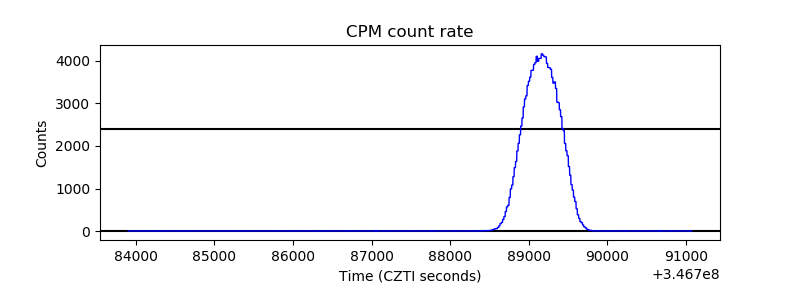 |
| CZT Counter |  |
| +2.5 Volts monitor |  |
| +5 Volts monitor |  |
| _ROLL_ROT | 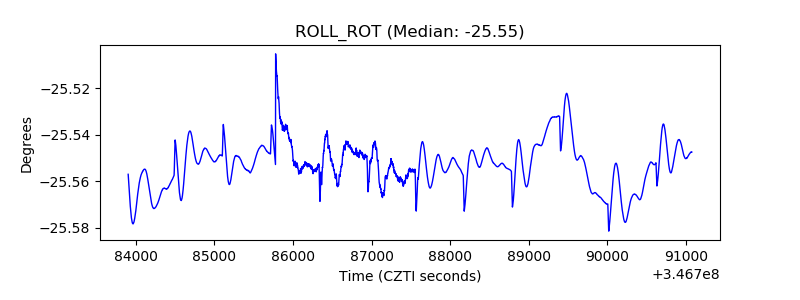 |
| _Roll_DEC |  |
| _Roll_RA |  |
| Veto Counter |  |