| Param | Original file | Final file |
|---|---|---|
| Filename | modeM0/AS1A10_045T05_9000004086_28387cztM0_level2.evt | modeM0/AS1A10_045T05_9000004086_28387cztM0_level2_quad_clean.evt |
| Size (bytes) | 1,336,340,160 | 267,042,240 |
| Size | 1.2 GB | 254.7 MB |
| Events in quadrant A | 8,122,988 | 1,767,286 |
| Events in quadrant B | 9,282,243 | 1,817,109 |
| Events in quadrant C | 8,349,152 | 1,766,611 |
| Events in quadrant D | 13,651,393 | 1,647,572 |
| Mode M0 | |||
|---|---|---|---|
| Quadrant | BADHDUFLAG | Total packets | Discarded packets |
| A | 0 | 34194 | 0 |
| B | 0 | 37914 | 0 |
| C | 0 | 34804 | 0 |
| D | 0 | 51481 | 0 |
| Mode M9 | |||
|---|---|---|---|
| Quadrant | BADHDUFLAG | Total packets | Discarded packets |
| A | 0 | 39 | 0 |
| B | 0 | 39 | 0 |
| C | 0 | 39 | 0 |
| D | 0 | 39 | 0 |
| Quadrant | Total seconds | Saturated seconds | Saturation percentage |
|---|---|---|---|
| A | 15801 | 164 | 1.037909% |
| B | 15800 | 284 | 1.797468% |
| C | 15800 | 312 | 1.974684% |
| D | 15801 | 1218 | 7.708373% |
Noise dominated data is calculated using 1-second bins in cleaned event files. If a bin has >2000 counts, and if more than 50% of those come from <1% of pixels, then it is considered to be noise-dominated and hence unusable.
| Quadrant | # 1 sec bins | Bins with >0 counts | Bins with >2000 counts | High rate bins dominated by noise | Noise dominated (total time) | Noise dominated (detector-on time) | Marked lightcurve |
|---|---|---|---|---|---|---|---|
| A | 19716 | 15803 | 0 | 0 | 0.00% | 0.00% | 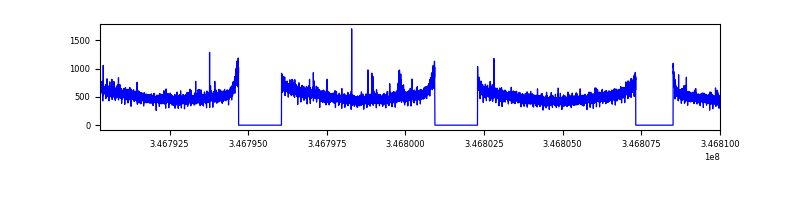 |
| B | 19715 | 15802 | 29 | 29 | 0.15% | 0.18% | 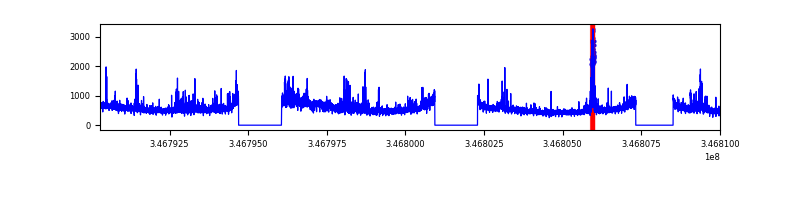 |
| C | 19715 | 15802 | 2 | 2 | 0.01% | 0.01% | 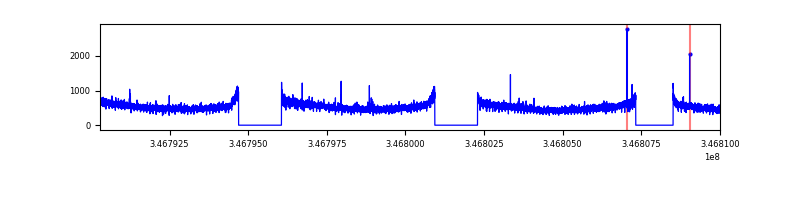 |
| D | 19716 | 15804 | 979 | 979 | 4.97% | 6.19% | 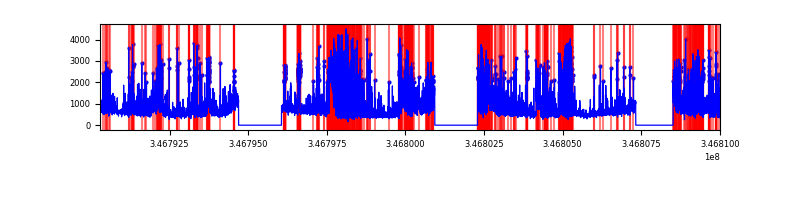 |
Top three noisy pixels from each quadrant. If the there are fewer than three noisy pixels in the level2.evt file, extra rows are filled as -1
| Pixel properties | Quadrant properties | ||||||
|---|---|---|---|---|---|---|---|
| Quadrant | DetID | PixID | Counts | Sigma | Mean | Median | Sigma |
| A | 15 | 174 | 44472 | 102.87 | 2091 | 2054 | 412.4 |
| A | 13 | 254 | 24163 | 53.62 | 2091 | 2054 | 412.4 |
| A | 3 | 137 | 19534 | 42.39 | 2091 | 2054 | 412.4 |
| B | 10 | 245 | 855157 | 2200.3 | 2092 | 2045 | 387.7 |
| B | 15 | 222 | 137317 | 348.89 | 2092 | 2045 | 387.7 |
| B | 0 | 230 | 84329 | 212.22 | 2092 | 2045 | 387.7 |
| C | 14 | 238 | 334030 | 702.62 | 2049 | 2068 | 472.5 |
| C | 7 | 220 | 21446 | 41.01 | 2049 | 2068 | 472.5 |
| C | 13 | 61 | 14023 | 25.3 | 2049 | 2068 | 472.5 |
| D | 1 | 52 | 5177642 | 11117.78 | 1989 | 1943 | 465.5 |
| D | 8 | 195 | 666304 | 1427.1 | 1989 | 1943 | 465.5 |
| D | 7 | 238 | 144215 | 305.61 | 1989 | 1943 | 465.5 |
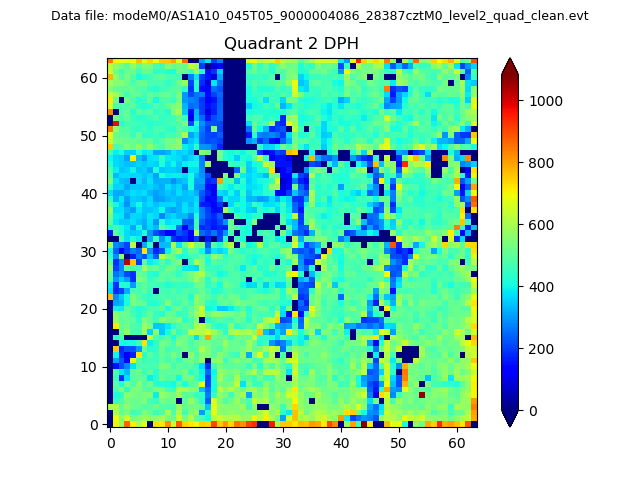
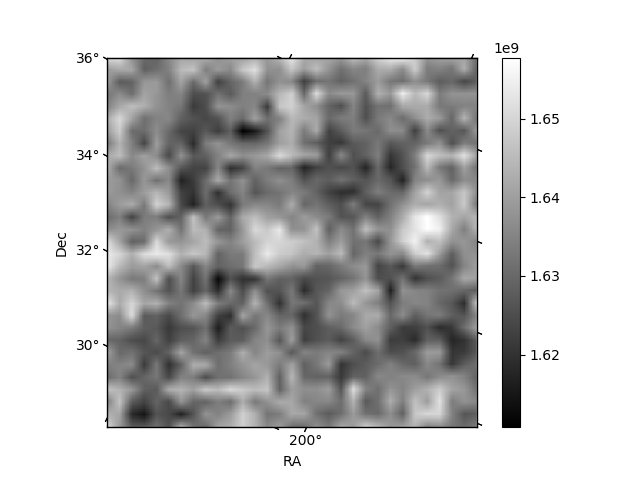
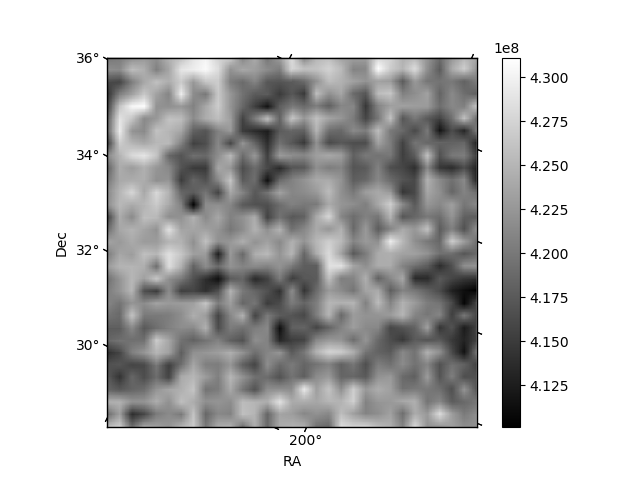
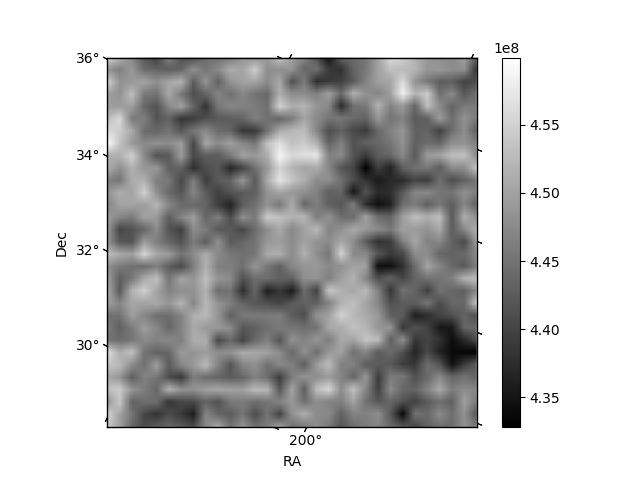
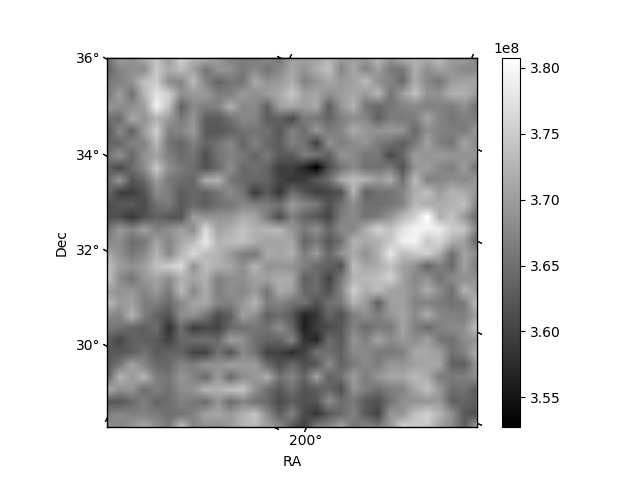
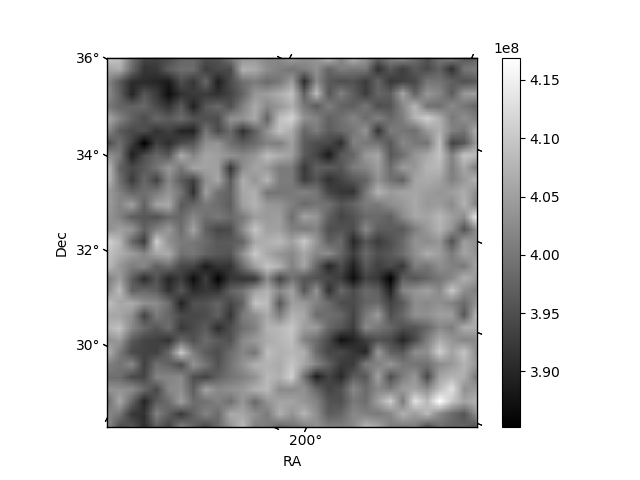
Histogram calculated using DETX and DETY for each event in the final _common_clean file
| Quadrant A | 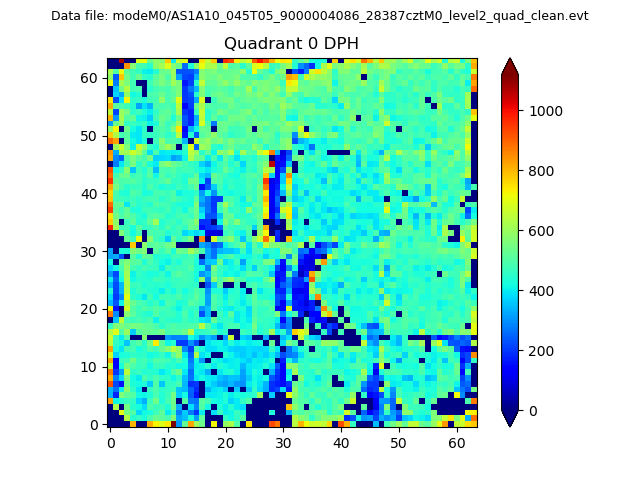 |
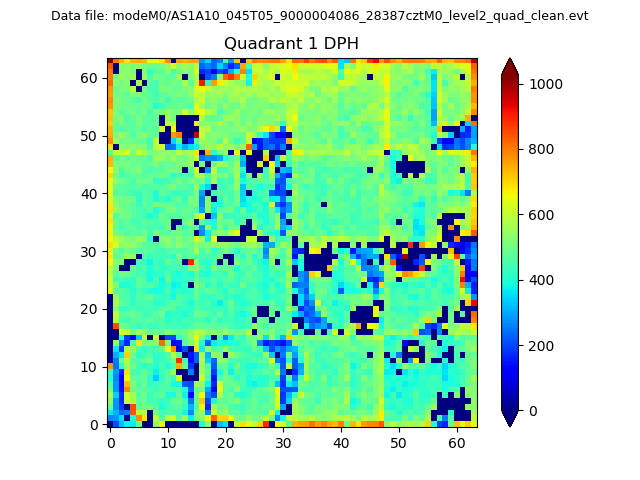 |
Quadrant B |
|---|---|---|---|
| Quadrant D | 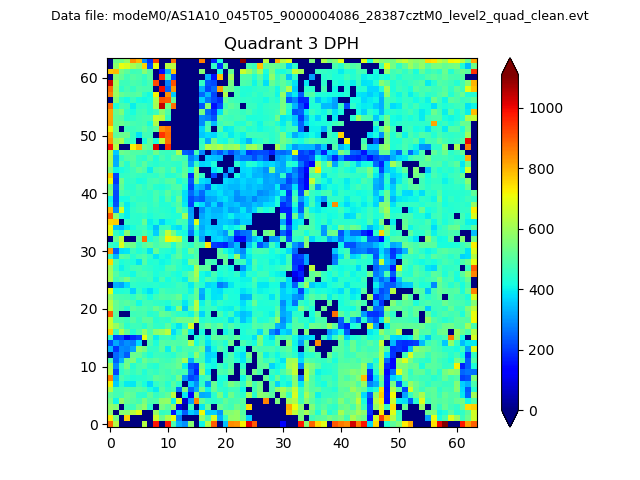 |
 |
Quadrant C |
| Plot type | Count rate plots | Images |
|---|---|---|
| Comparison with Poisson distribution Blue bars denote a histogram of data divided into 1 sec bins. Red curve is a Poisson curve with rate = median count rate of data. |
 |
 |
| Quadrant-wise count rates Data is divided into 100 sec bins |
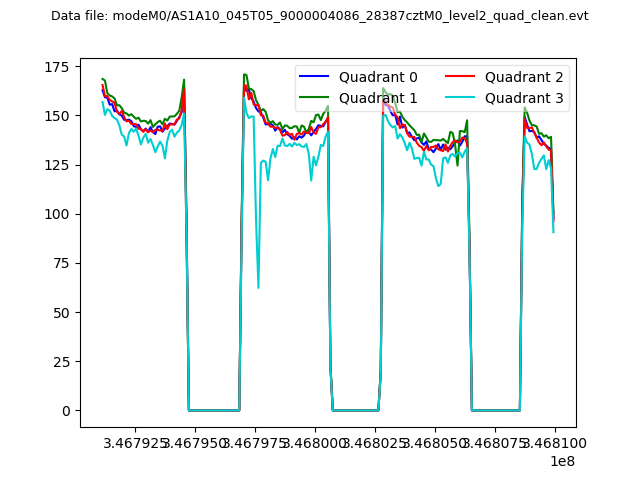 |
|
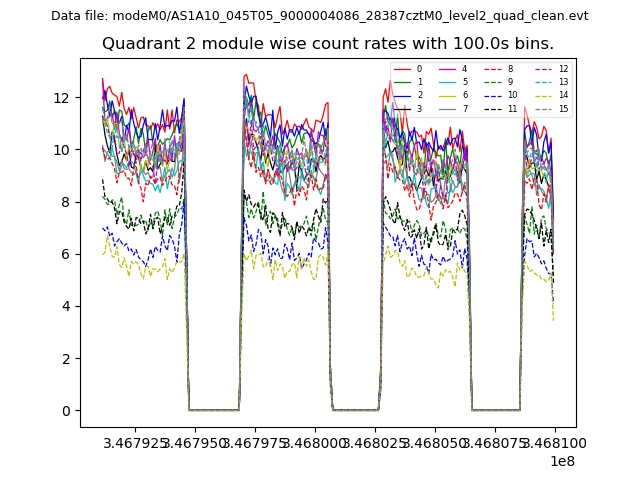
| Module-wise count rates for Quadrant A Data is divided into 100 sec bins |
 |
 |
| Module-wise count rates for Quadrant B Data is divided into 100 sec bins |
 |
 |
| Module-wise count rates for Quadrant C Data is divided into 100 sec bins |
 |
 |
| Module-wise count rates for Quadrant D Data is divided into 100 sec bins |
 |
 |
| Parameter | Plot |
|---|---|
| CZT HV Monitor | 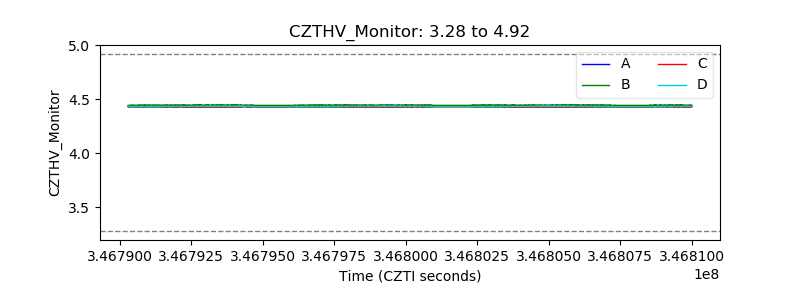 |
| D_VDD | 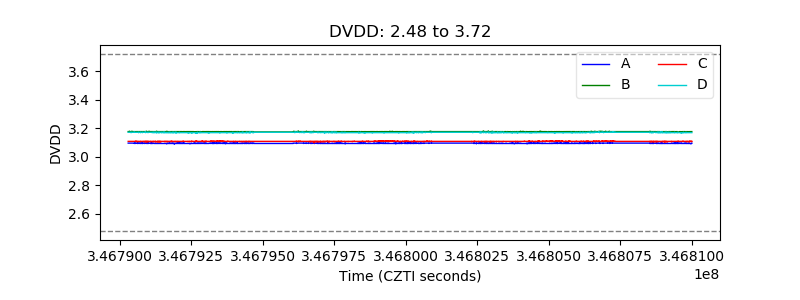 |
| Temperature 1 | 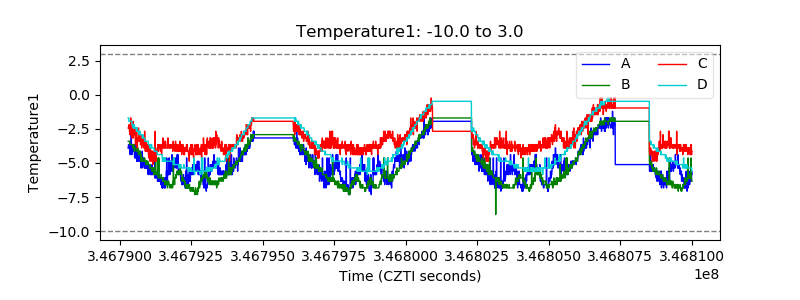 |
| Veto HV Monitor | 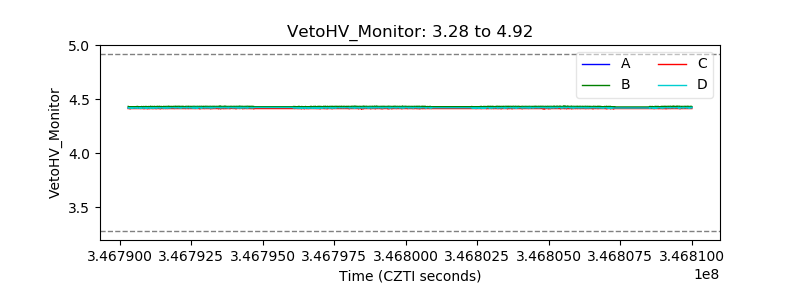 |
| Veto LLD | 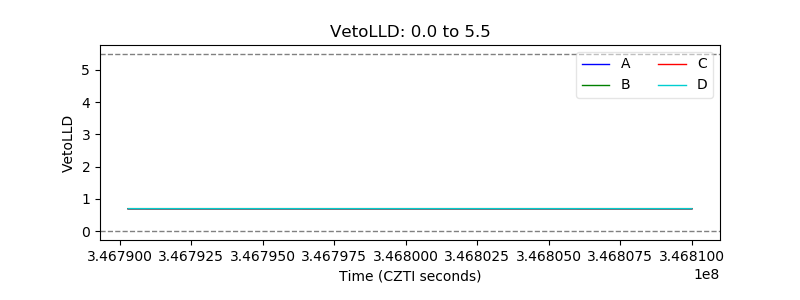 |
| Alpha Counter | 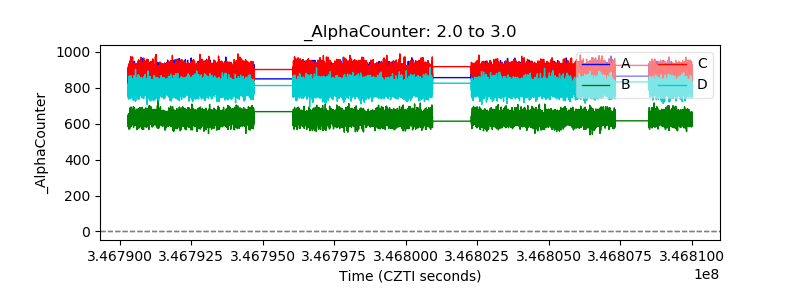 |
| _CPM_Rate | 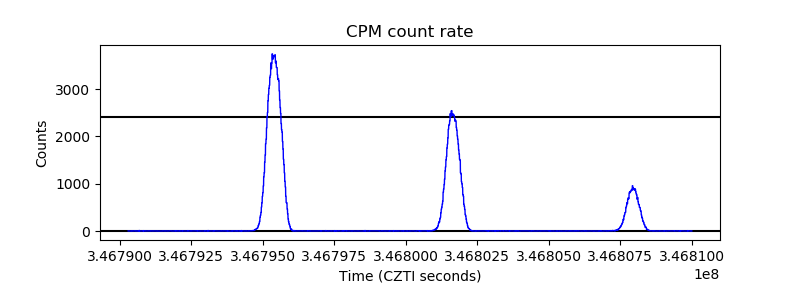 |
| CZT Counter |  |
| +2.5 Volts monitor |  |
| +5 Volts monitor | 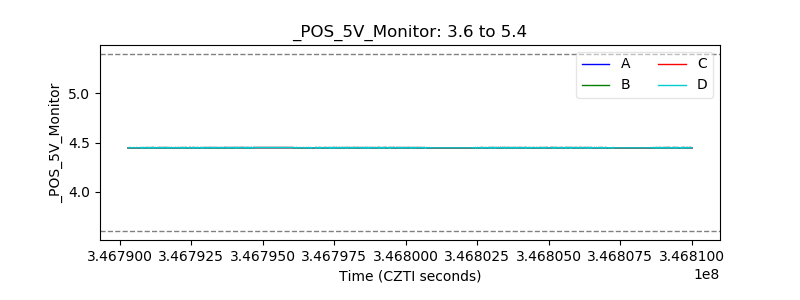 |
| _ROLL_ROT | 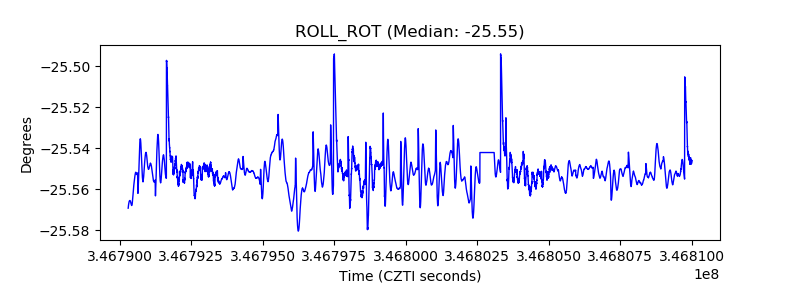 |
| _Roll_DEC | 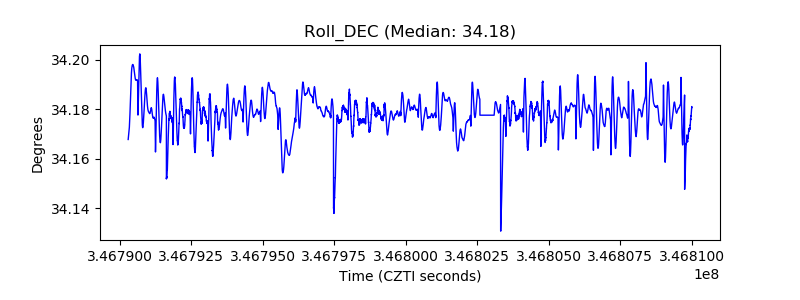 |
| _Roll_RA | 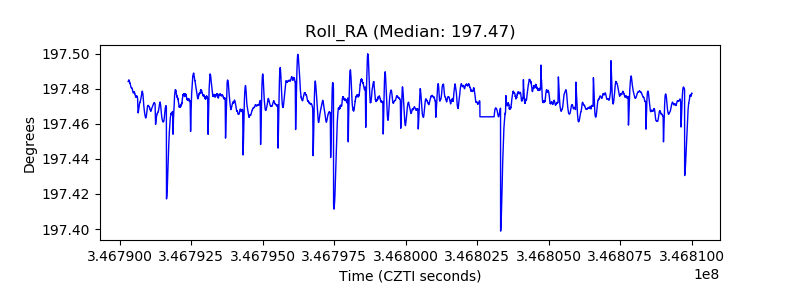 |
| Veto Counter | 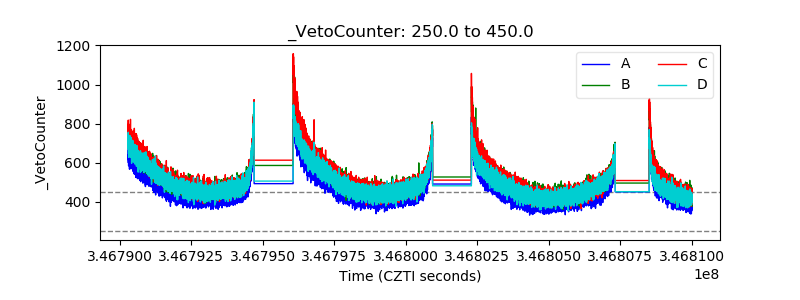 |