| Param | Original file | Final file |
|---|---|---|
| Filename | modeM0/AS1A10_045T05_9000004086_28388cztM0_level2.evt | modeM0/AS1A10_045T05_9000004086_28388cztM0_level2_quad_clean.evt |
| Size (bytes) | 626,883,840 | 108,679,680 |
| Size | 597.8 MB | 103.6 MB |
| Events in quadrant A | 3,392,688 | 708,123 |
| Events in quadrant B | 4,193,403 | 727,920 |
| Events in quadrant C | 3,463,590 | 705,486 |
| Events in quadrant D | 7,456,481 | 656,954 |
| Mode M0 | |||
|---|---|---|---|
| Quadrant | BADHDUFLAG | Total packets | Discarded packets |
| A | 0 | 14718 | 0 |
| B | 0 | 17113 | 0 |
| C | 0 | 14826 | 0 |
| D | 0 | 27156 | 0 |
| Mode M9 | |||
|---|---|---|---|
| Quadrant | BADHDUFLAG | Total packets | Discarded packets |
| A | 0 | 8 | 0 |
| B | 0 | 8 | 0 |
| C | 0 | 8 | 0 |
| D | 0 | 8 | 0 |
| Quadrant | Total seconds | Saturated seconds | Saturation percentage |
|---|---|---|---|
| A | 7078 | 30 | 0.423849% |
| B | 7079 | 216 | 3.051278% |
| C | 7079 | 112 | 1.582144% |
| D | 7079 | 707 | 9.987286% |
Noise dominated data is calculated using 1-second bins in cleaned event files. If a bin has >2000 counts, and if more than 50% of those come from <1% of pixels, then it is considered to be noise-dominated and hence unusable.
| Quadrant | # 1 sec bins | Bins with >0 counts | Bins with >2000 counts | High rate bins dominated by noise | Noise dominated (total time) | Noise dominated (detector-on time) | Marked lightcurve |
|---|---|---|---|---|---|---|---|
| A | 7908 | 7079 | 0 | 0 | 0.00% | 0.00% | 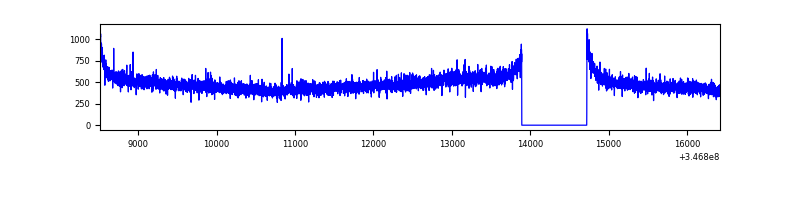 |
| B | 7909 | 7080 | 43 | 43 | 0.54% | 0.61% | 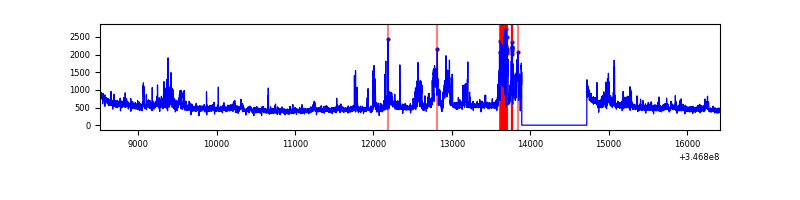 |
| C | 7909 | 7080 | 1 | 1 | 0.01% | 0.01% | 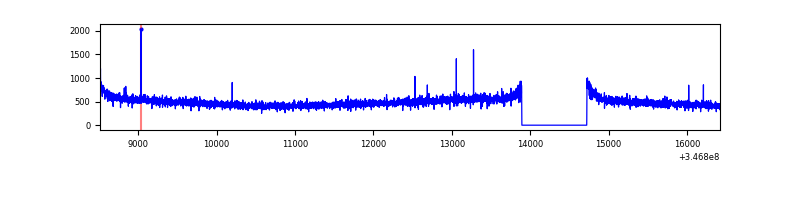 |
| D | 7909 | 7080 | 618 | 618 | 7.81% | 8.73% | 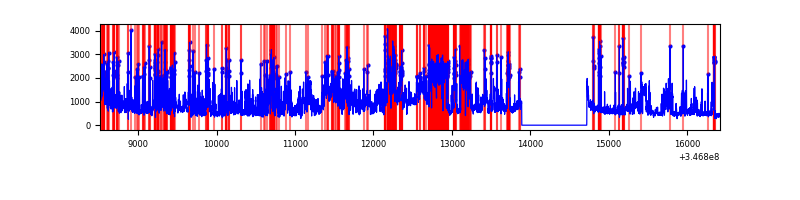 |
Top three noisy pixels from each quadrant. If the there are fewer than three noisy pixels in the level2.evt file, extra rows are filled as -1
| Pixel properties | Quadrant properties | ||||||
|---|---|---|---|---|---|---|---|
| Quadrant | DetID | PixID | Counts | Sigma | Mean | Median | Sigma |
| A | 13 | 254 | 10500 | 54.58 | 875 | 857 | 176.7 |
| A | 3 | 137 | 8615 | 43.91 | 875 | 857 | 176.7 |
| A | 10 | 67 | 7943 | 40.11 | 875 | 857 | 176.7 |
| B | 10 | 245 | 744840 | 4459.02 | 873 | 852 | 166.9 |
| B | 12 | 111 | 20813 | 119.63 | 873 | 852 | 166.9 |
| B | 11 | 111 | 18953 | 108.49 | 873 | 852 | 166.9 |
| C | 14 | 238 | 136923 | 683.11 | 850 | 858 | 199.2 |
| C | 7 | 220 | 7104 | 31.36 | 850 | 858 | 199.2 |
| C | 13 | 61 | 5720 | 24.41 | 850 | 858 | 199.2 |
| D | 1 | 52 | 4009103 | 20321.04 | 820 | 797 | 197.2 |
| D | 8 | 195 | 247121 | 1248.8 | 820 | 797 | 197.2 |
| D | 2 | 250 | 55313 | 276.38 | 820 | 797 | 197.2 |
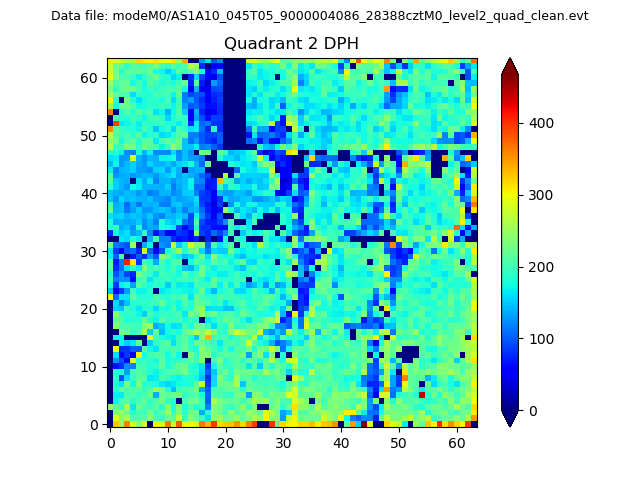
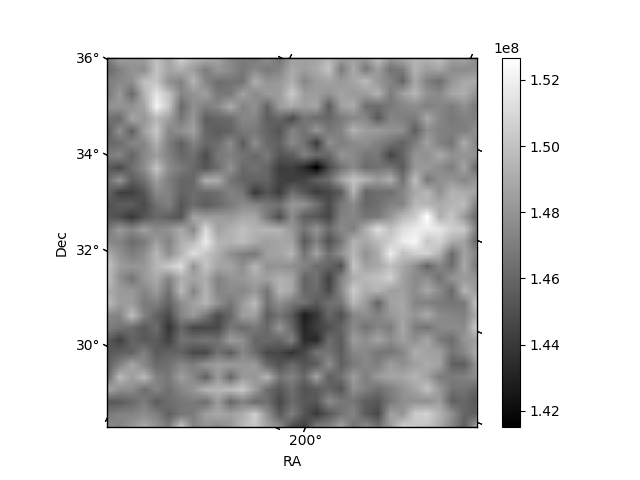
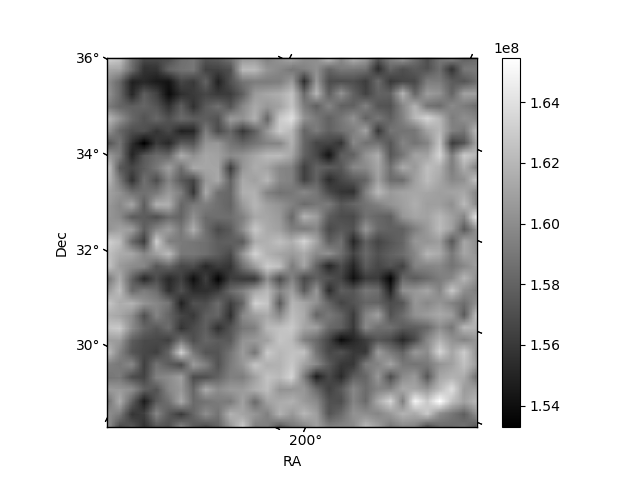
Histogram calculated using DETX and DETY for each event in the final _common_clean file
| Quadrant A | 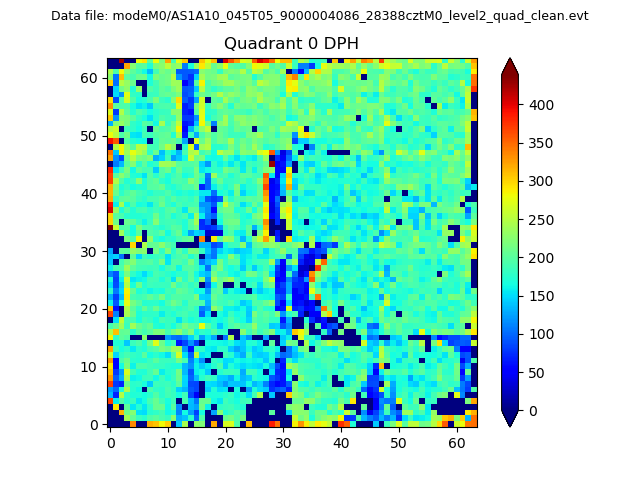 |
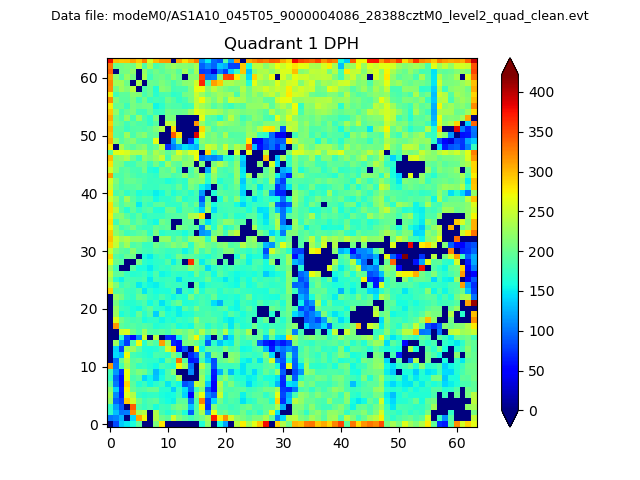 |
Quadrant B |
|---|---|---|---|
| Quadrant D | 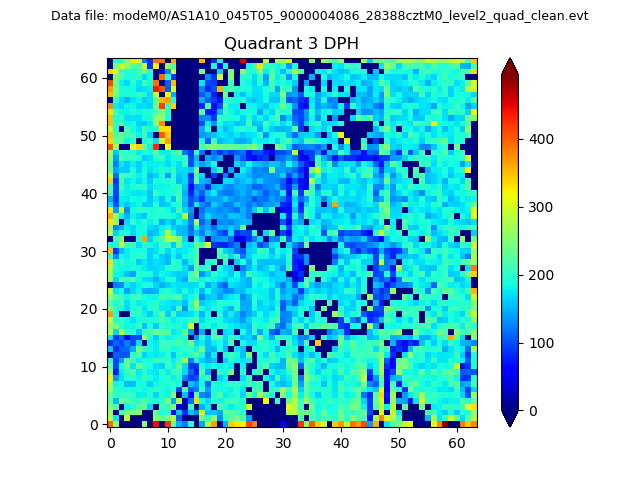 |
 |
Quadrant C |
| Plot type | Count rate plots | Images |
|---|---|---|
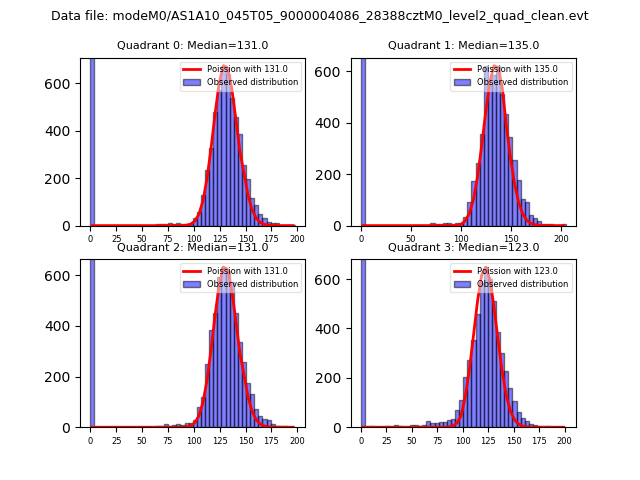
| Comparison with Poisson distribution Blue bars denote a histogram of data divided into 1 sec bins. Red curve is a Poisson curve with rate = median count rate of data. |
 |
 |
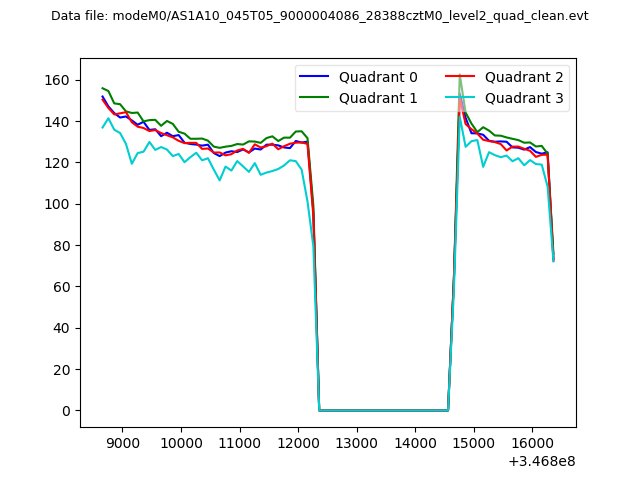
| Quadrant-wise count rates Data is divided into 100 sec bins |
 |
|
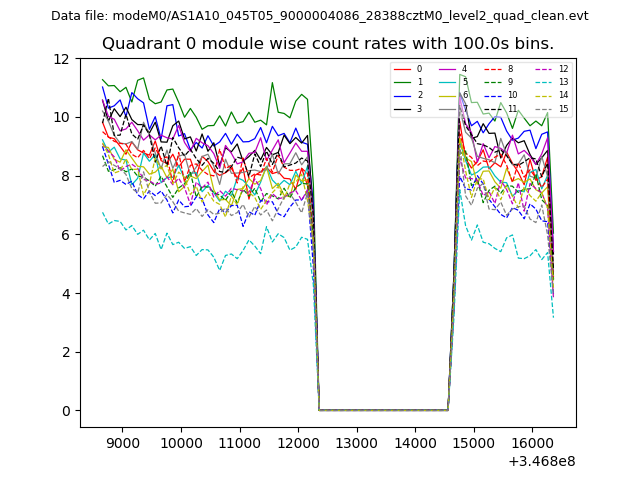
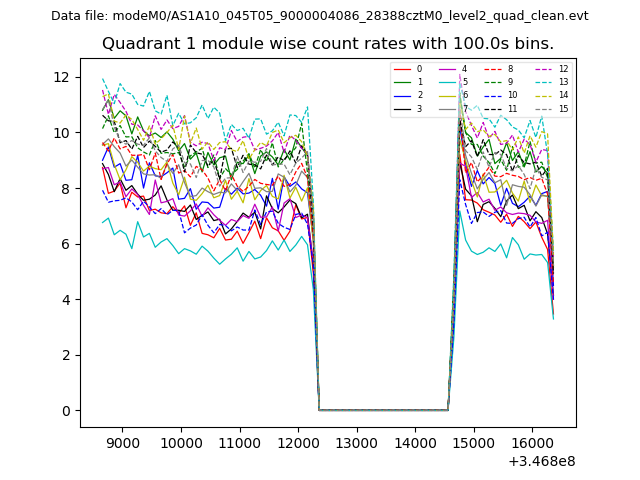
| Module-wise count rates for Quadrant A Data is divided into 100 sec bins |
 |
 |
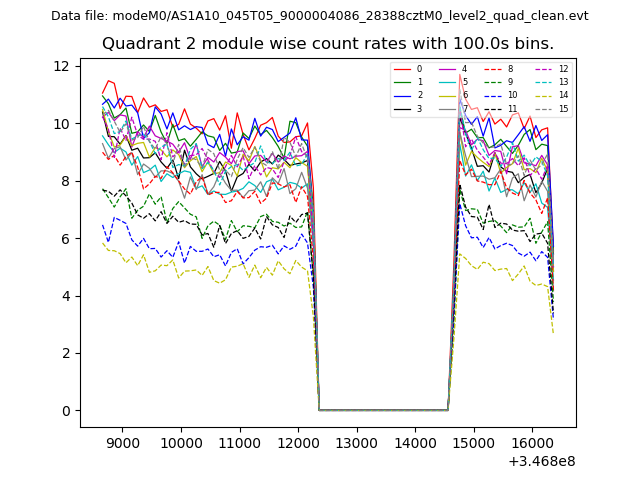
| Module-wise count rates for Quadrant B Data is divided into 100 sec bins |
 |
 |
| Module-wise count rates for Quadrant C Data is divided into 100 sec bins |
 |
 |
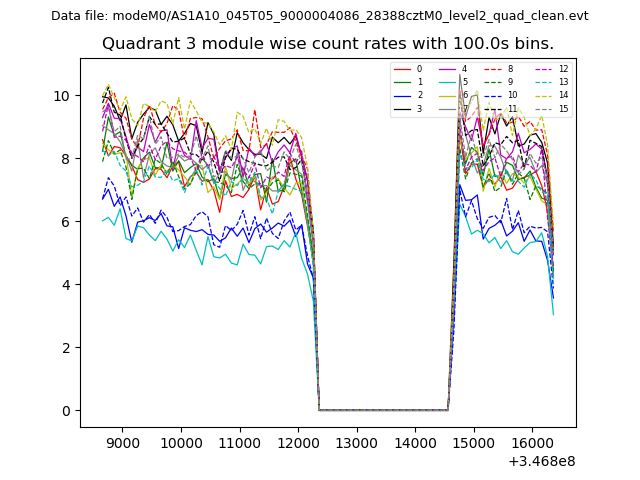
| Module-wise count rates for Quadrant D Data is divided into 100 sec bins |
 |
 |
| Parameter | Plot |
|---|---|
| CZT HV Monitor | 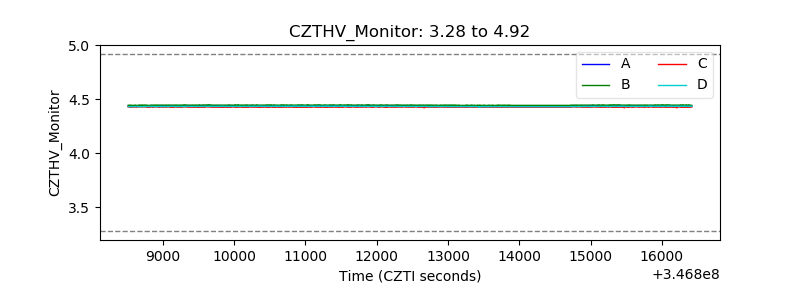 |
| D_VDD | 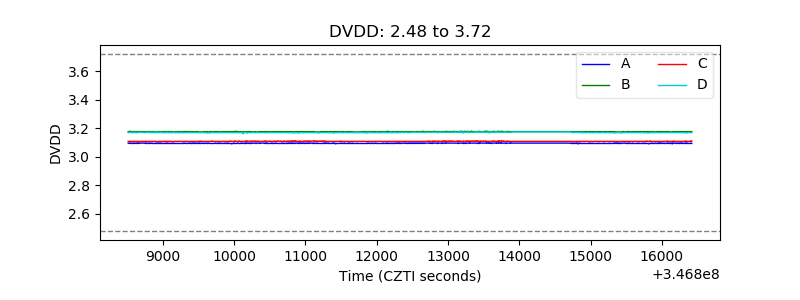 |
| Temperature 1 | 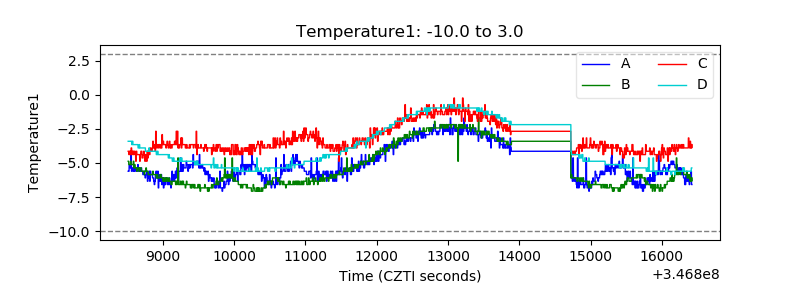 |
| Veto HV Monitor | 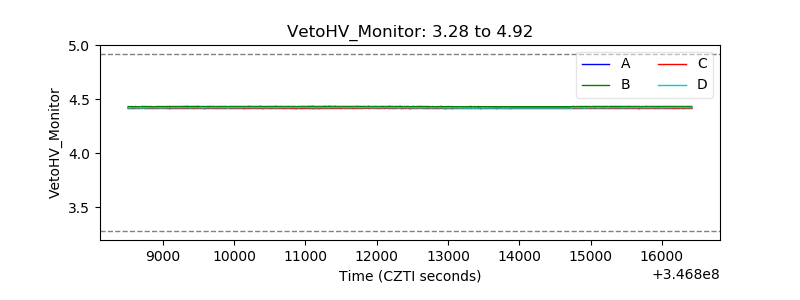 |
| Veto LLD | 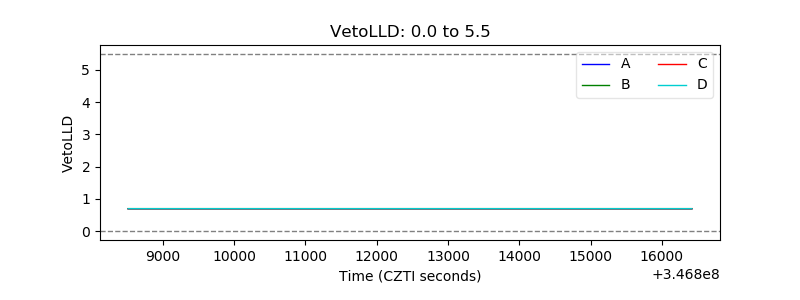 |
| Alpha Counter | 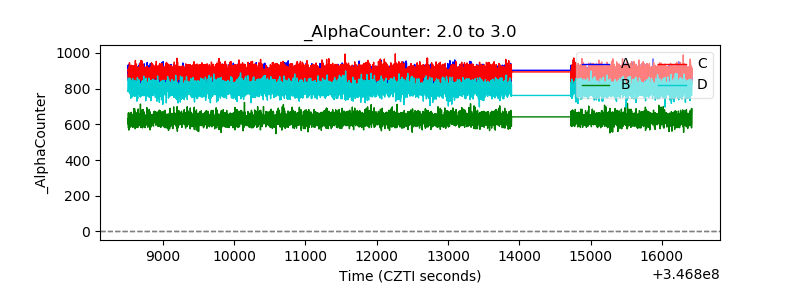 |
| _CPM_Rate | 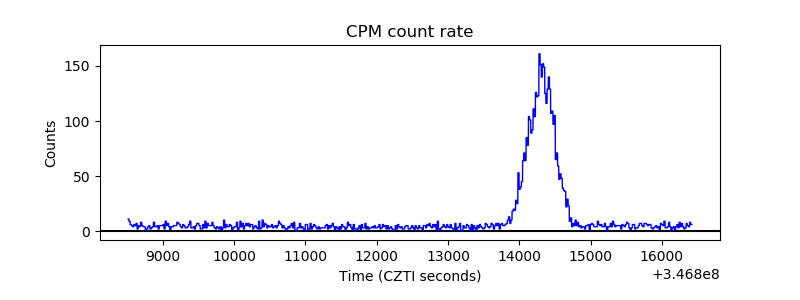 |
| CZT Counter | 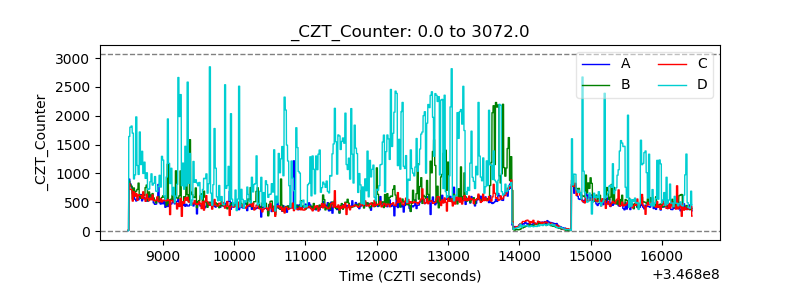 |
| +2.5 Volts monitor | 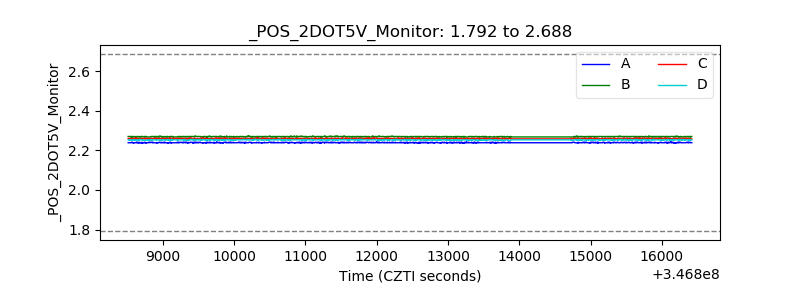 |
| +5 Volts monitor |  |
| _ROLL_ROT | 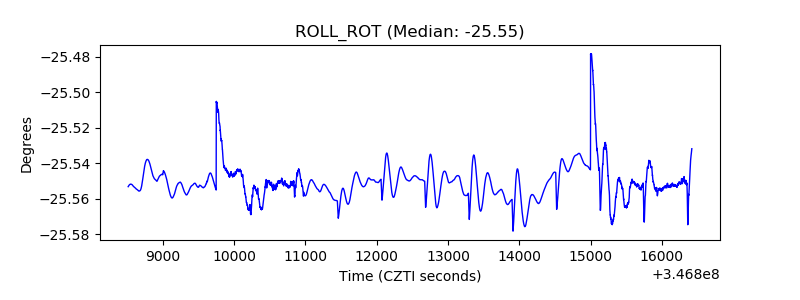 |
| _Roll_DEC | 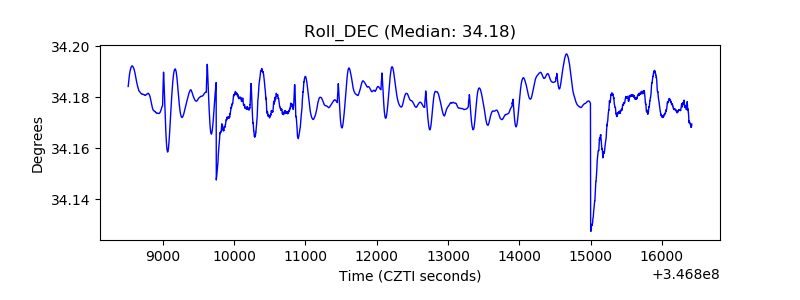 |
| _Roll_RA | 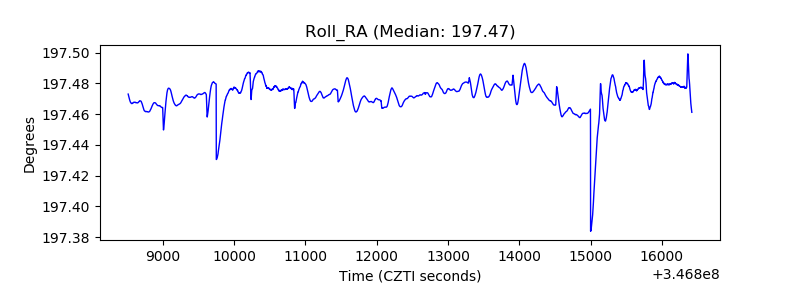 |
| Veto Counter | 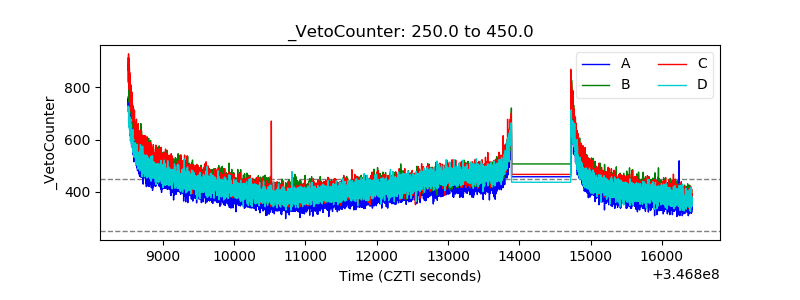 |