| Param | Original file | Final file |
|---|---|---|
| Filename | modeM0/AS1A10_045T05_9000004086_28390cztM0_level2.evt | modeM0/AS1A10_045T05_9000004086_28390cztM0_level2_quad_clean.evt |
| Size (bytes) | 1,084,890,240 | 177,410,880 |
| Size | 1.0 GB | 169.2 MB |
| Events in quadrant A | 6,359,281 | 1,128,648 |
| Events in quadrant B | 6,690,437 | 1,158,177 |
| Events in quadrant C | 6,438,951 | 1,114,443 |
| Events in quadrant D | 12,471,301 | 1,055,180 |
| Mode M0 | |||
|---|---|---|---|
| Quadrant | BADHDUFLAG | Total packets | Discarded packets |
| A | 0 | 27798 | 0 |
| B | 0 | 28453 | 0 |
| C | 0 | 27899 | 0 |
| D | 0 | 46193 | 0 |
| Mode M9 | |||
|---|---|---|---|
| Quadrant | BADHDUFLAG | Total packets | Discarded packets |
| A | 0 | 2 | 0 |
| B | 0 | 2 | 0 |
| C | 0 | 2 | 0 |
| D | 0 | 2 | 0 |
| Quadrant | Total seconds | Saturated seconds | Saturation percentage |
|---|---|---|---|
| A | 13261 | 192 | 1.447855% |
| B | 13261 | 308 | 2.322600% |
| C | 13261 | 347 | 2.616696% |
| D | 13261 | 1305 | 9.840887% |
Noise dominated data is calculated using 1-second bins in cleaned event files. If a bin has >2000 counts, and if more than 50% of those come from <1% of pixels, then it is considered to be noise-dominated and hence unusable.
| Quadrant | # 1 sec bins | Bins with >0 counts | Bins with >2000 counts | High rate bins dominated by noise | Noise dominated (total time) | Noise dominated (detector-on time) | Marked lightcurve |
|---|---|---|---|---|---|---|---|
| A | 13511 | 13262 | 0 | 0 | 0.00% | 0.00% | 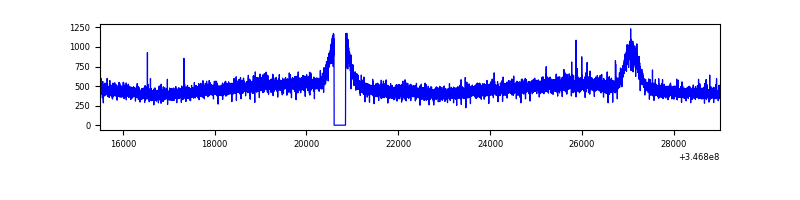 |
| B | 13511 | 13262 | 5 | 5 | 0.04% | 0.04% | 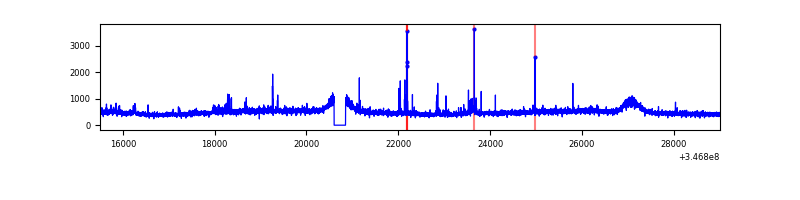 |
| C | 13511 | 13262 | 0 | 0 | 0.00% | 0.00% | 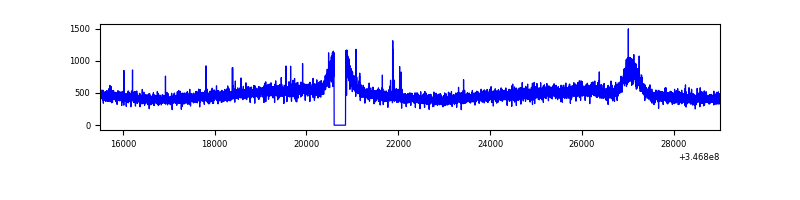 |
| D | 13511 | 13262 | 1046 | 1046 | 7.74% | 7.89% | 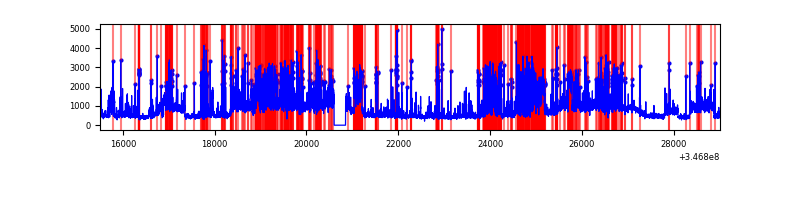 |
Top three noisy pixels from each quadrant. If the there are fewer than three noisy pixels in the level2.evt file, extra rows are filled as -1
| Pixel properties | Quadrant properties | ||||||
|---|---|---|---|---|---|---|---|
| Quadrant | DetID | PixID | Counts | Sigma | Mean | Median | Sigma |
| A | 13 | 254 | 20274 | 56.11 | 1643 | 1605 | 332.7 |
| A | 3 | 137 | 16759 | 45.55 | 1643 | 1605 | 332.7 |
| A | 0 | 226 | 13878 | 36.89 | 1643 | 1605 | 332.7 |
| B | 10 | 245 | 161153 | 502.81 | 1634 | 1593 | 317.3 |
| B | 10 | 246 | 73162 | 225.53 | 1634 | 1593 | 317.3 |
| B | 12 | 111 | 40307 | 122.0 | 1634 | 1593 | 317.3 |
| C | 14 | 238 | 251183 | 667.65 | 1580 | 1590 | 373.8 |
| C | 7 | 220 | 19864 | 48.88 | 1580 | 1590 | 373.8 |
| C | 3 | 233 | 14164 | 33.63 | 1580 | 1590 | 373.8 |
| D | 1 | 52 | 3896220 | 10471.94 | 1538 | 1493 | 371.9 |
| D | 8 | 195 | 2363758 | 6351.53 | 1538 | 1493 | 371.9 |
| D | 2 | 153 | 182565 | 486.86 | 1538 | 1493 | 371.9 |
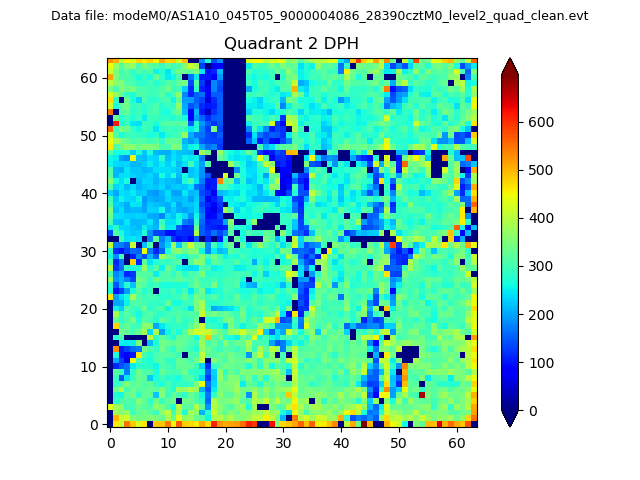
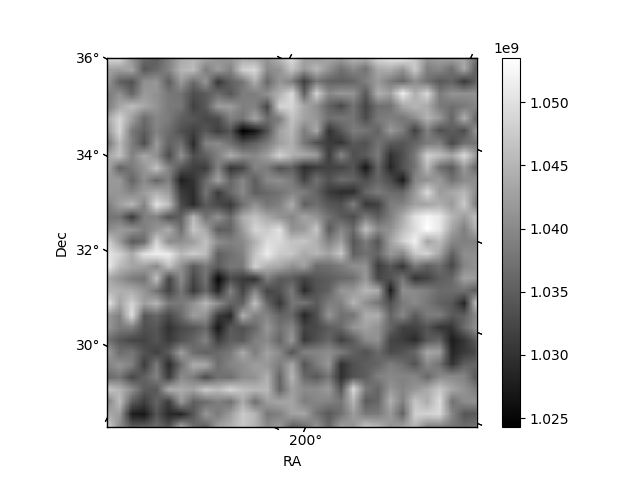
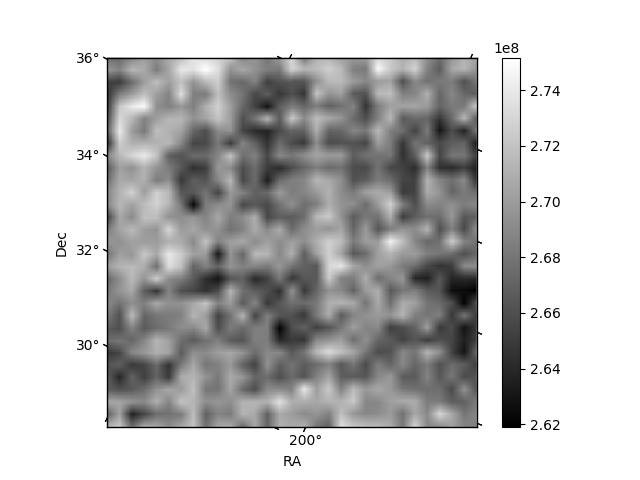
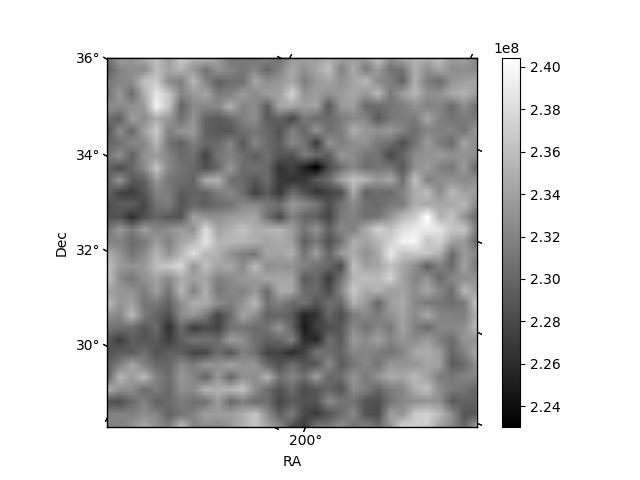
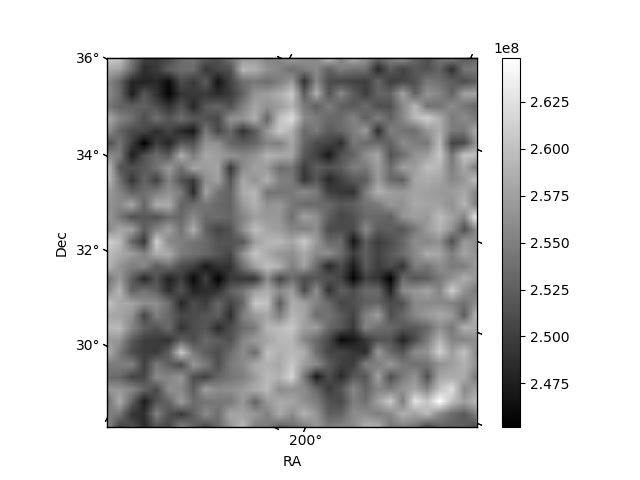
Histogram calculated using DETX and DETY for each event in the final _common_clean file
| Quadrant A | 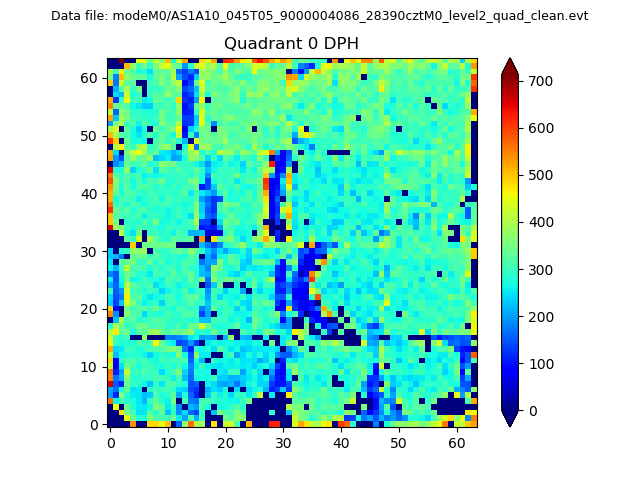 |
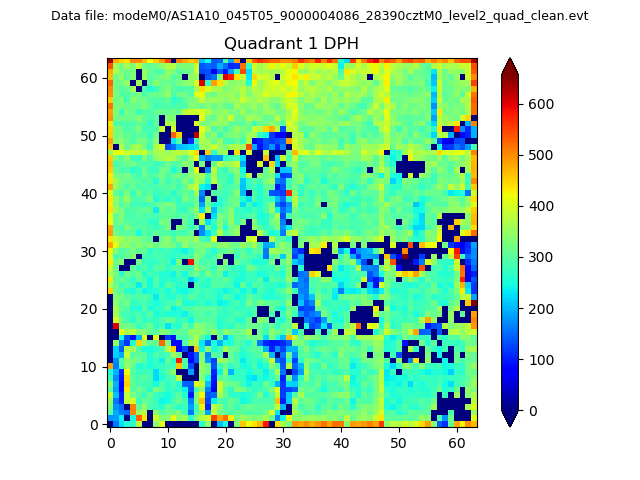 |
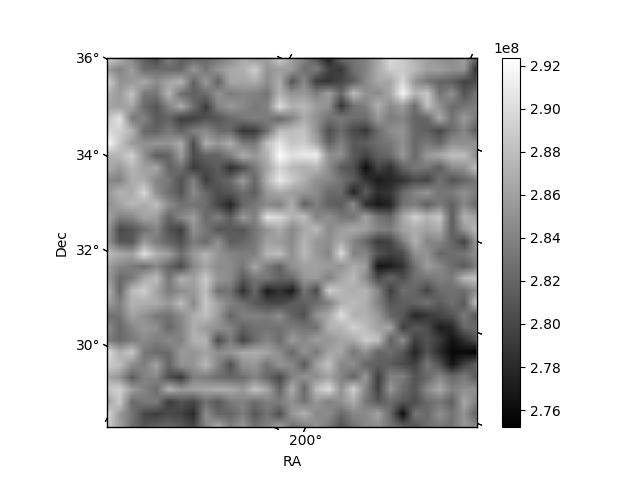
Quadrant B |
|---|---|---|---|
| Quadrant D | 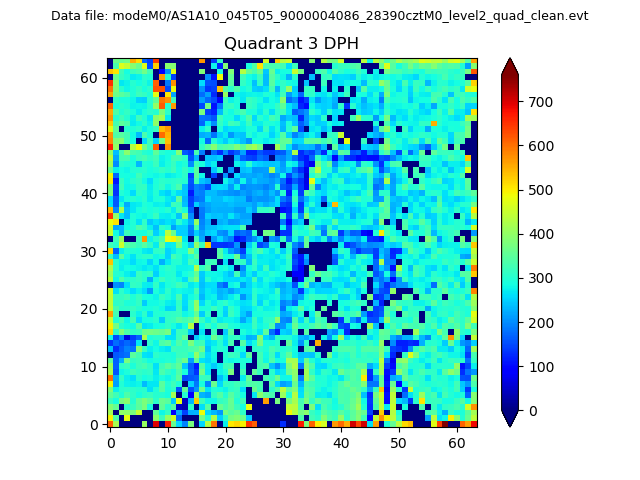 |
 |
Quadrant C |
| Plot type | Count rate plots | Images |
|---|---|---|
| Comparison with Poisson distribution Blue bars denote a histogram of data divided into 1 sec bins. Red curve is a Poisson curve with rate = median count rate of data. |
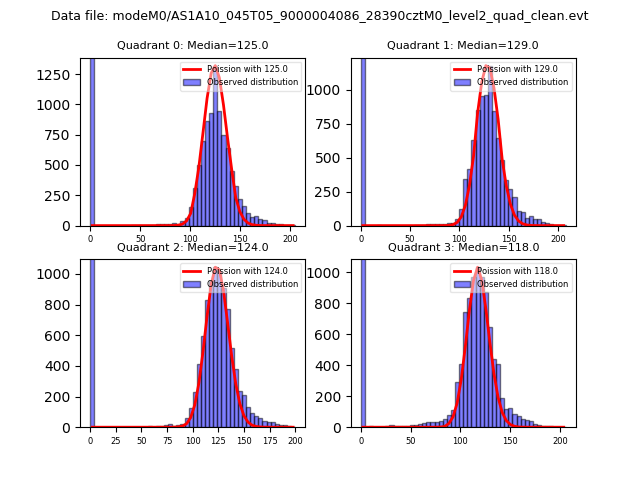 |
 |
| Quadrant-wise count rates Data is divided into 100 sec bins |
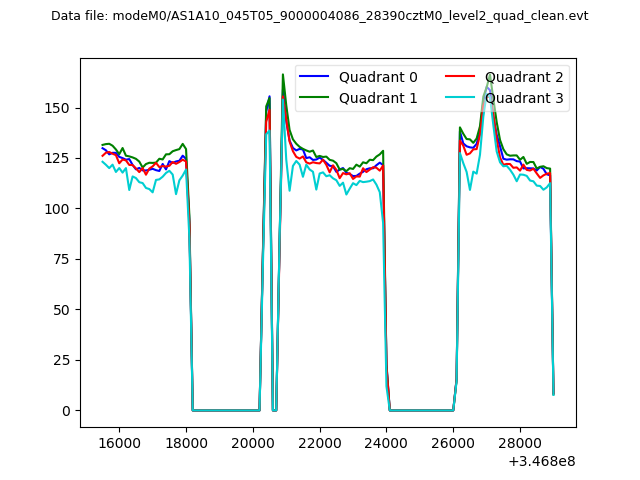 |
|
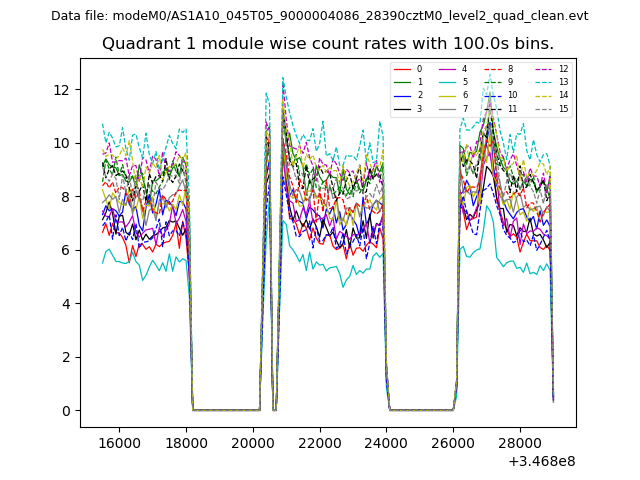
| Module-wise count rates for Quadrant A Data is divided into 100 sec bins |
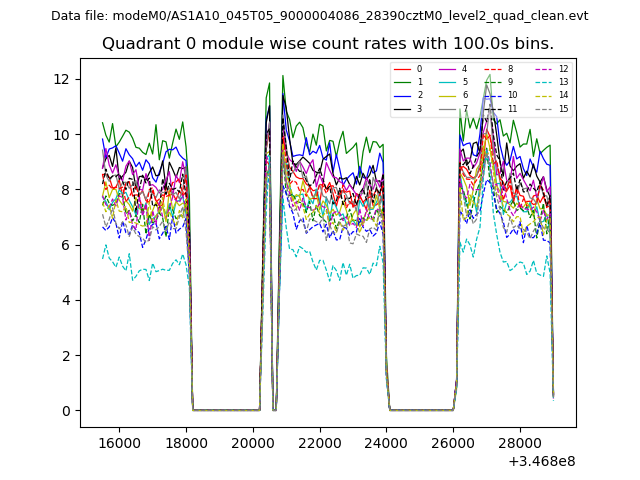 |
 |
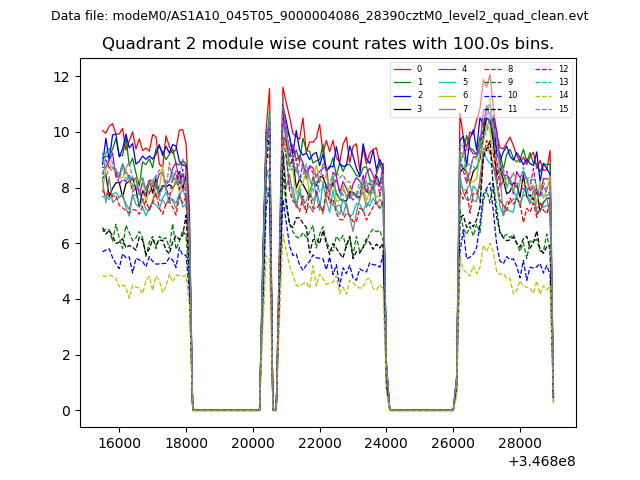
| Module-wise count rates for Quadrant B Data is divided into 100 sec bins |
 |
 |
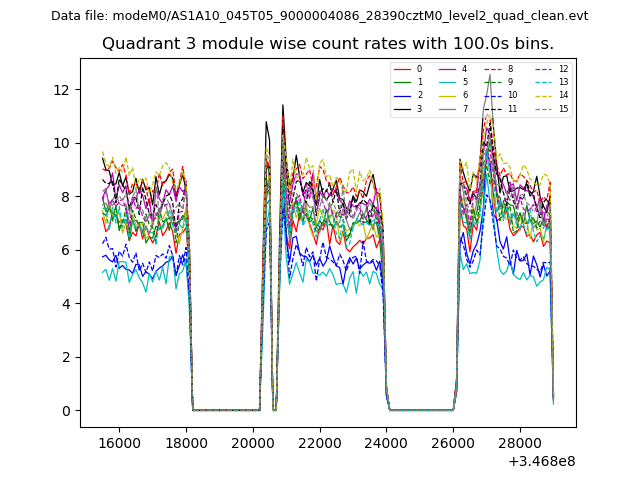
| Module-wise count rates for Quadrant C Data is divided into 100 sec bins |
 |
 |
| Module-wise count rates for Quadrant D Data is divided into 100 sec bins |
 |
 |
| Parameter | Plot |
|---|---|
| CZT HV Monitor | 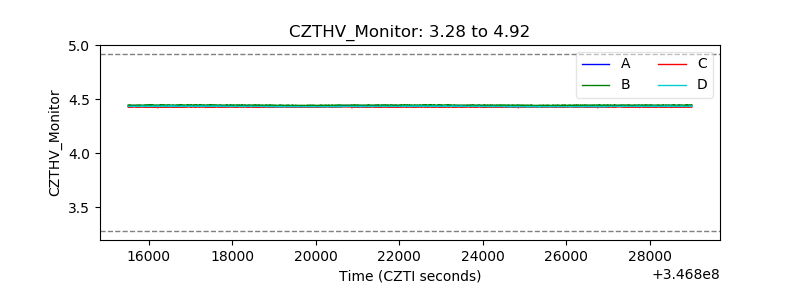 |
| D_VDD | 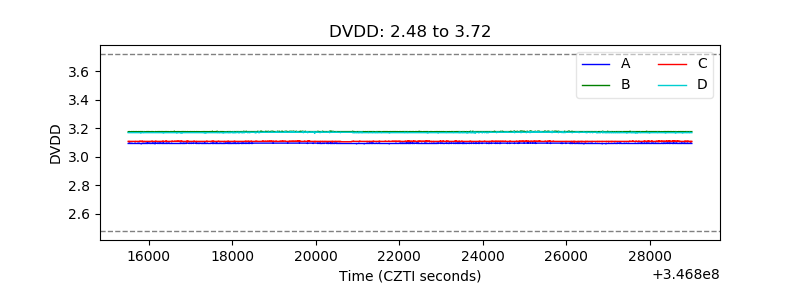 |
| Temperature 1 | 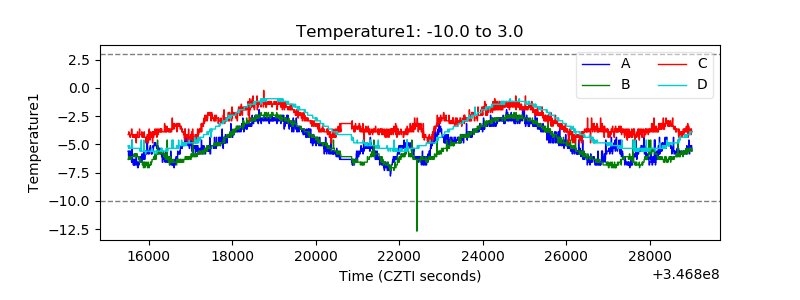 |
| Veto HV Monitor | 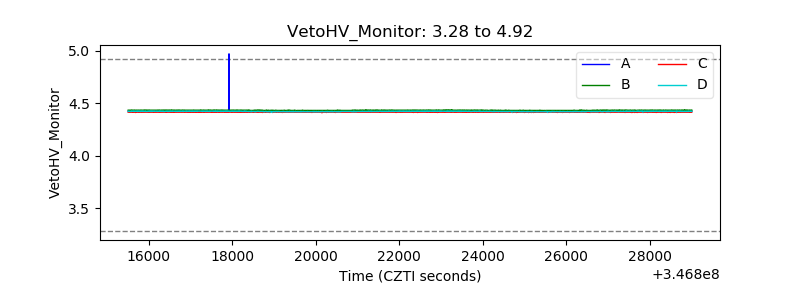 |
| Veto LLD | 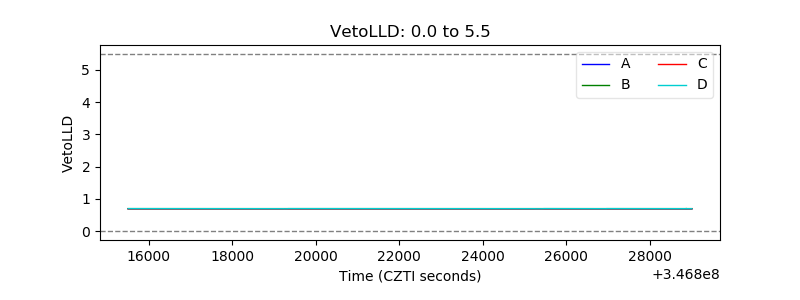 |
| Alpha Counter | 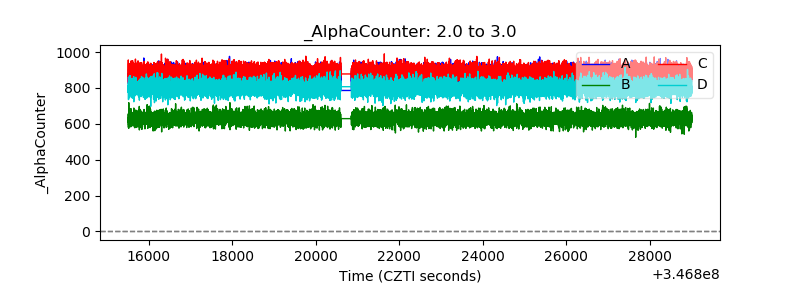 |
| _CPM_Rate | 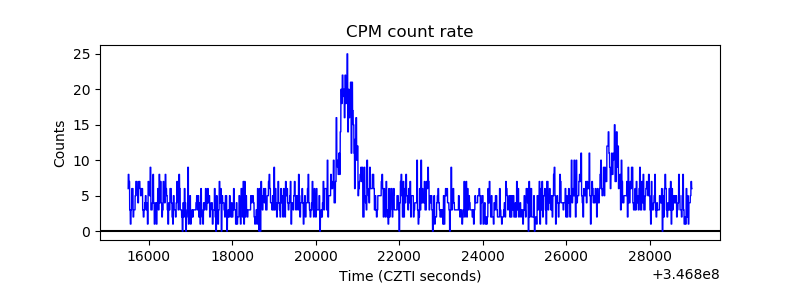 |
| CZT Counter | 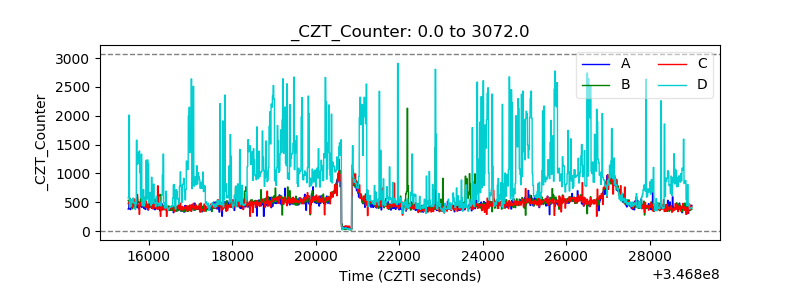 |
| +2.5 Volts monitor |  |
| +5 Volts monitor |  |
| _ROLL_ROT | 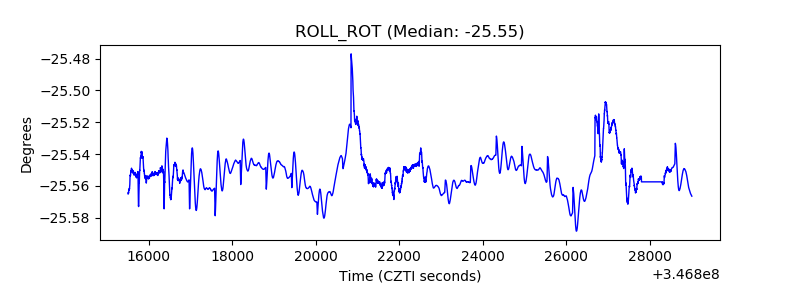 |
| _Roll_DEC | 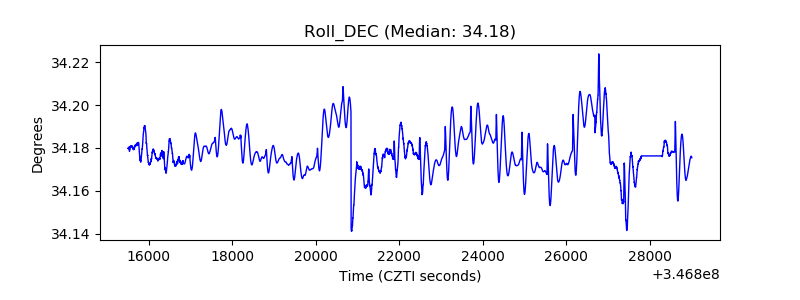 |
| _Roll_RA | 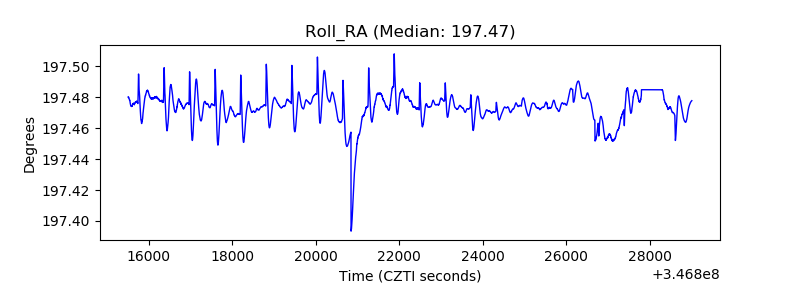 |
| Veto Counter | 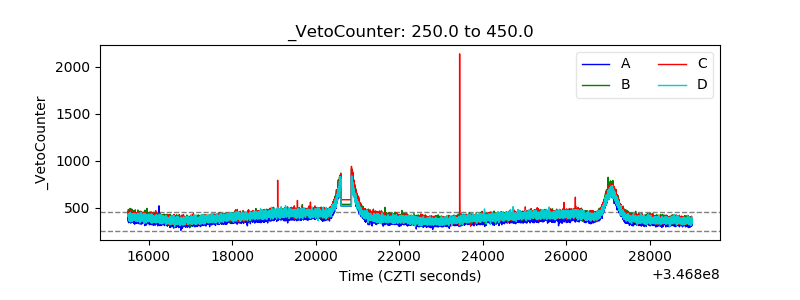 |