| Param | Original file | Final file |
|---|---|---|
| Filename | modeM0/AS1A10_045T05_9000004086_28391cztM0_level2.evt | modeM0/AS1A10_045T05_9000004086_28391cztM0_level2_quad_clean.evt |
| Size (bytes) | 582,981,120 | 93,859,200 |
| Size | 556.0 MB | 89.5 MB |
| Events in quadrant A | 3,243,532 | 599,775 |
| Events in quadrant B | 3,359,702 | 613,806 |
| Events in quadrant C | 3,296,620 | 591,361 |
| Events in quadrant D | 7,280,618 | 549,180 |
| Mode M0 | |||
|---|---|---|---|
| Quadrant | BADHDUFLAG | Total packets | Discarded packets |
| A | 0 | 14343 | 0 |
| B | 0 | 14570 | 0 |
| C | 0 | 14448 | 0 |
| D | 0 | 26557 | 0 |
| Mode M9 | |||
|---|---|---|---|
| Quadrant | BADHDUFLAG | Total packets | Discarded packets |
| A | 0 | 2 | 0 |
| B | 0 | 2 | 0 |
| C | 0 | 2 | 0 |
| D | 0 | 2 | 0 |
| Quadrant | Total seconds | Saturated seconds | Saturation percentage |
|---|---|---|---|
| A | 7007 | 101 | 1.441416% |
| B | 7007 | 120 | 1.712573% |
| C | 7007 | 128 | 1.826745% |
| D | 7008 | 1031 | 14.711758% |
Noise dominated data is calculated using 1-second bins in cleaned event files. If a bin has >2000 counts, and if more than 50% of those come from <1% of pixels, then it is considered to be noise-dominated and hence unusable.
| Quadrant | # 1 sec bins | Bins with >0 counts | Bins with >2000 counts | High rate bins dominated by noise | Noise dominated (total time) | Noise dominated (detector-on time) | Marked lightcurve |
|---|---|---|---|---|---|---|---|
| A | 7247 | 7007 | 0 | 0 | 0.00% | 0.00% | 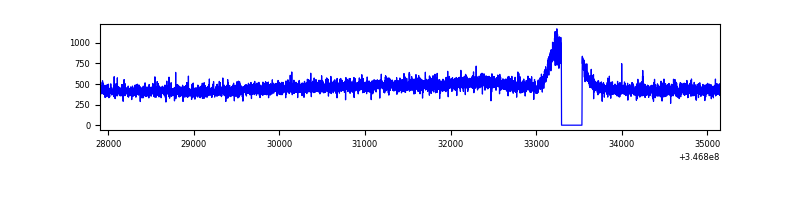 |
| B | 7247 | 7007 | 4 | 4 | 0.06% | 0.06% | 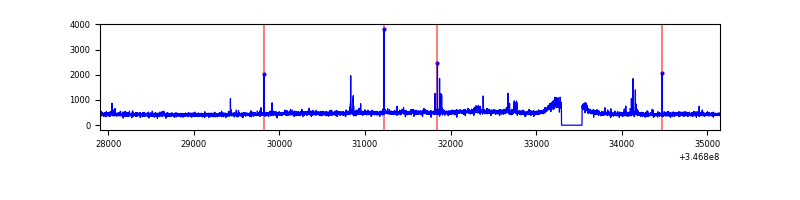 |
| C | 7247 | 7007 | 0 | 0 | 0.00% | 0.00% | 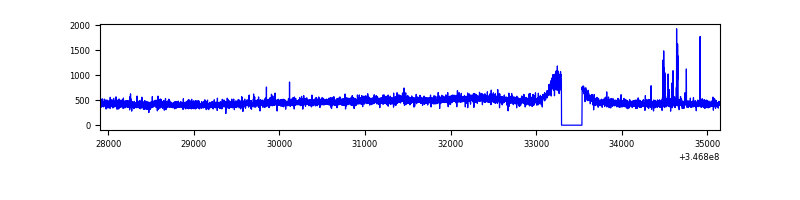 |
| D | 7248 | 7009 | 801 | 801 | 11.05% | 11.43% | 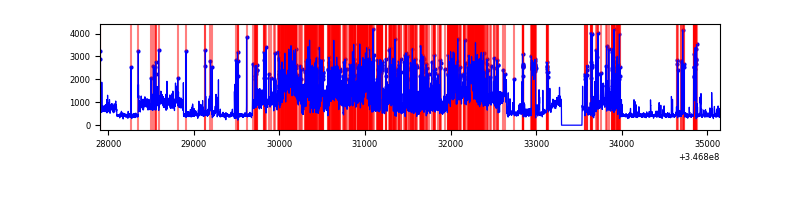 |
Top three noisy pixels from each quadrant. If the there are fewer than three noisy pixels in the level2.evt file, extra rows are filled as -1
| Pixel properties | Quadrant properties | ||||||
|---|---|---|---|---|---|---|---|
| Quadrant | DetID | PixID | Counts | Sigma | Mean | Median | Sigma |
| A | 13 | 254 | 9613 | 51.16 | 840 | 821 | 171.8 |
| A | 3 | 137 | 8558 | 45.02 | 840 | 821 | 171.8 |
| A | 0 | 226 | 7075 | 36.39 | 840 | 821 | 171.8 |
| B | 10 | 245 | 80456 | 486.99 | 832 | 810 | 163.5 |
| B | 12 | 111 | 20848 | 122.52 | 832 | 810 | 163.5 |
| B | 11 | 111 | 18728 | 109.56 | 832 | 810 | 163.5 |
| C | 14 | 238 | 127635 | 667.96 | 804 | 809 | 189.9 |
| C | 4 | 224 | 29412 | 150.65 | 804 | 809 | 189.9 |
| C | 7 | 220 | 7438 | 34.91 | 804 | 809 | 189.9 |
| D | 1 | 52 | 3029482 | 16419.64 | 767 | 745 | 184.5 |
| D | 8 | 195 | 1237248 | 6703.43 | 767 | 745 | 184.5 |
| D | 2 | 250 | 71001 | 380.88 | 767 | 745 | 184.5 |
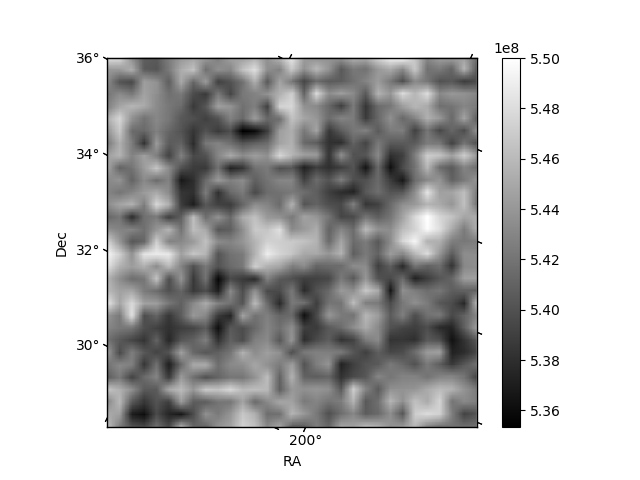
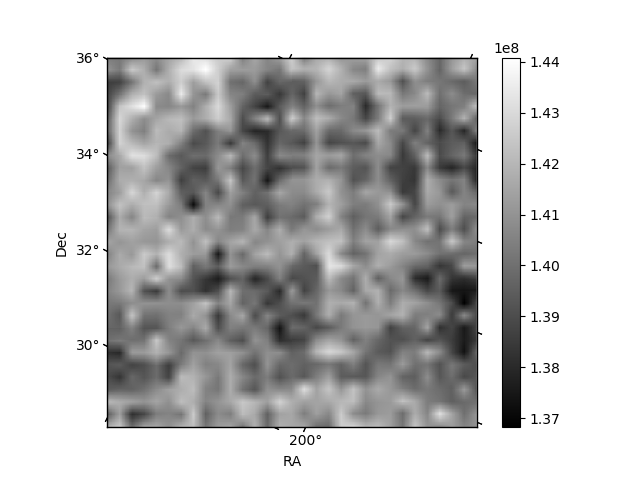
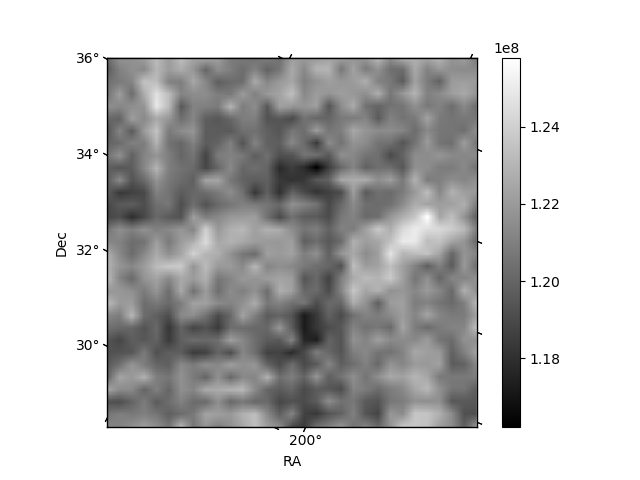
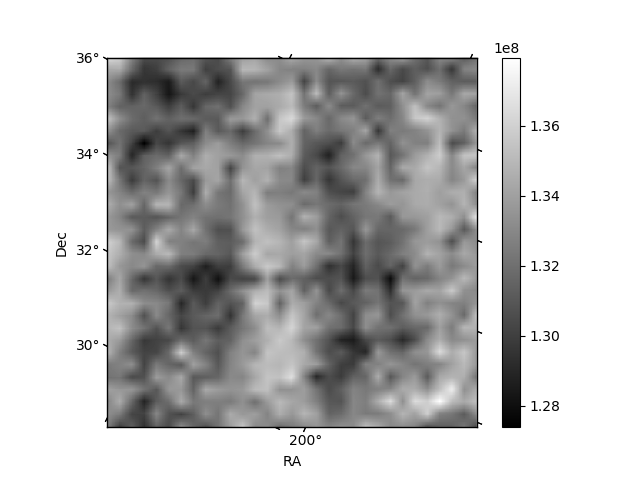
Histogram calculated using DETX and DETY for each event in the final _common_clean file
| Quadrant A | 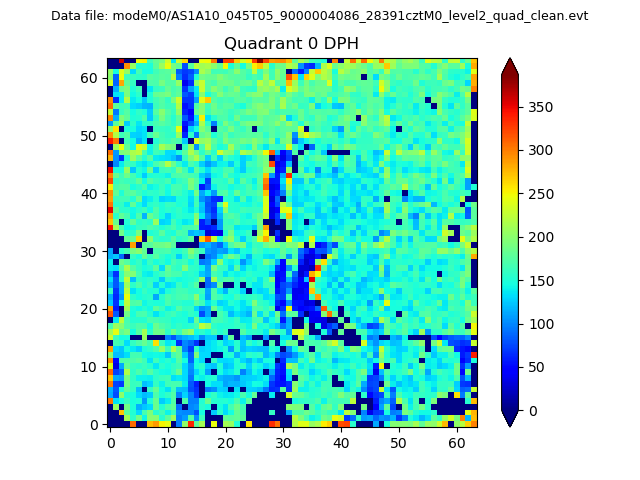 |
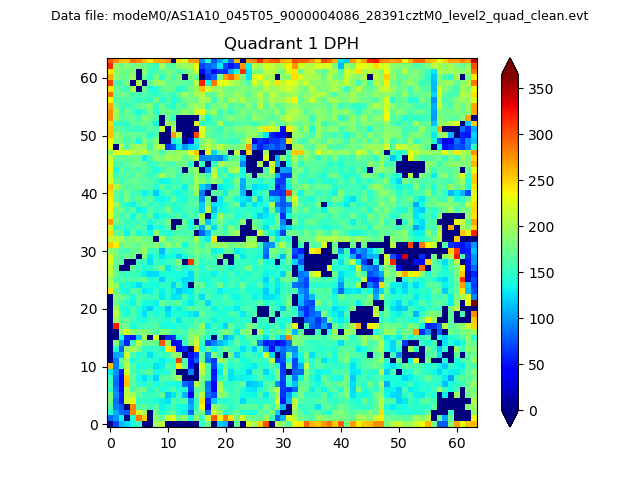 |
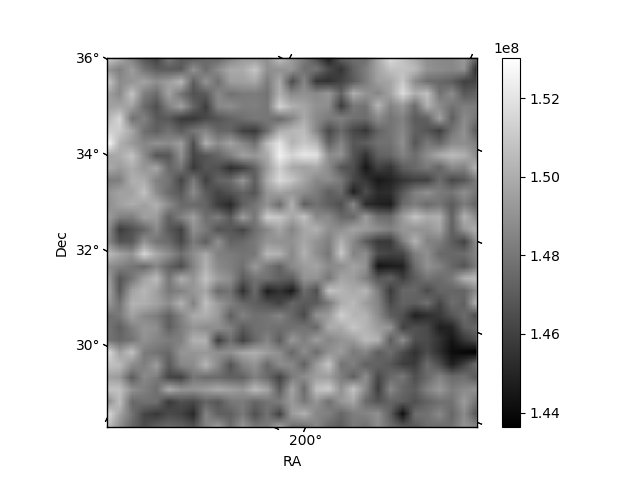
Quadrant B |
|---|---|---|---|
| Quadrant D | 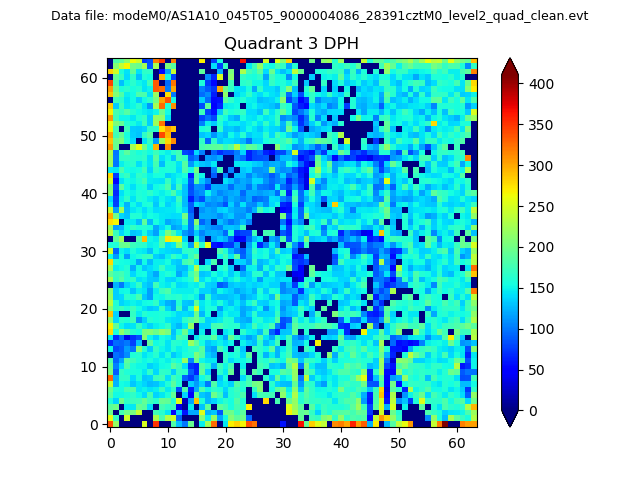 |
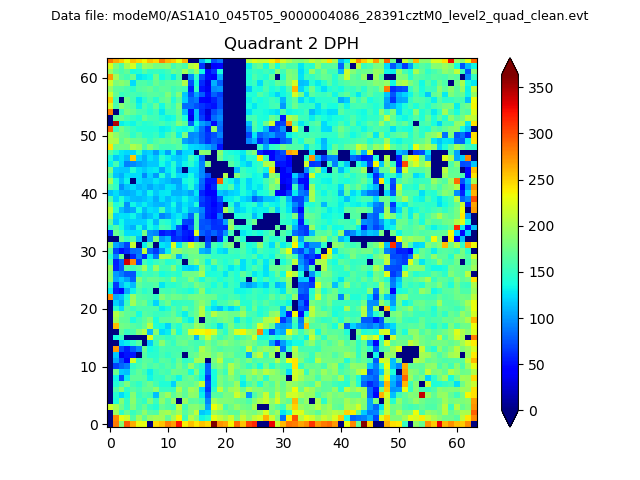 |
Quadrant C |
| Plot type | Count rate plots | Images |
|---|---|---|
| Comparison with Poisson distribution Blue bars denote a histogram of data divided into 1 sec bins. Red curve is a Poisson curve with rate = median count rate of data. |
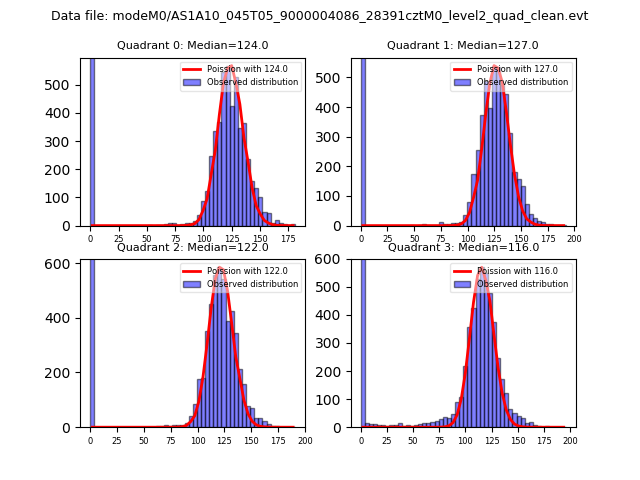 |
 |
| Quadrant-wise count rates Data is divided into 100 sec bins |
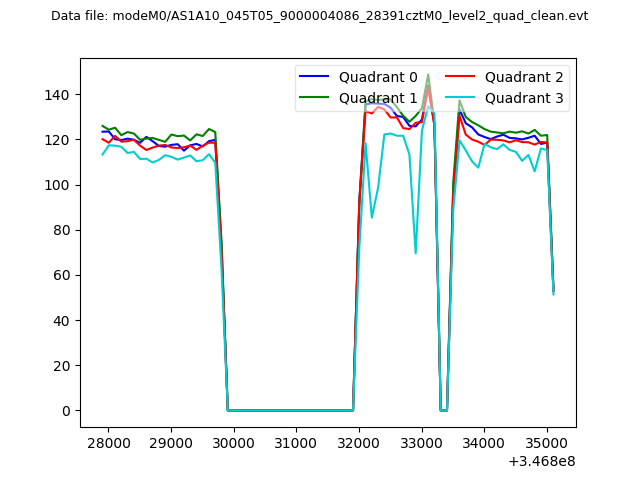 |
|
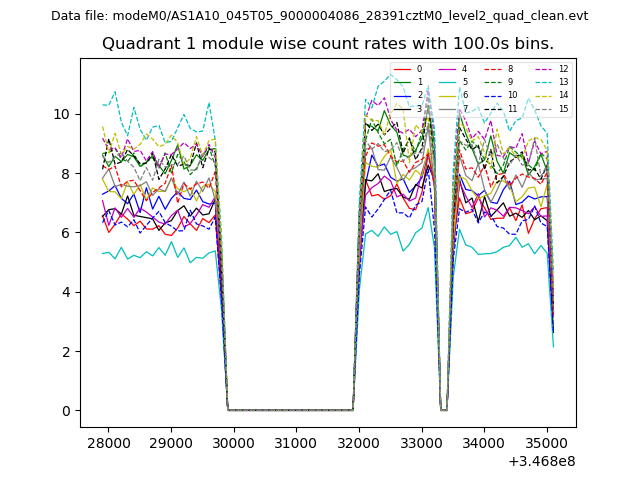
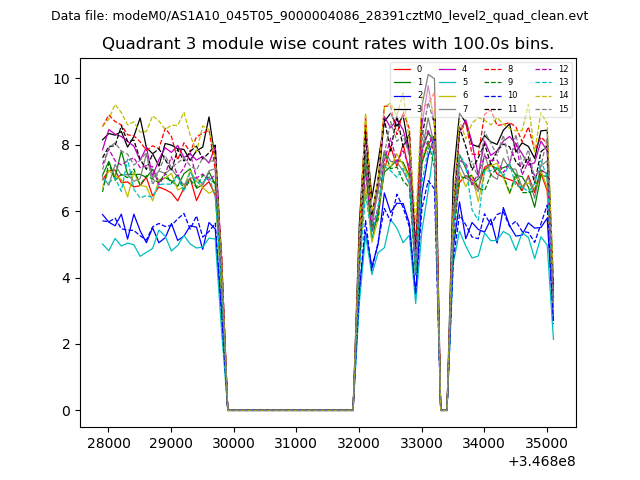
| Module-wise count rates for Quadrant A Data is divided into 100 sec bins |
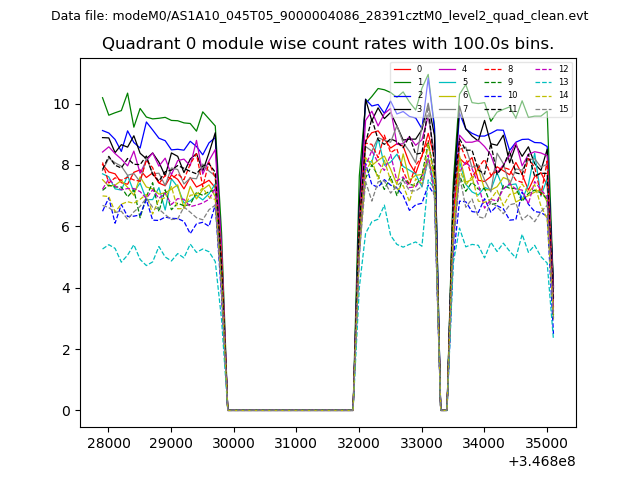 |
 |
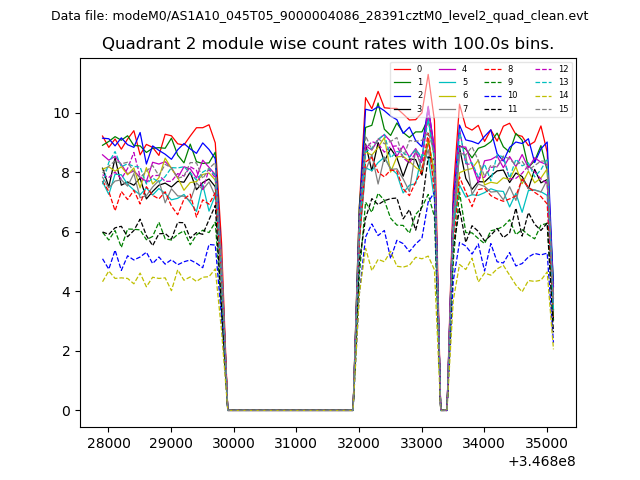
| Module-wise count rates for Quadrant B Data is divided into 100 sec bins |
 |
 |
| Module-wise count rates for Quadrant C Data is divided into 100 sec bins |
 |
 |
| Module-wise count rates for Quadrant D Data is divided into 100 sec bins |
 |
 |
| Parameter | Plot |
|---|---|
| CZT HV Monitor | 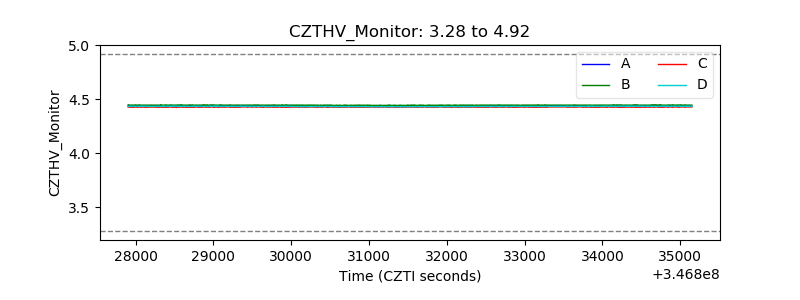 |
| D_VDD | 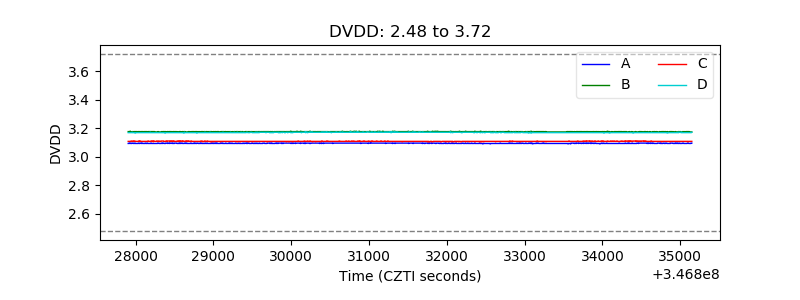 |
| Temperature 1 | 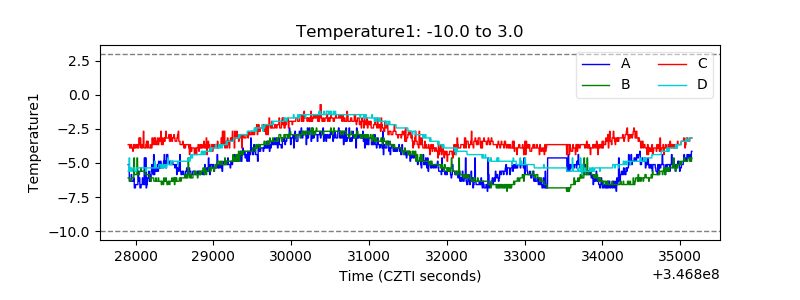 |
| Veto HV Monitor | 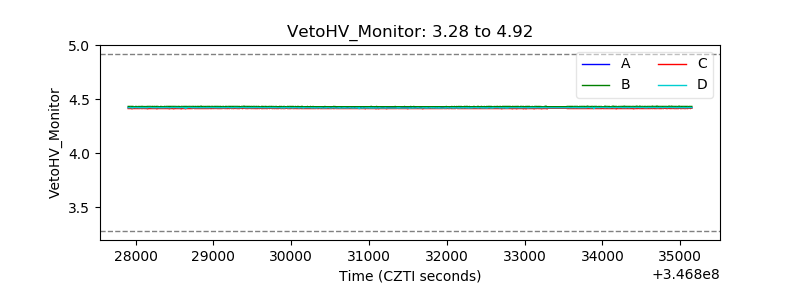 |
| Veto LLD | 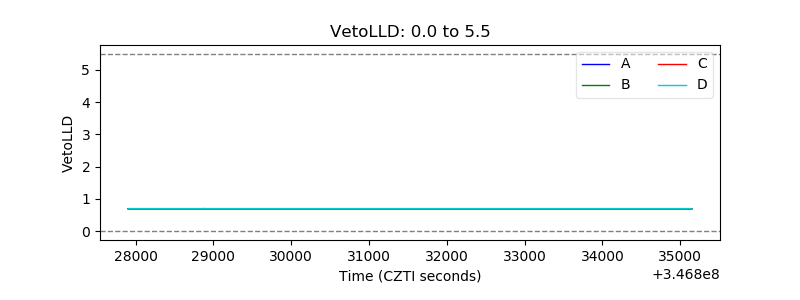 |
| Alpha Counter | 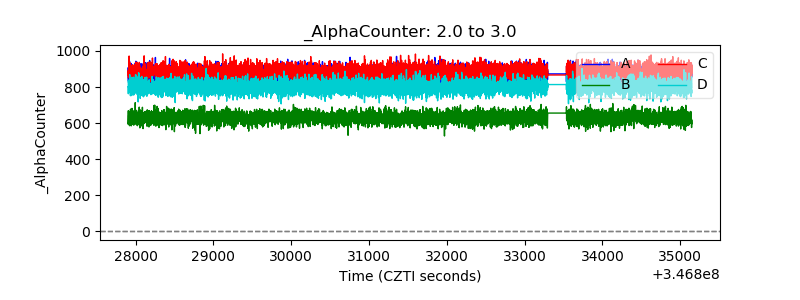 |
| _CPM_Rate | 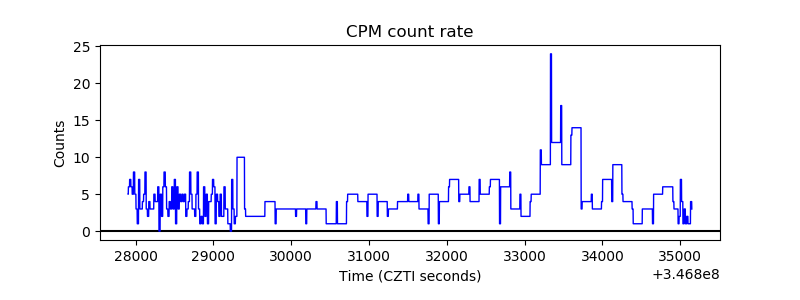 |
| CZT Counter | 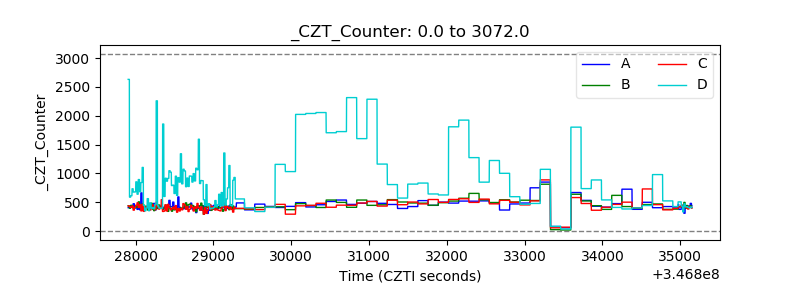 |
| +2.5 Volts monitor | 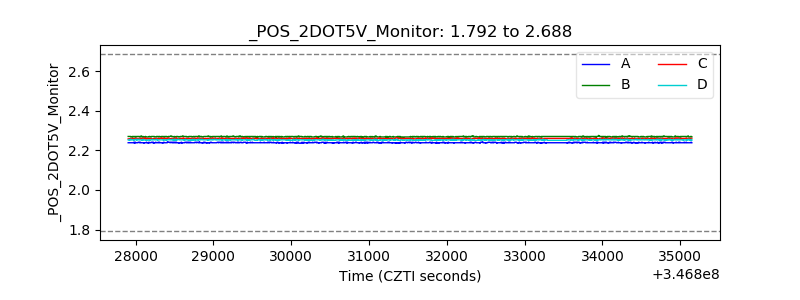 |
| +5 Volts monitor | 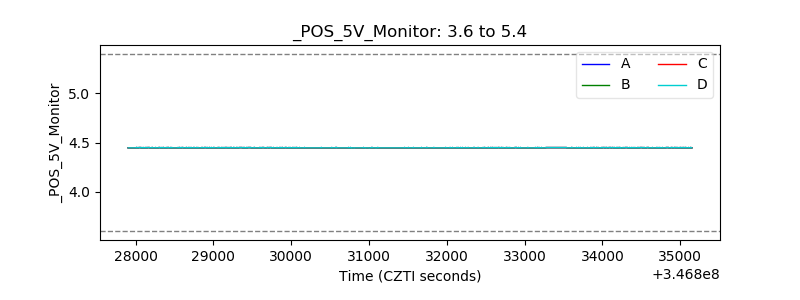 |
| _ROLL_ROT | 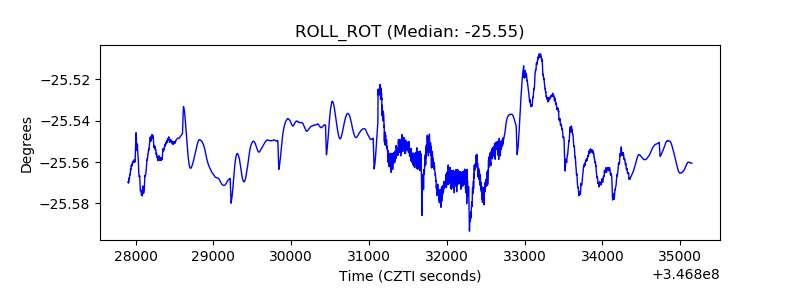 |
| _Roll_DEC | 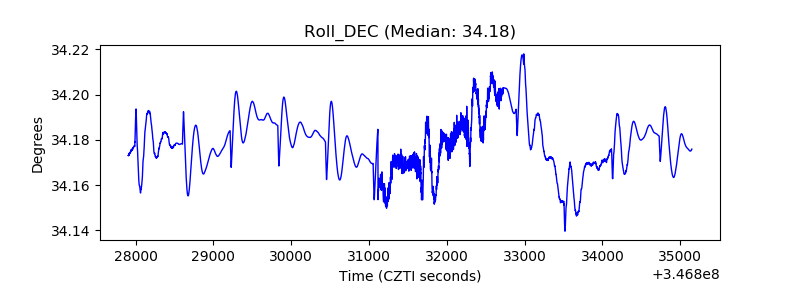 |
| _Roll_RA | 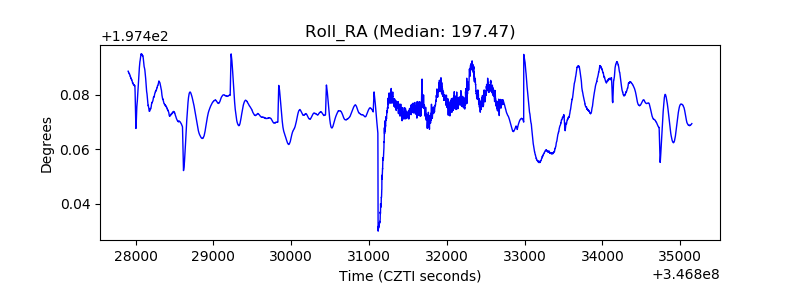 |
| Veto Counter | 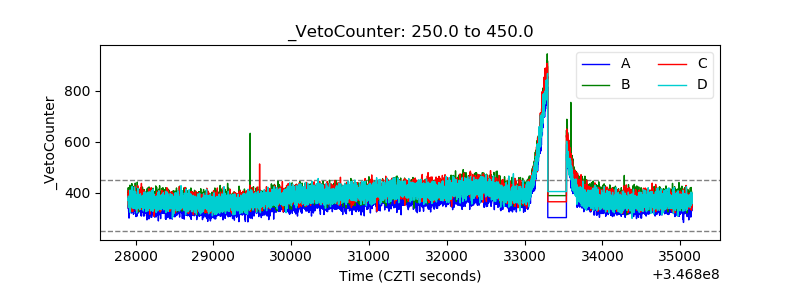 |