| Param | Original file | Final file |
|---|---|---|
| Filename | modeM0/AS1A10_045T05_9000004086_28393cztM0_level2.evt | modeM0/AS1A10_045T05_9000004086_28393cztM0_level2_quad_clean.evt |
| Size (bytes) | 978,171,840 | 153,025,920 |
| Size | 932.9 MB | 145.9 MB |
| Events in quadrant A | 5,754,913 | 956,420 |
| Events in quadrant B | 5,969,593 | 983,620 |
| Events in quadrant C | 5,979,581 | 942,494 |
| Events in quadrant D | 11,085,596 | 898,158 |
| Mode M0 | |||
|---|---|---|---|
| Quadrant | BADHDUFLAG | Total packets | Discarded packets |
| A | 0 | 25054 | 0 |
| B | 0 | 25454 | 0 |
| C | 0 | 25888 | 0 |
| D | 0 | 41416 | 0 |
| Mode M9 | |||
|---|---|---|---|
| Quadrant | BADHDUFLAG | Total packets | Discarded packets |
| A | 0 | 11 | 0 |
| B | 0 | 11 | 0 |
| C | 0 | 11 | 0 |
| D | 0 | 11 | 0 |
| Quadrant | Total seconds | Saturated seconds | Saturation percentage |
|---|---|---|---|
| A | 12349 | 116 | 0.939347% |
| B | 12349 | 152 | 1.230869% |
| C | 12350 | 174 | 1.408907% |
| D | 12350 | 875 | 7.085020% |
Noise dominated data is calculated using 1-second bins in cleaned event files. If a bin has >2000 counts, and if more than 50% of those come from <1% of pixels, then it is considered to be noise-dominated and hence unusable.
| Quadrant | # 1 sec bins | Bins with >0 counts | Bins with >2000 counts | High rate bins dominated by noise | Noise dominated (total time) | Noise dominated (detector-on time) | Marked lightcurve |
|---|---|---|---|---|---|---|---|
| A | 13439 | 12350 | 0 | 0 | 0.00% | 0.00% | 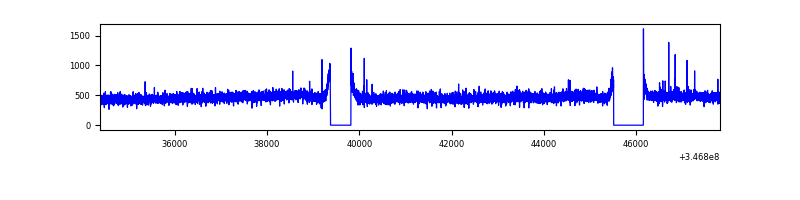 |
| B | 13439 | 12349 | 14 | 14 | 0.10% | 0.11% | 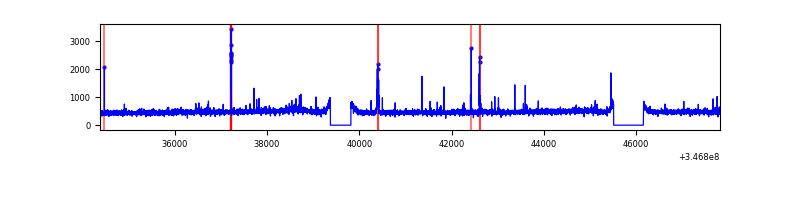 |
| C | 13440 | 12351 | 0 | 0 | 0.00% | 0.00% | 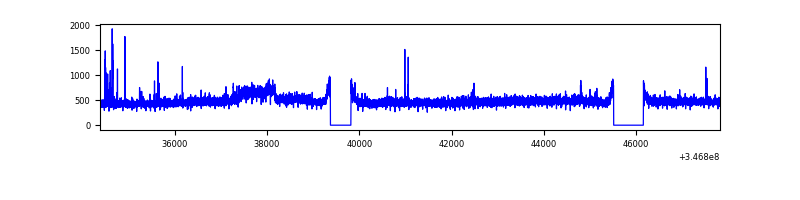 |
| D | 13440 | 12351 | 693 | 693 | 5.16% | 5.61% | 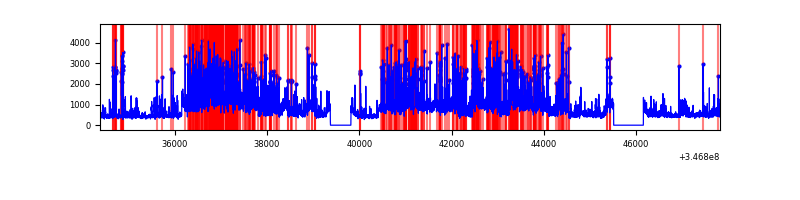 |
Top three noisy pixels from each quadrant. If the there are fewer than three noisy pixels in the level2.evt file, extra rows are filled as -1
| Pixel properties | Quadrant properties | ||||||
|---|---|---|---|---|---|---|---|
| Quadrant | DetID | PixID | Counts | Sigma | Mean | Median | Sigma |
| A | 13 | 254 | 18701 | 57.16 | 1485 | 1449 | 301.8 |
| A | 3 | 137 | 15129 | 45.33 | 1485 | 1449 | 301.8 |
| A | 0 | 226 | 12749 | 37.44 | 1485 | 1449 | 301.8 |
| B | 10 | 245 | 96998 | 334.4 | 1471 | 1428 | 285.8 |
| B | 0 | 230 | 46420 | 157.43 | 1471 | 1428 | 285.8 |
| B | 12 | 111 | 36380 | 122.3 | 1471 | 1428 | 285.8 |
| C | 14 | 238 | 227169 | 672.59 | 1423 | 1428 | 335.6 |
| C | 3 | 233 | 149721 | 441.84 | 1423 | 1428 | 335.6 |
| C | 4 | 224 | 39199 | 112.54 | 1423 | 1428 | 335.6 |
| D | 8 | 195 | 2843635 | 8347.73 | 1406 | 1366 | 340.5 |
| D | 1 | 52 | 2716619 | 7974.69 | 1406 | 1366 | 340.5 |
| D | 13 | 168 | 105384 | 305.5 | 1406 | 1366 | 340.5 |
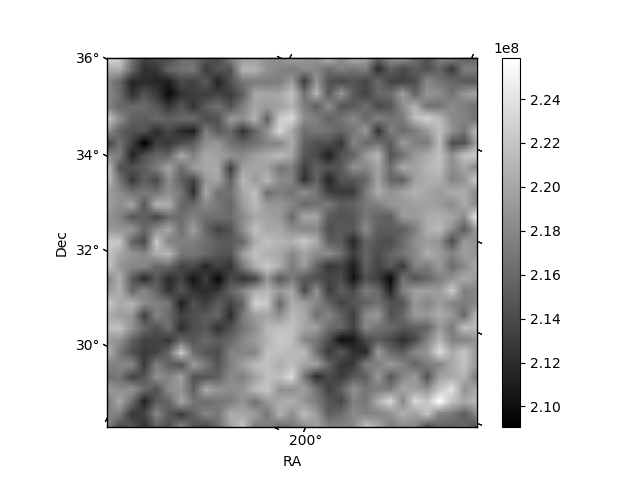
Histogram calculated using DETX and DETY for each event in the final _common_clean file
| Quadrant A | 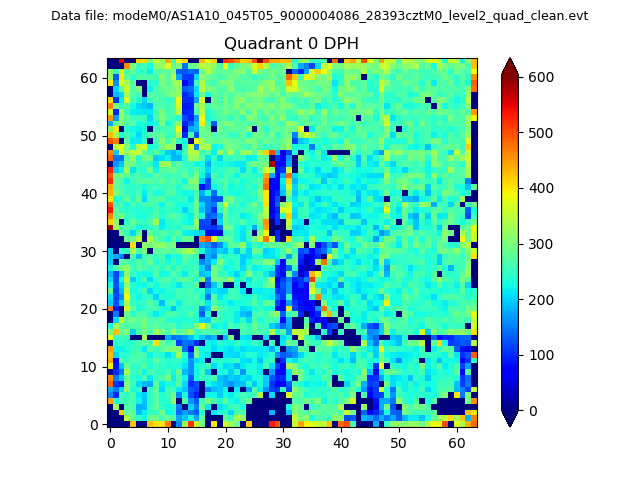 |
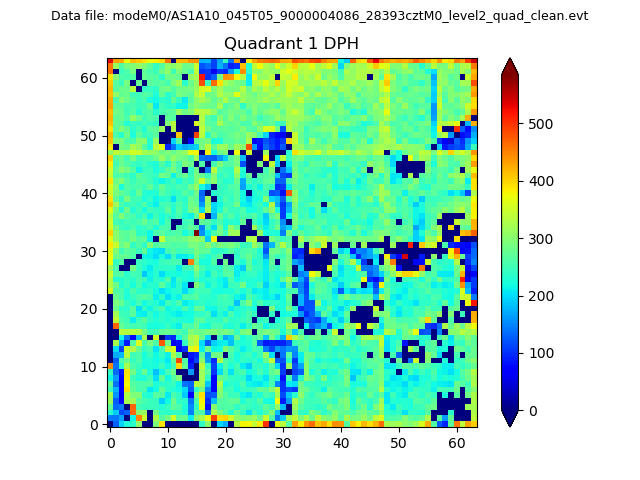 |
Quadrant B |
|---|---|---|---|
| Quadrant D |  |
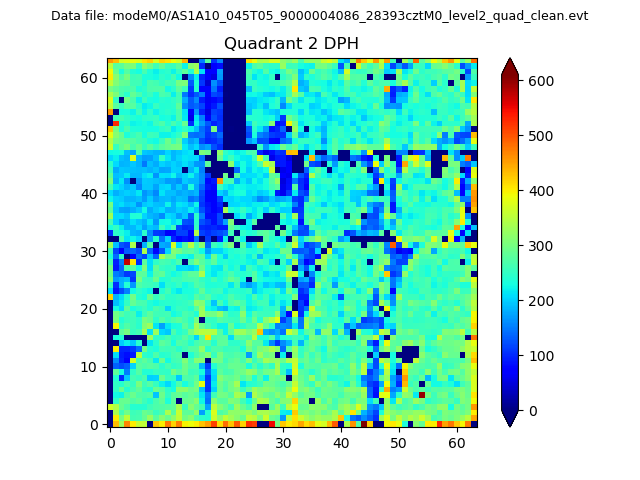 |
Quadrant C |
| Plot type | Count rate plots | Images |
|---|---|---|
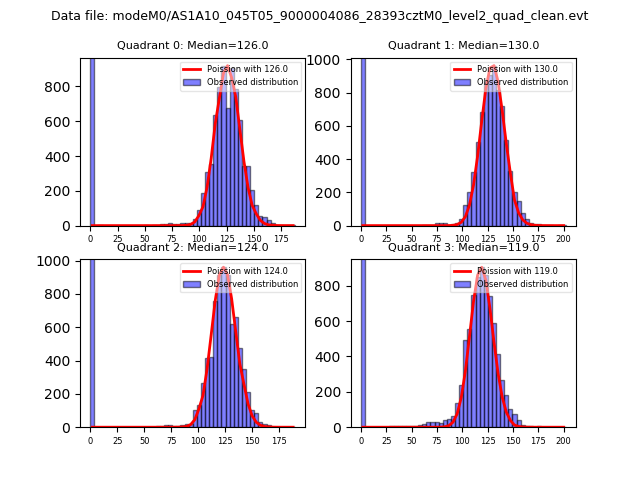
| Comparison with Poisson distribution Blue bars denote a histogram of data divided into 1 sec bins. Red curve is a Poisson curve with rate = median count rate of data. |
 |
 |
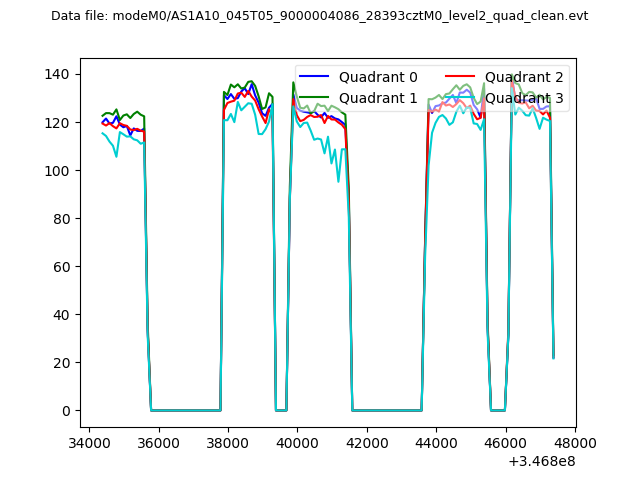
| Quadrant-wise count rates Data is divided into 100 sec bins |
 |
|
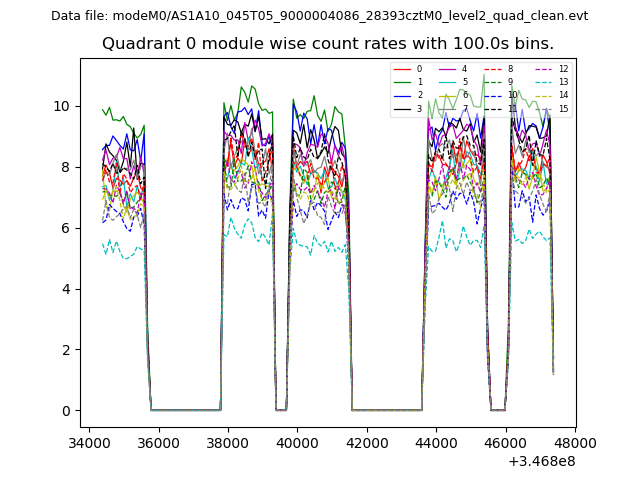
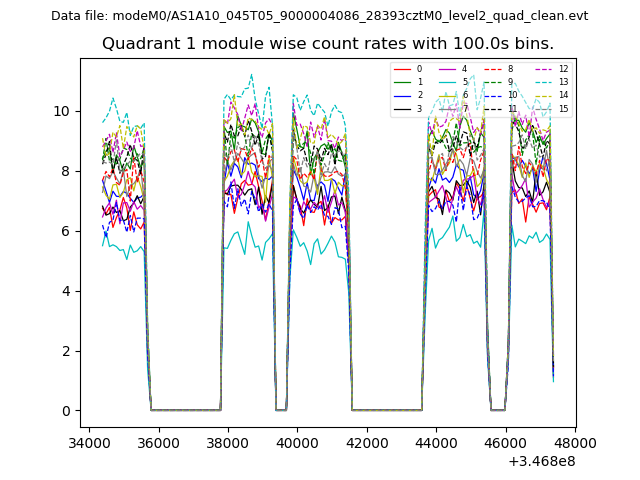
| Module-wise count rates for Quadrant A Data is divided into 100 sec bins |
 |
 |
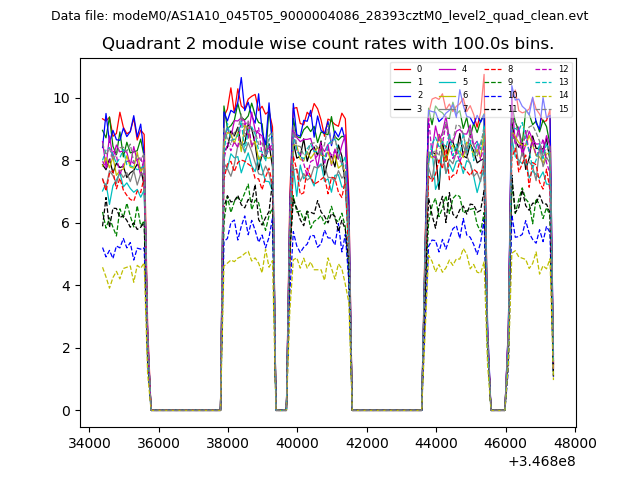
| Module-wise count rates for Quadrant B Data is divided into 100 sec bins |
 |
 |
| Module-wise count rates for Quadrant C Data is divided into 100 sec bins |
 |
 |
| Module-wise count rates for Quadrant D Data is divided into 100 sec bins |
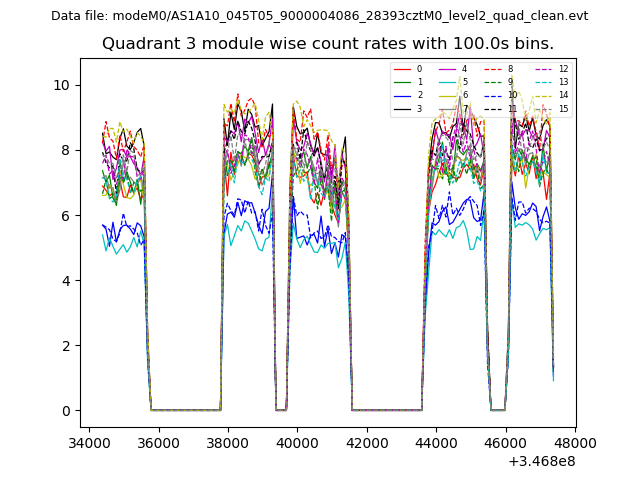 |
 |
| Parameter | Plot |
|---|---|
| CZT HV Monitor | 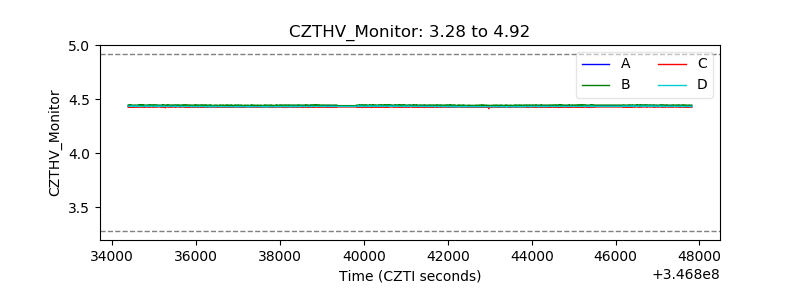 |
| D_VDD | 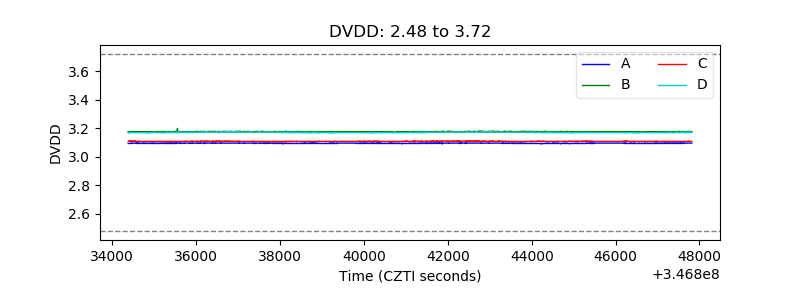 |
| Temperature 1 | 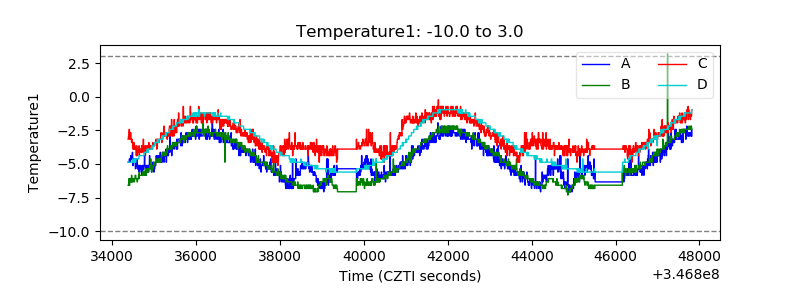 |
| Veto HV Monitor | 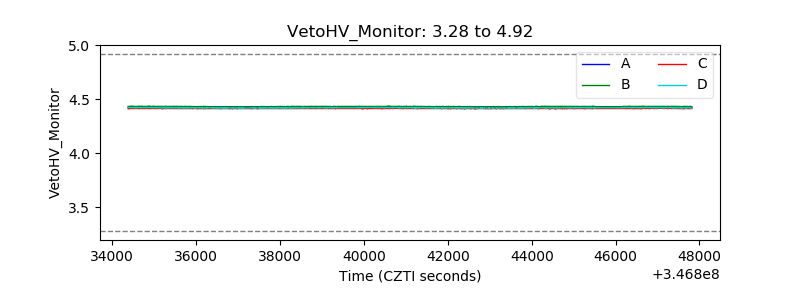 |
| Veto LLD | 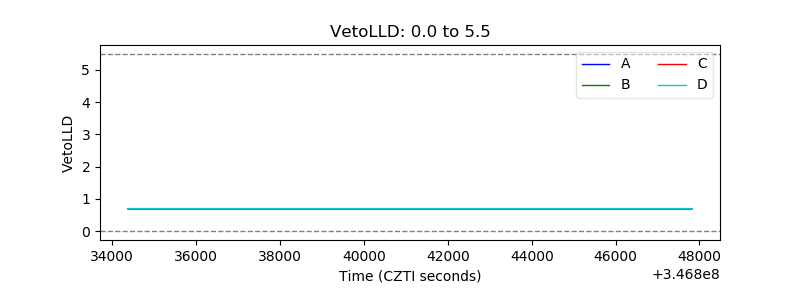 |
| Alpha Counter | 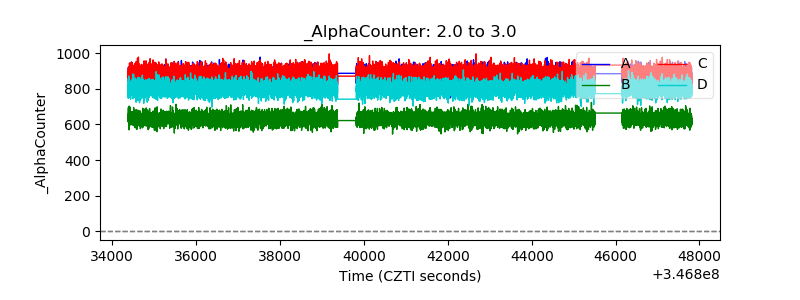 |
| _CPM_Rate | 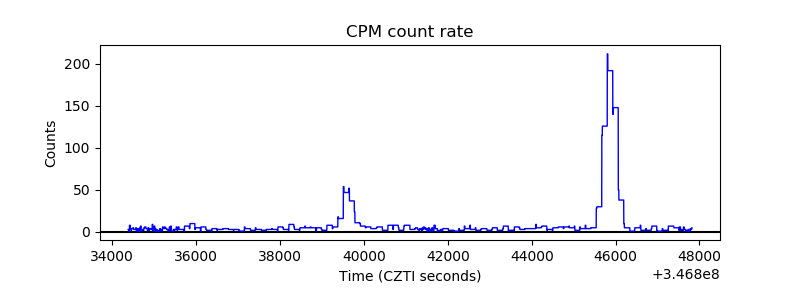 |
| CZT Counter | 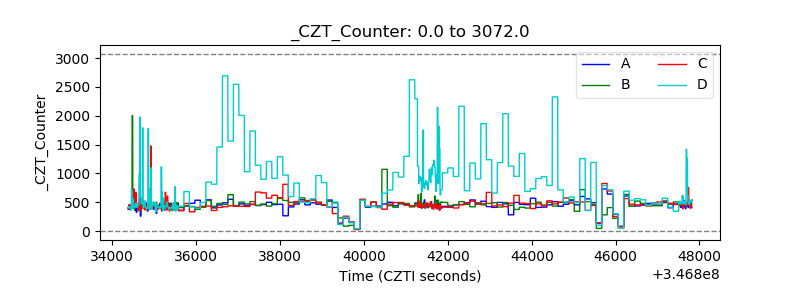 |
| +2.5 Volts monitor | 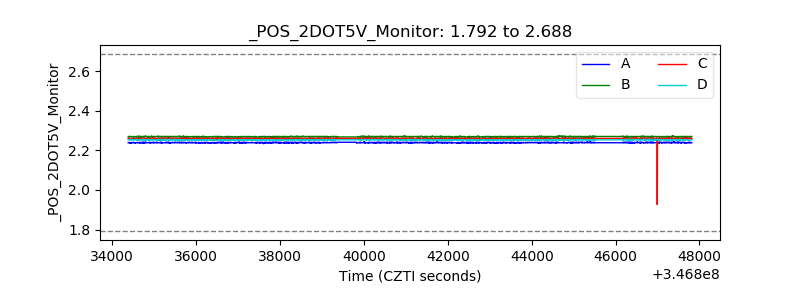 |
| +5 Volts monitor |  |
| _ROLL_ROT | 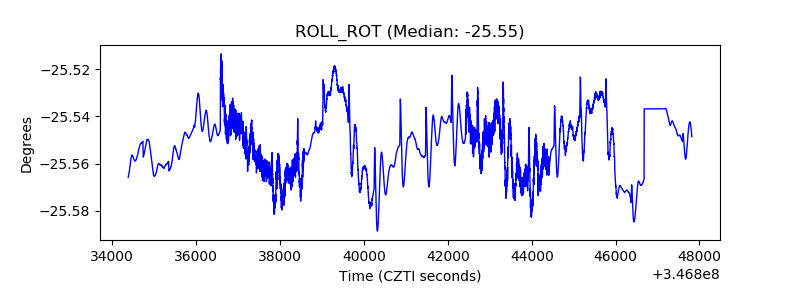 |
| _Roll_DEC | 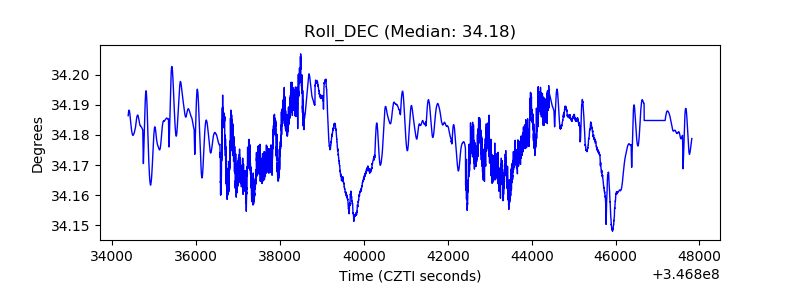 |
| _Roll_RA | 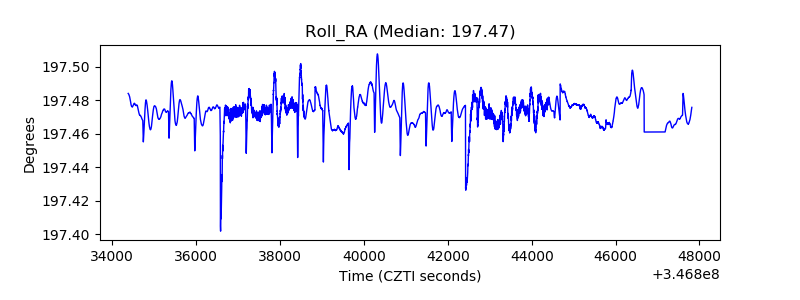 |
| Veto Counter | 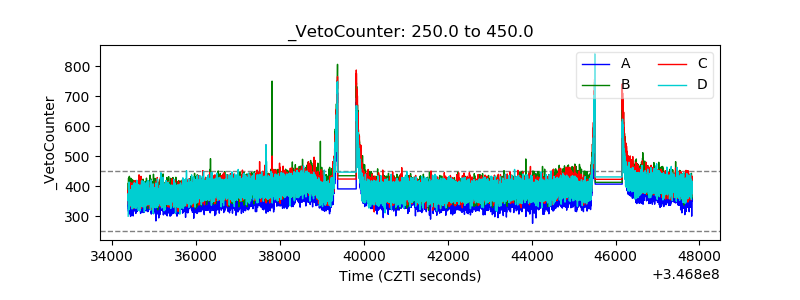 |