| Param | Original file | Final file |
|---|---|---|
| Filename | modeM0/AS1A10_045T05_9000004086_28394cztM0_level2.evt | modeM0/AS1A10_045T05_9000004086_28394cztM0_level2_quad_clean.evt |
| Size (bytes) | 509,143,680 | 70,752,960 |
| Size | 485.6 MB | 67.5 MB |
| Events in quadrant A | 2,929,490 | 437,972 |
| Events in quadrant B | 2,942,535 | 448,110 |
| Events in quadrant C | 2,931,178 | 430,595 |
| Events in quadrant D | 6,202,675 | 399,921 |
| Mode M0 | |||
|---|---|---|---|
| Quadrant | BADHDUFLAG | Total packets | Discarded packets |
| A | 0 | 12508 | 0 |
| B | 0 | 12413 | 0 |
| C | 0 | 12444 | 0 |
| D | 0 | 22584 | 0 |
| Mode M9 | |||
|---|---|---|---|
| Quadrant | BADHDUFLAG | Total packets | Discarded packets |
| A | 0 | 9 | 0 |
| B | 0 | 9 | 0 |
| C | 0 | 9 | 0 |
| D | 0 | 9 | 0 |
| Quadrant | Total seconds | Saturated seconds | Saturation percentage |
|---|---|---|---|
| A | 6102 | 48 | 0.786627% |
| B | 6102 | 45 | 0.737463% |
| C | 6102 | 66 | 1.081613% |
| D | 6102 | 698 | 11.438873% |
Noise dominated data is calculated using 1-second bins in cleaned event files. If a bin has >2000 counts, and if more than 50% of those come from <1% of pixels, then it is considered to be noise-dominated and hence unusable.
| Quadrant | # 1 sec bins | Bins with >0 counts | Bins with >2000 counts | High rate bins dominated by noise | Noise dominated (total time) | Noise dominated (detector-on time) | Marked lightcurve |
|---|---|---|---|---|---|---|---|
| A | 6947 | 6102 | 3 | 3 | 0.04% | 0.05% | 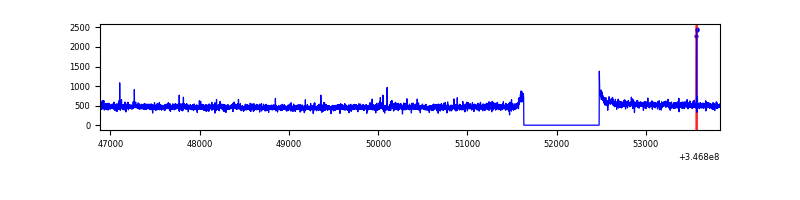 |
| B | 6947 | 6102 | 0 | 0 | 0.00% | 0.00% | 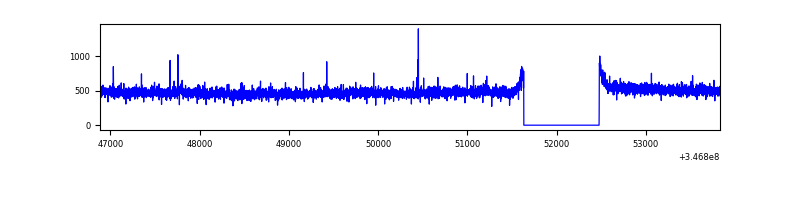 |
| C | 6947 | 6102 | 0 | 0 | 0.00% | 0.00% | 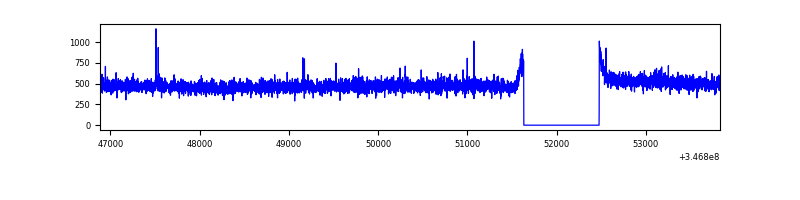 |
| D | 6946 | 6101 | 569 | 569 | 8.19% | 9.33% | 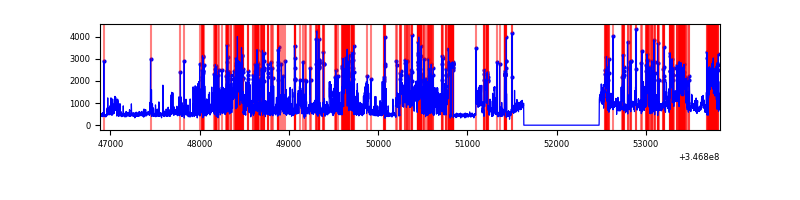 |
Top three noisy pixels from each quadrant. If the there are fewer than three noisy pixels in the level2.evt file, extra rows are filled as -1
| Pixel properties | Quadrant properties | ||||||
|---|---|---|---|---|---|---|---|
| Quadrant | DetID | PixID | Counts | Sigma | Mean | Median | Sigma |
| A | 12 | 96 | 22796 | 145.03 | 747 | 731 | 152.1 |
| A | 13 | 6 | 13564 | 84.35 | 747 | 731 | 152.1 |
| A | 13 | 254 | 10065 | 61.35 | 747 | 731 | 152.1 |
| B | 0 | 230 | 20779 | 139.9 | 740 | 720 | 143.4 |
| B | 12 | 111 | 17691 | 118.36 | 740 | 720 | 143.4 |
| B | 10 | 245 | 16531 | 110.27 | 740 | 720 | 143.4 |
| C | 14 | 238 | 115861 | 675.93 | 719 | 722 | 170.3 |
| C | 7 | 220 | 13264 | 73.63 | 719 | 722 | 170.3 |
| C | 13 | 61 | 4928 | 24.69 | 719 | 722 | 170.3 |
| D | 1 | 52 | 2854724 | 17101.76 | 699 | 678 | 166.9 |
| D | 8 | 195 | 609106 | 3645.77 | 699 | 678 | 166.9 |
| D | 2 | 250 | 67726 | 401.76 | 699 | 678 | 166.9 |
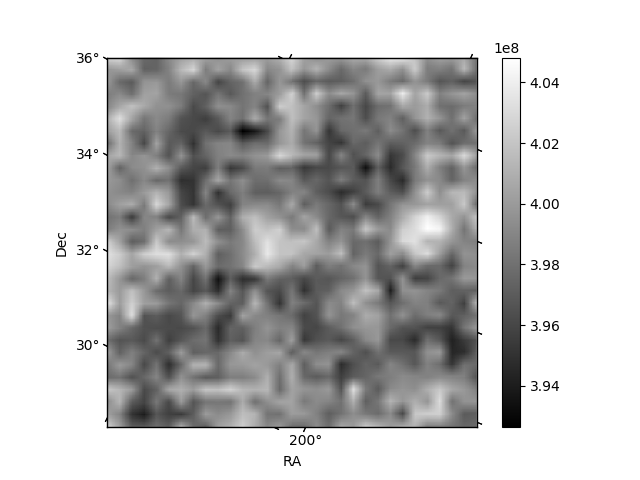
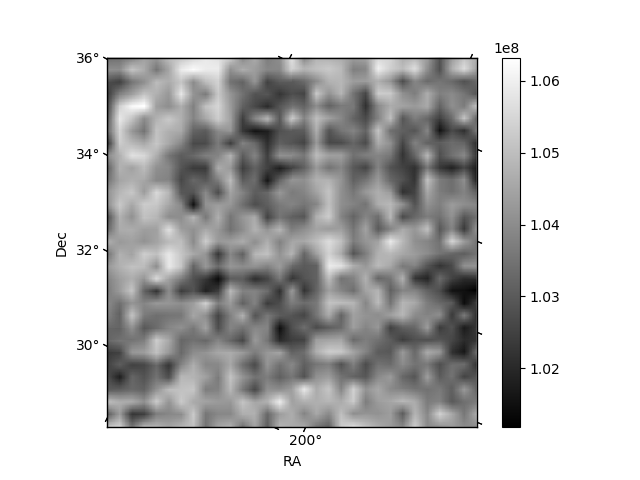
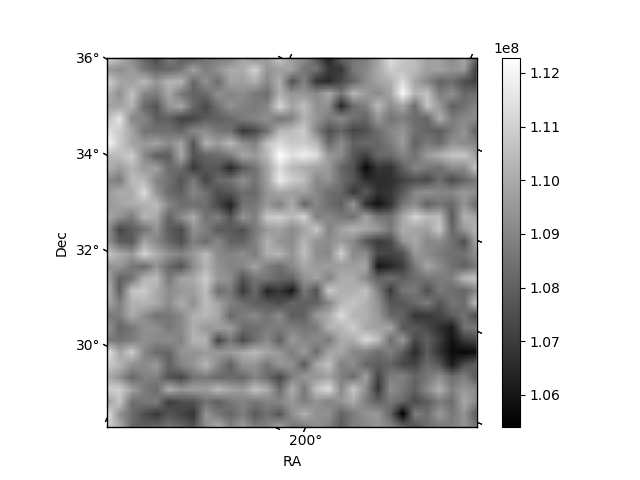
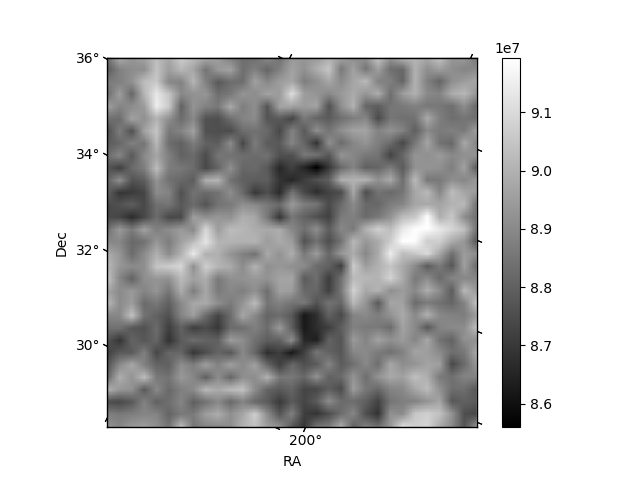
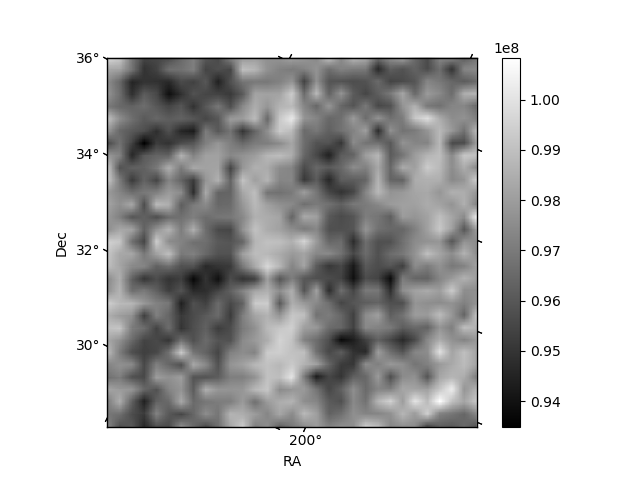
Histogram calculated using DETX and DETY for each event in the final _common_clean file
| Quadrant A | 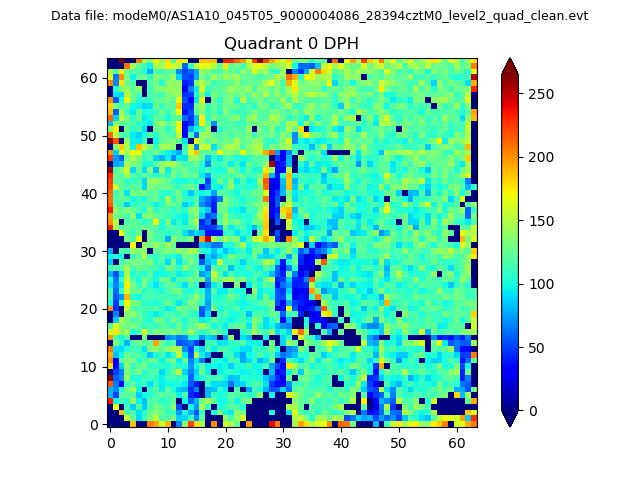 |
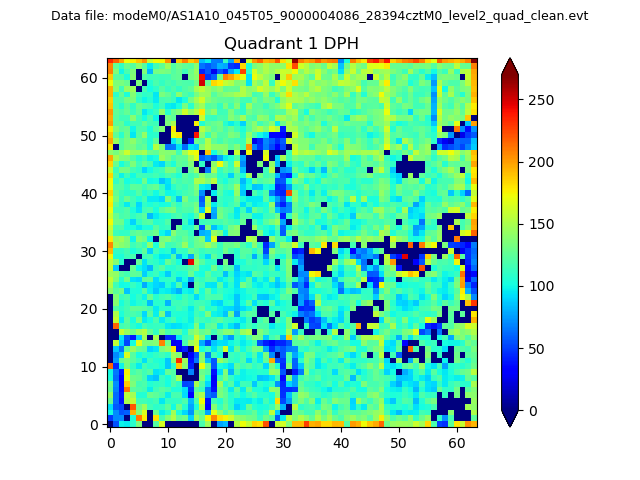 |
Quadrant B |
|---|---|---|---|
| Quadrant D |  |
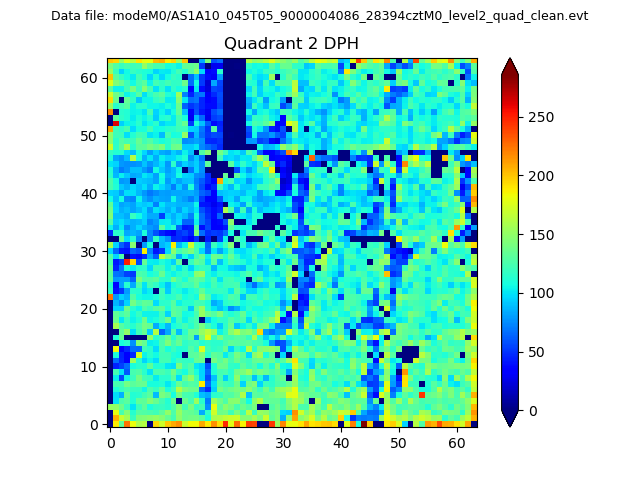 |
Quadrant C |
| Plot type | Count rate plots | Images |
|---|---|---|
| Comparison with Poisson distribution Blue bars denote a histogram of data divided into 1 sec bins. Red curve is a Poisson curve with rate = median count rate of data. |
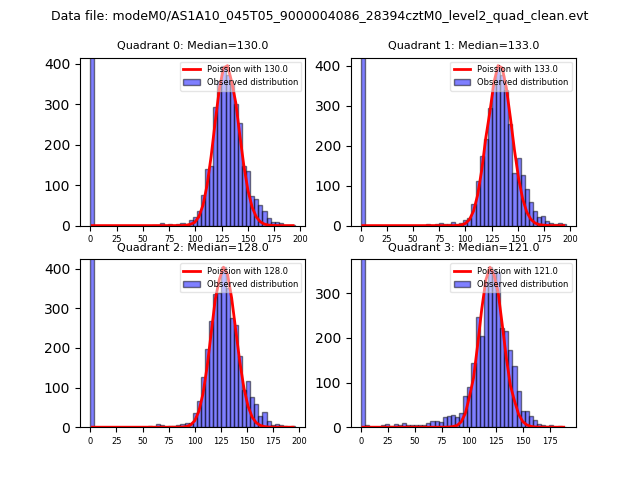 |
 |
| Quadrant-wise count rates Data is divided into 100 sec bins |
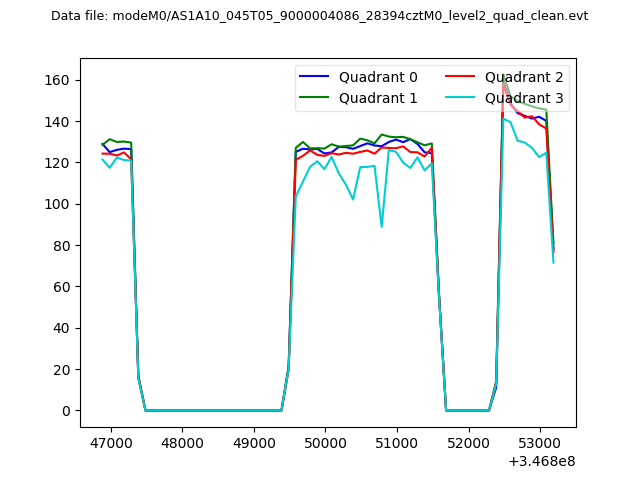 |
|
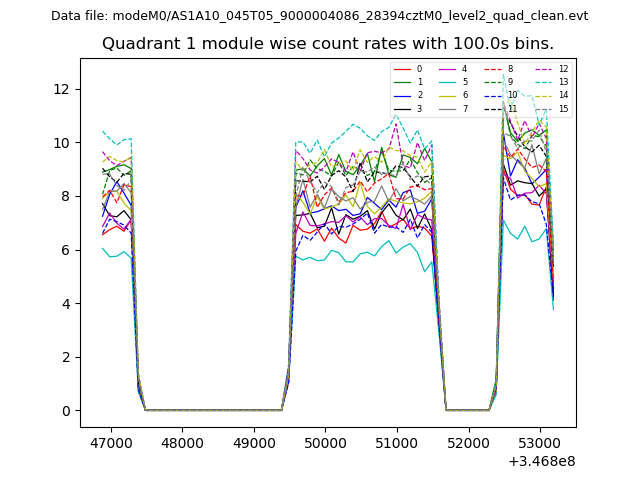
| Module-wise count rates for Quadrant A Data is divided into 100 sec bins |
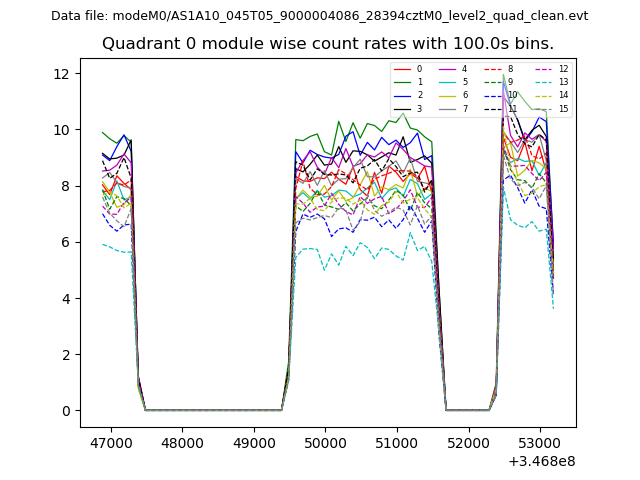 |
 |
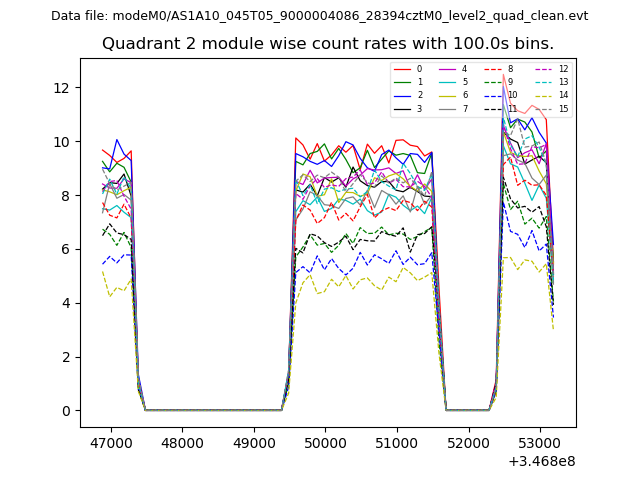
| Module-wise count rates for Quadrant B Data is divided into 100 sec bins |
 |
 |
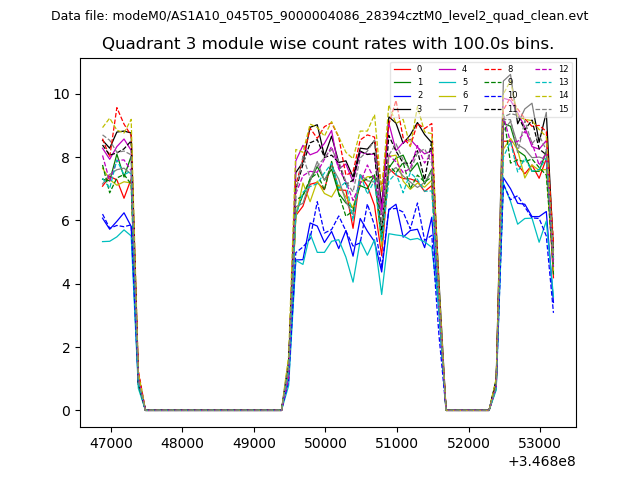
| Module-wise count rates for Quadrant C Data is divided into 100 sec bins |
 |
 |
| Module-wise count rates for Quadrant D Data is divided into 100 sec bins |
 |
 |
| Parameter | Plot |
|---|---|
| CZT HV Monitor | 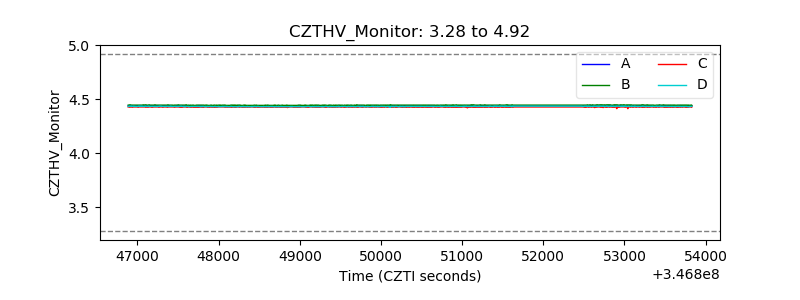 |
| D_VDD | 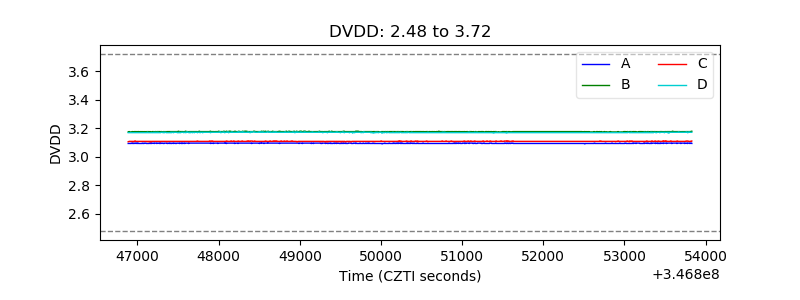 |
| Temperature 1 | 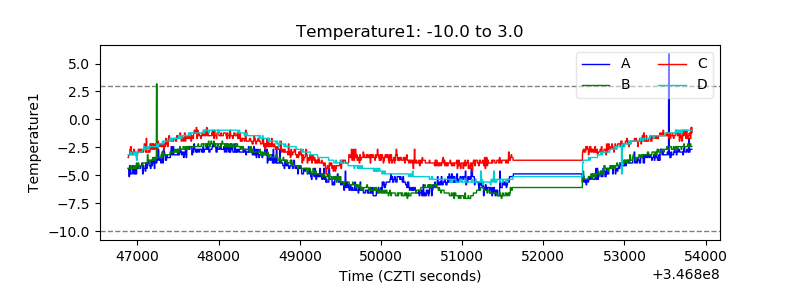 |
| Veto HV Monitor | 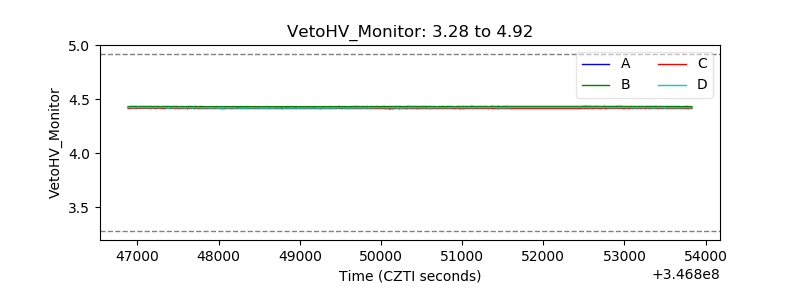 |
| Veto LLD | 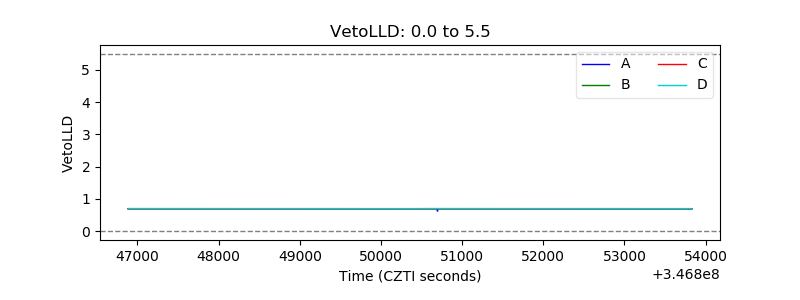 |
| Alpha Counter | 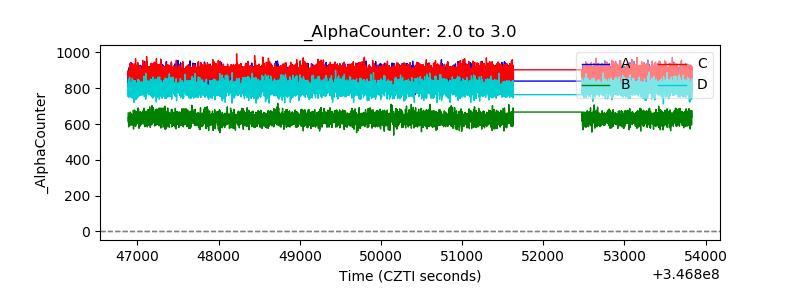 |
| _CPM_Rate | 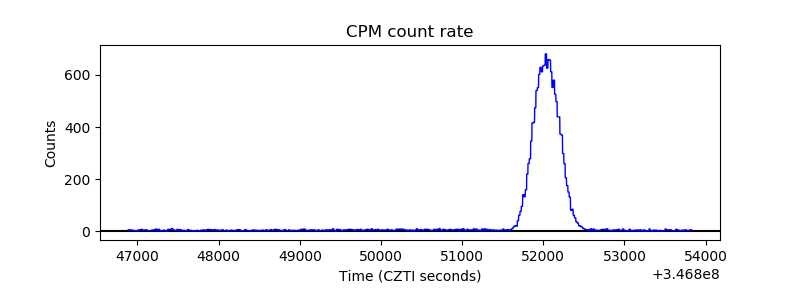 |
| CZT Counter | 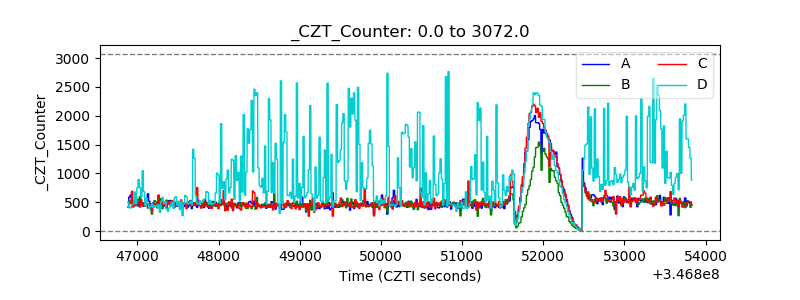 |
| +2.5 Volts monitor |  |
| +5 Volts monitor | 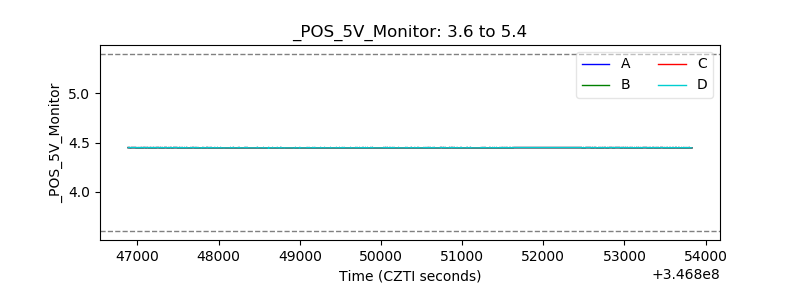 |
| _ROLL_ROT | 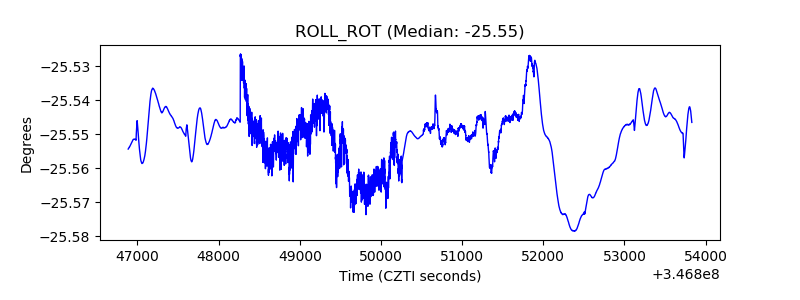 |
| _Roll_DEC | 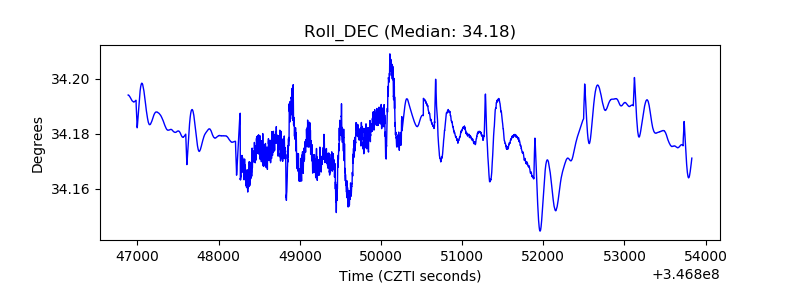 |
| _Roll_RA | 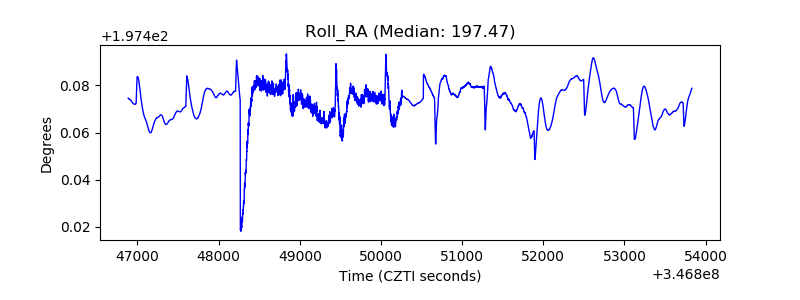 |
| Veto Counter | 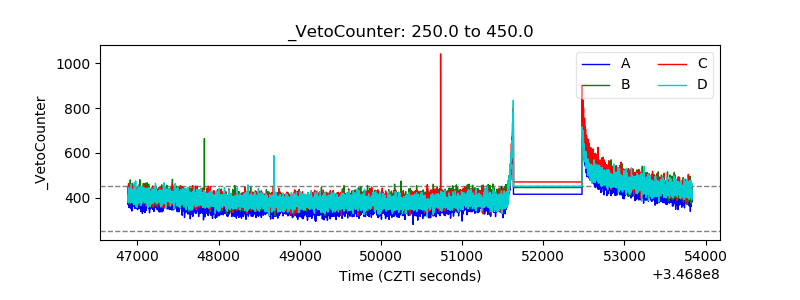 |