| Param | Original file | Final file |
|---|---|---|
| Filename | modeM0/AS1A10_045T05_9000004086_28395cztM0_level2.evt | modeM0/AS1A10_045T05_9000004086_28395cztM0_level2_quad_clean.evt |
| Size (bytes) | 296,648,640 | 27,941,760 |
| Size | 282.9 MB | 26.6 MB |
| Events in quadrant A | 1,583,945 | 155,065 |
| Events in quadrant B | 1,603,448 | 158,030 |
| Events in quadrant C | 1,610,397 | 152,302 |
| Events in quadrant D | 3,956,503 | 141,306 |
| Mode M0 | |||
|---|---|---|---|
| Quadrant | BADHDUFLAG | Total packets | Discarded packets |
| A | 0 | 6810 | 0 |
| B | 0 | 6825 | 0 |
| C | 0 | 6815 | 0 |
| D | 0 | 14108 | 0 |
| Quadrant | Total seconds | Saturated seconds | Saturation percentage |
|---|---|---|---|
| A | 3368 | 4 | 0.118765% |
| B | 3368 | 1 | 0.029691% |
| C | 3368 | 24 | 0.712589% |
| D | 3368 | 527 | 15.647268% |
Noise dominated data is calculated using 1-second bins in cleaned event files. If a bin has >2000 counts, and if more than 50% of those come from <1% of pixels, then it is considered to be noise-dominated and hence unusable.
| Quadrant | # 1 sec bins | Bins with >0 counts | Bins with >2000 counts | High rate bins dominated by noise | Noise dominated (total time) | Noise dominated (detector-on time) | Marked lightcurve |
|---|---|---|---|---|---|---|---|
| A | 3368 | 3368 | 3 | 3 | 0.09% | 0.09% | 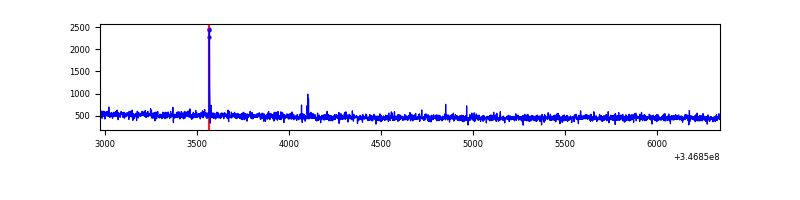 |
| B | 3368 | 3368 | 0 | 0 | 0.00% | 0.00% | 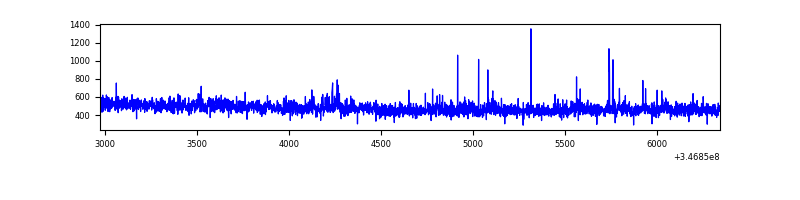 |
| C | 3368 | 3368 | 0 | 0 | 0.00% | 0.00% | 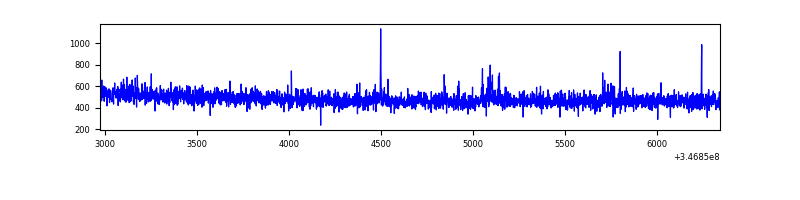 |
| D | 3368 | 3368 | 457 | 457 | 13.57% | 13.57% | 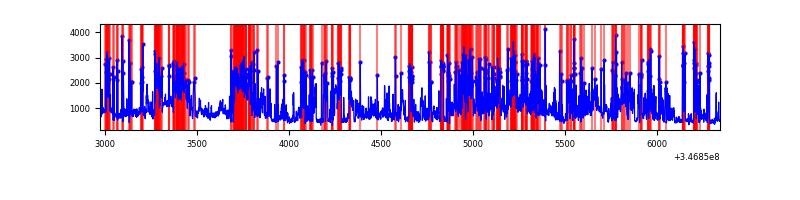 |
Top three noisy pixels from each quadrant. If the there are fewer than three noisy pixels in the level2.evt file, extra rows are filled as -1
| Pixel properties | Quadrant properties | ||||||
|---|---|---|---|---|---|---|---|
| Quadrant | DetID | PixID | Counts | Sigma | Mean | Median | Sigma |
| A | 12 | 96 | 10511 | 121.85 | 405 | 396 | 83.0 |
| A | 6 | 16 | 6611 | 74.87 | 405 | 396 | 83.0 |
| A | 13 | 254 | 5655 | 63.35 | 405 | 396 | 83.0 |
| B | 10 | 245 | 29114 | 365.79 | 400 | 389 | 78.5 |
| B | 12 | 111 | 9468 | 115.61 | 400 | 389 | 78.5 |
| B | 11 | 111 | 8759 | 106.59 | 400 | 389 | 78.5 |
| C | 14 | 238 | 67733 | 725.31 | 391 | 394 | 92.8 |
| C | 7 | 220 | 9965 | 103.09 | 391 | 394 | 92.8 |
| C | 14 | 254 | 6823 | 69.25 | 391 | 394 | 92.8 |
| D | 1 | 52 | 1979964 | 21617.17 | 374 | 362 | 91.6 |
| D | 8 | 195 | 499608 | 5451.74 | 374 | 362 | 91.6 |
| D | 2 | 250 | 32789 | 354.1 | 374 | 362 | 91.6 |
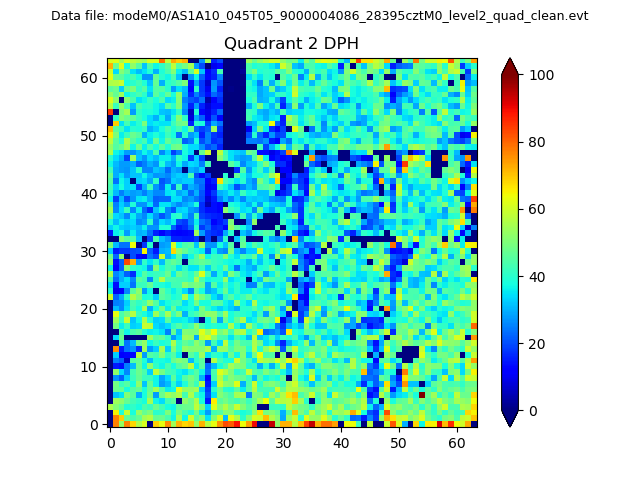
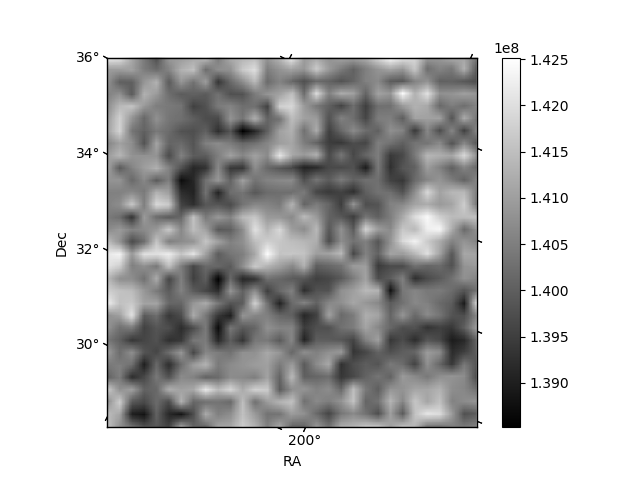
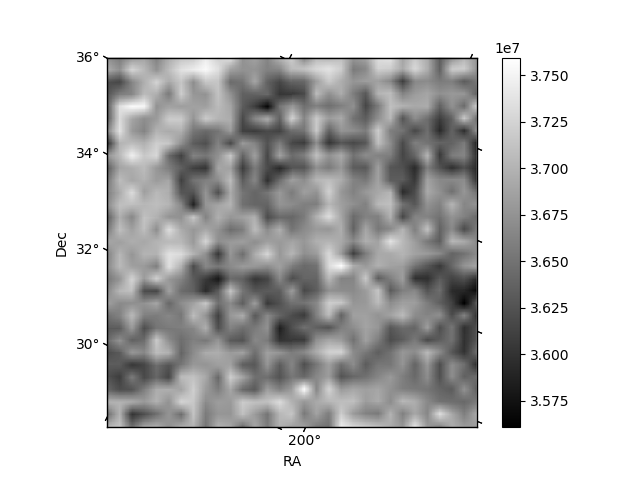
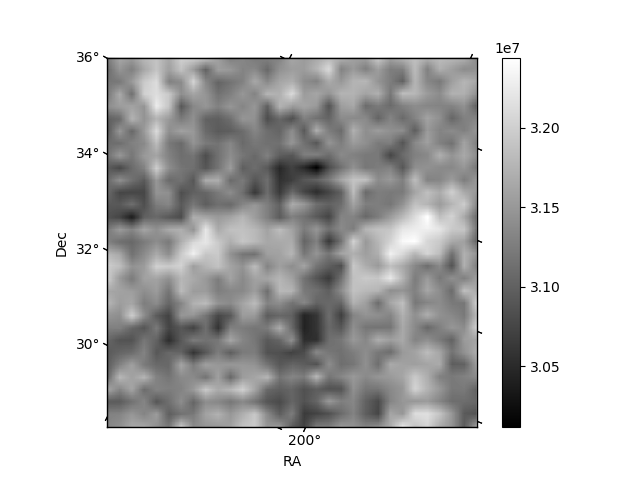
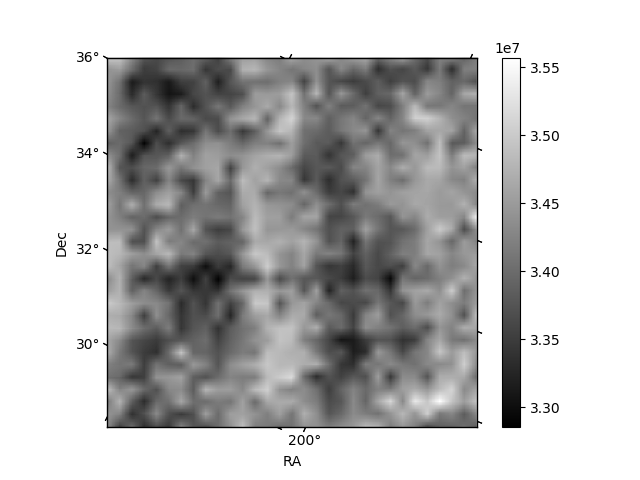
Histogram calculated using DETX and DETY for each event in the final _common_clean file
| Quadrant A | 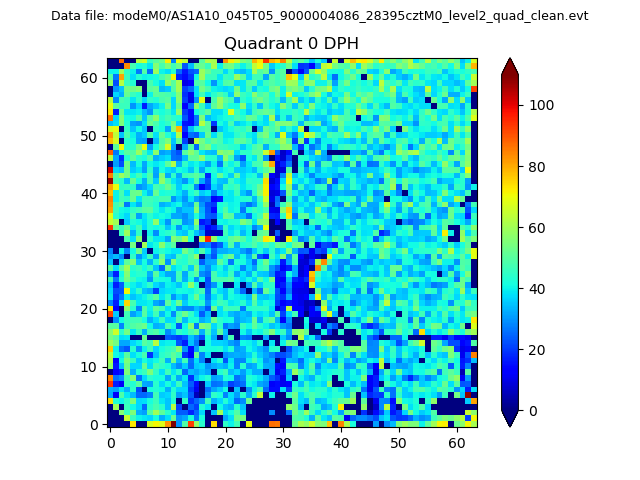 |
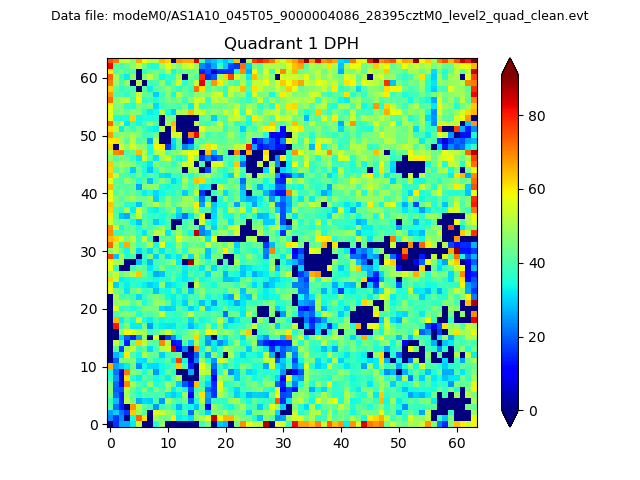 |
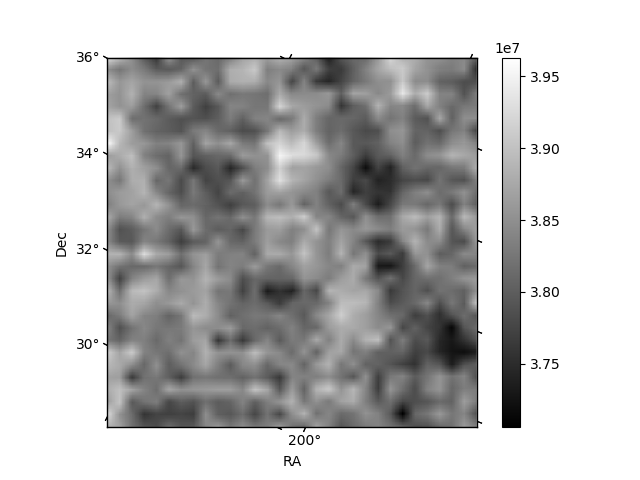
Quadrant B |
|---|---|---|---|
| Quadrant D | 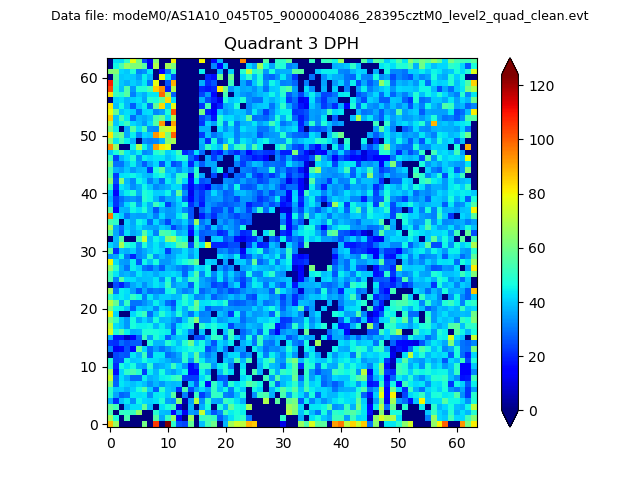 |
 |
Quadrant C |
| Plot type | Count rate plots | Images |
|---|---|---|
| Comparison with Poisson distribution Blue bars denote a histogram of data divided into 1 sec bins. Red curve is a Poisson curve with rate = median count rate of data. |
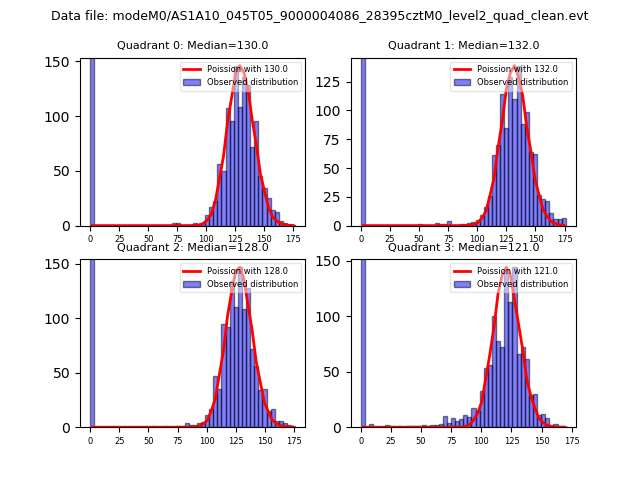 |
 |
| Quadrant-wise count rates Data is divided into 100 sec bins |
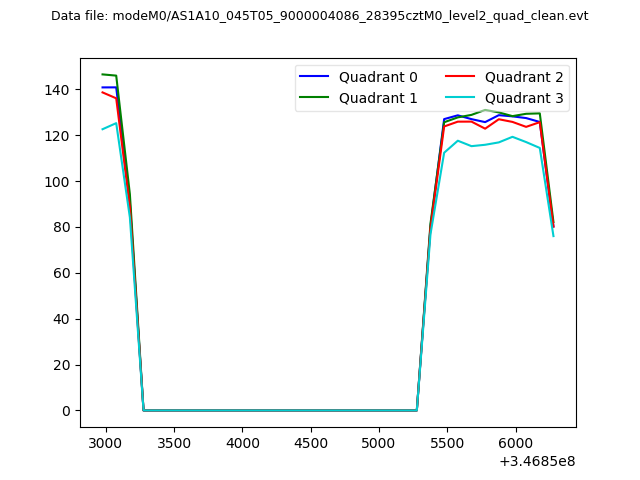 |
|
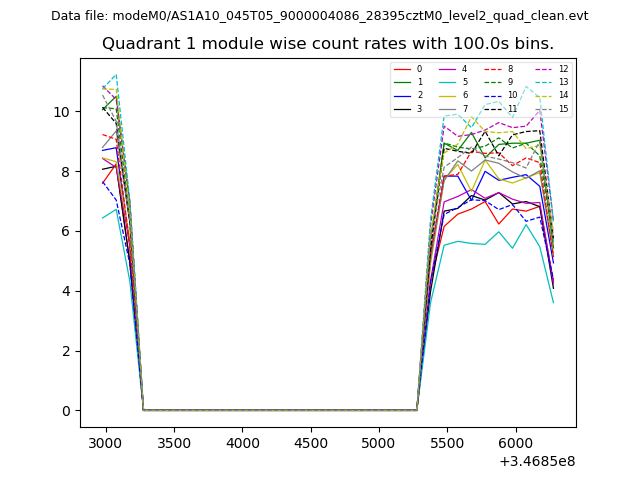
| Module-wise count rates for Quadrant A Data is divided into 100 sec bins |
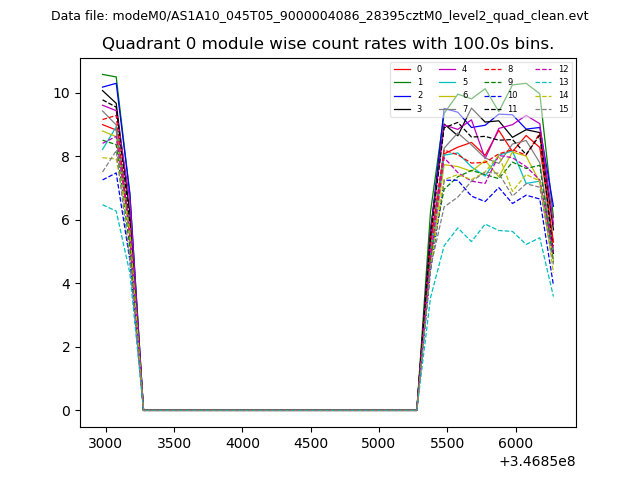 |
 |
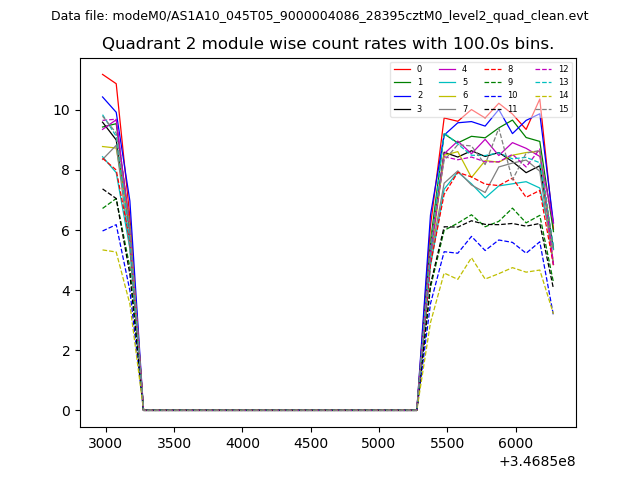
| Module-wise count rates for Quadrant B Data is divided into 100 sec bins |
 |
 |
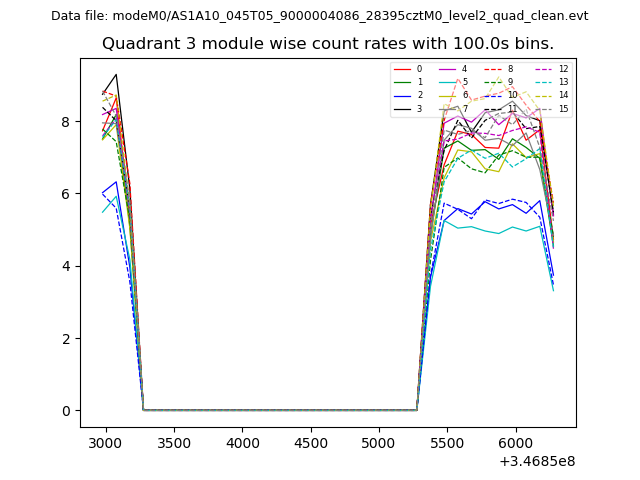
| Module-wise count rates for Quadrant C Data is divided into 100 sec bins |
 |
 |
| Module-wise count rates for Quadrant D Data is divided into 100 sec bins |
 |
 |
| Parameter | Plot |
|---|---|
| CZT HV Monitor | 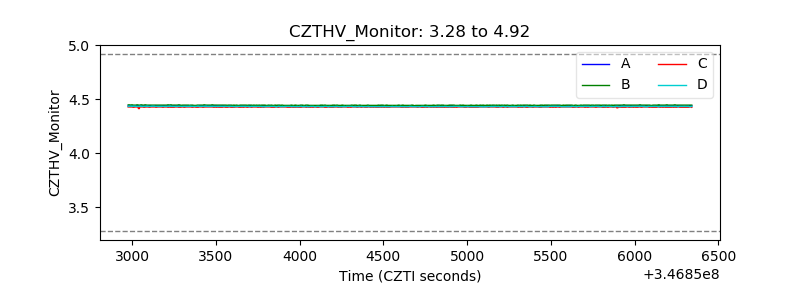 |
| D_VDD | 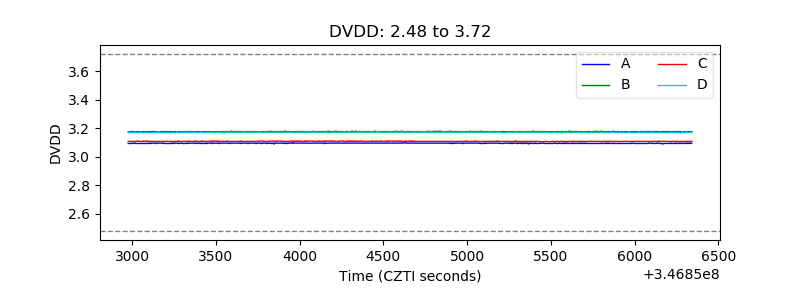 |
| Temperature 1 | 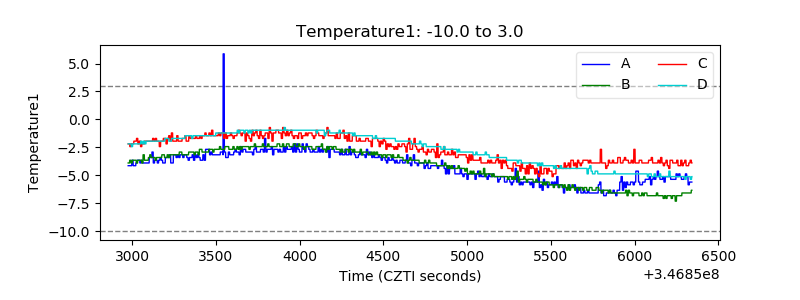 |
| Veto HV Monitor | 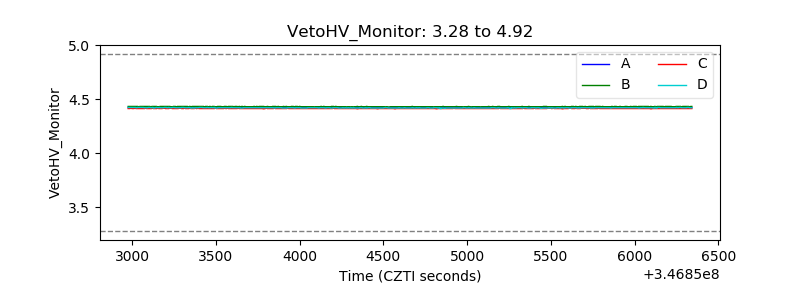 |
| Veto LLD | 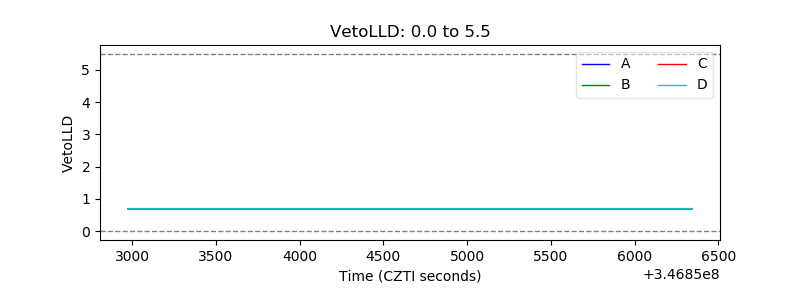 |
| Alpha Counter | 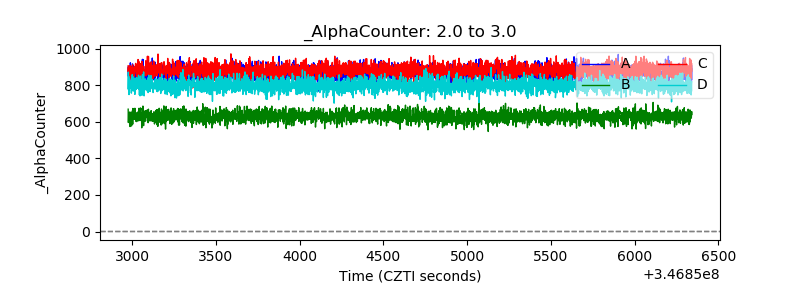 |
| _CPM_Rate | 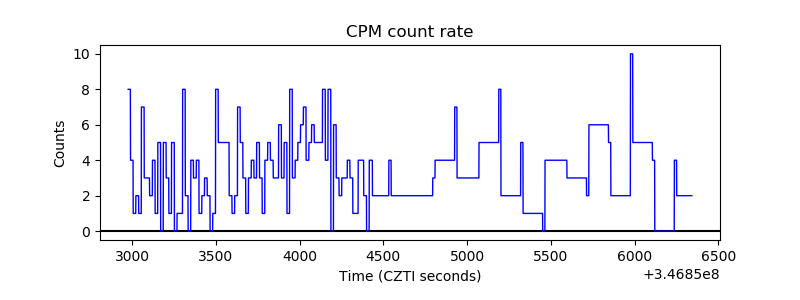 |
| CZT Counter | 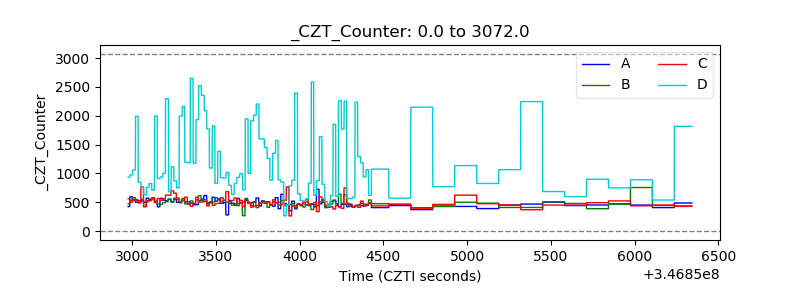 |
| +2.5 Volts monitor |  |
| +5 Volts monitor | 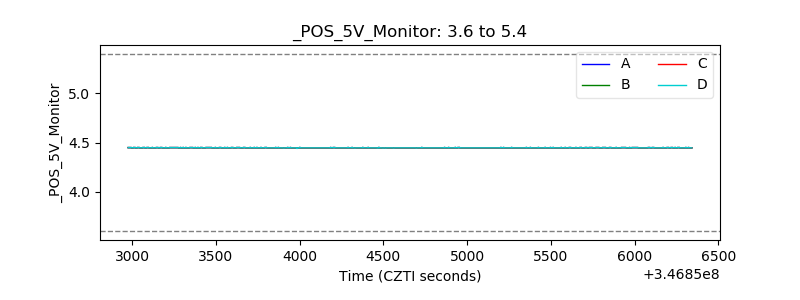 |
| _ROLL_ROT | 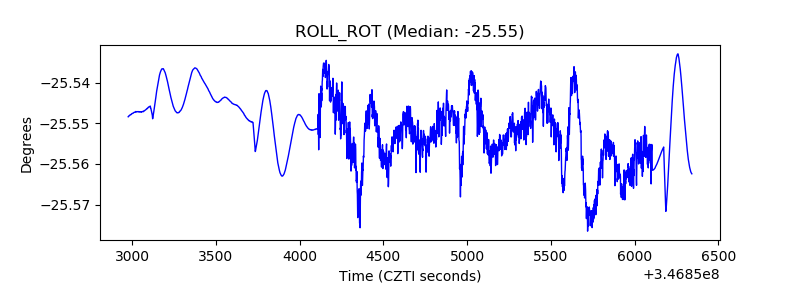 |
| _Roll_DEC | 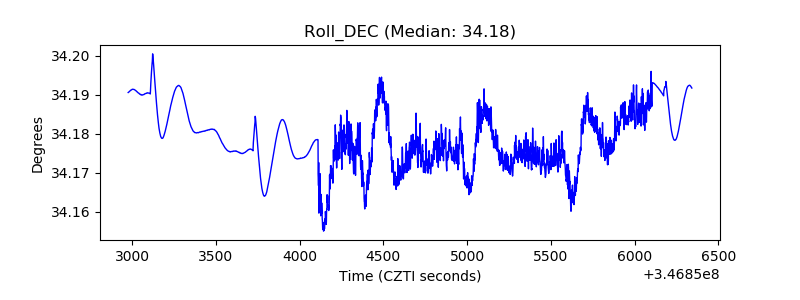 |
| _Roll_RA | 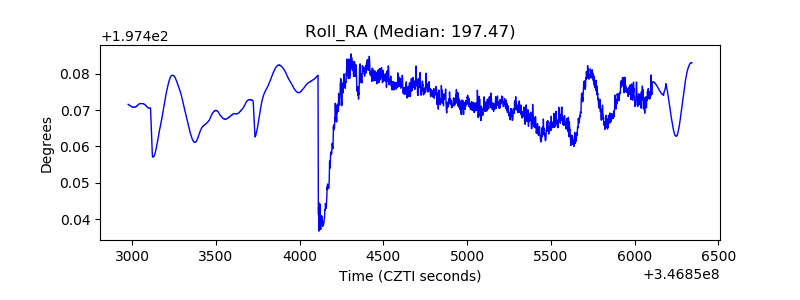 |
| Veto Counter | 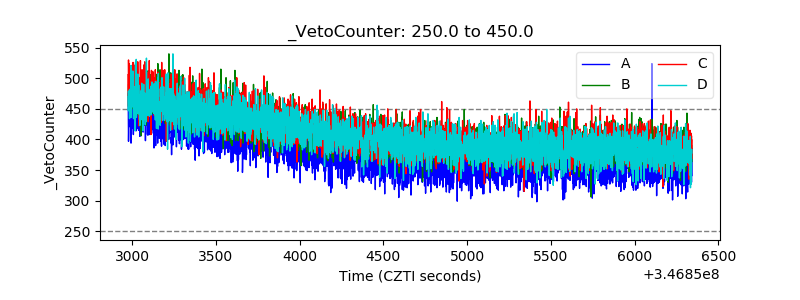 |