| Param | Original file | Final file |
|---|---|---|
| Filename | modeM0/AS1A10_058T13_9000004088_28395cztM0_level2.evt | modeM0/AS1A10_058T13_9000004088_28395cztM0_level2_quad_clean.evt |
| Size (bytes) | 133,902,720 | 28,920,960 |
| Size | 127.7 MB | 27.6 MB |
| Events in quadrant A | 750,144 | 202,898 |
| Events in quadrant B | 779,109 | 207,481 |
| Events in quadrant C | 728,534 | 193,844 |
| Events in quadrant D | 1,704,595 | 171,518 |
| Mode M0 | |||
|---|---|---|---|
| Quadrant | BADHDUFLAG | Total packets | Discarded packets |
| A | 0 | 3067 | 0 |
| B | 0 | 3155 | 0 |
| C | 0 | 3008 | 0 |
| D | 0 | 5989 | 0 |
| Mode M9 | |||
|---|---|---|---|
| Quadrant | BADHDUFLAG | Total packets | Discarded packets |
| A | 0 | 10 | 0 |
| B | 0 | 10 | 0 |
| C | 0 | 10 | 0 |
| D | 0 | 10 | 0 |
| Quadrant | Total seconds | Saturated seconds | Saturation percentage |
|---|---|---|---|
| A | 1332 | 6 | 0.450450% |
| B | 1332 | 10 | 0.750751% |
| C | 1332 | 16 | 1.201201% |
| D | 1332 | 262 | 19.669670% |
Noise dominated data is calculated using 1-second bins in cleaned event files. If a bin has >2000 counts, and if more than 50% of those come from <1% of pixels, then it is considered to be noise-dominated and hence unusable.
| Quadrant | # 1 sec bins | Bins with >0 counts | Bins with >2000 counts | High rate bins dominated by noise | Noise dominated (total time) | Noise dominated (detector-on time) | Marked lightcurve |
|---|---|---|---|---|---|---|---|
| A | 1332 | 1332 | 0 | 0 | 0.00% | 0.00% | 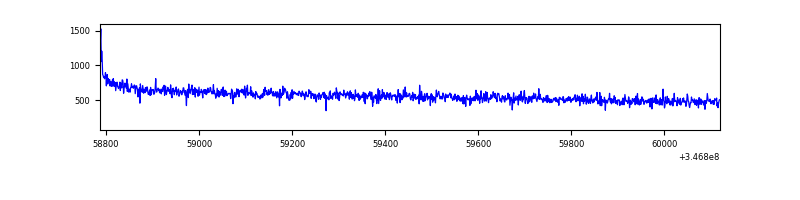 |
| B | 1332 | 1332 | 1 | 1 | 0.08% | 0.08% | 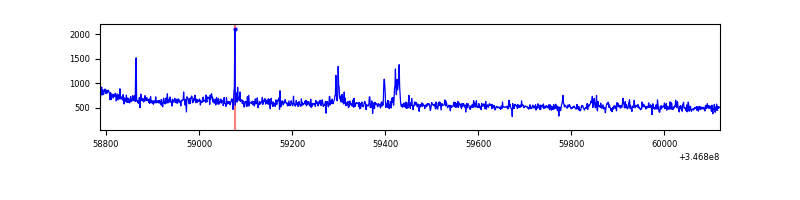 |
| C | 1332 | 1332 | 0 | 0 | 0.00% | 0.00% | 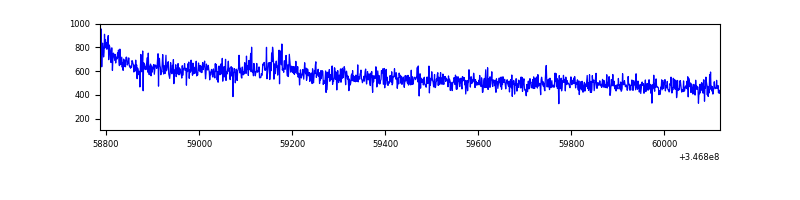 |
| D | 1332 | 1332 | 165 | 165 | 12.39% | 12.39% | 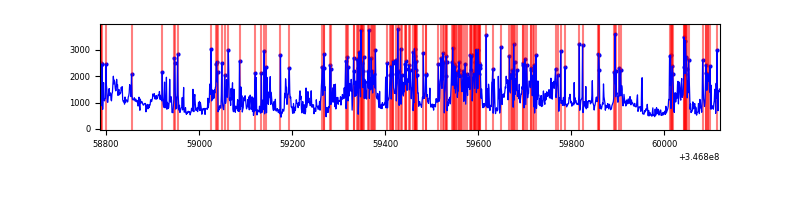 |
Top three noisy pixels from each quadrant. If the there are fewer than three noisy pixels in the level2.evt file, extra rows are filled as -1
| Pixel properties | Quadrant properties | ||||||
|---|---|---|---|---|---|---|---|
| Quadrant | DetID | PixID | Counts | Sigma | Mean | Median | Sigma |
| A | 6 | 16 | 3148 | 72.84 | 193 | 189 | 40.6 |
| A | 8 | 192 | 2798 | 64.22 | 193 | 189 | 40.6 |
| A | 13 | 254 | 2208 | 49.7 | 193 | 189 | 40.6 |
| B | 10 | 245 | 24557 | 629.77 | 188 | 183 | 38.7 |
| B | 0 | 230 | 10807 | 274.5 | 188 | 183 | 38.7 |
| B | 12 | 111 | 4331 | 107.18 | 188 | 183 | 38.7 |
| C | 14 | 238 | 29277 | 674.58 | 177 | 177 | 43.1 |
| C | 10 | 5 | 6641 | 149.85 | 177 | 177 | 43.1 |
| C | 7 | 220 | 1636 | 33.82 | 177 | 177 | 43.1 |
| D | 1 | 52 | 756044 | 18250.94 | 169 | 165 | 41.4 |
| D | 8 | 195 | 294173 | 7098.92 | 169 | 165 | 41.4 |
| D | 2 | 234 | 4570 | 106.36 | 169 | 165 | 41.4 |
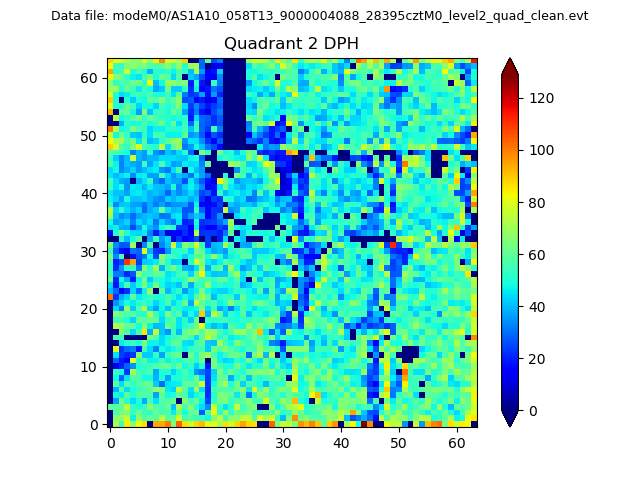
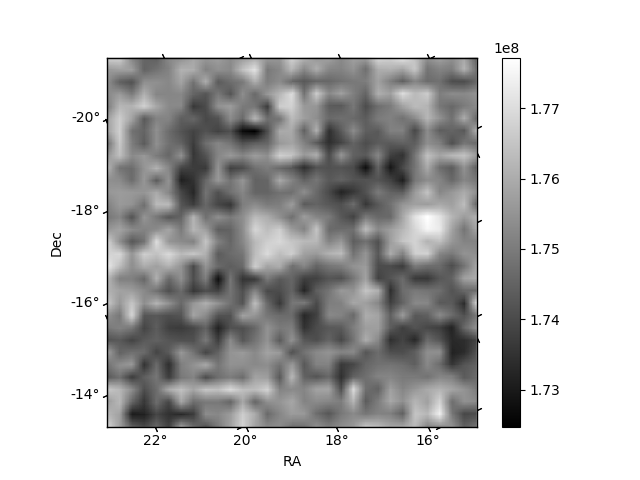
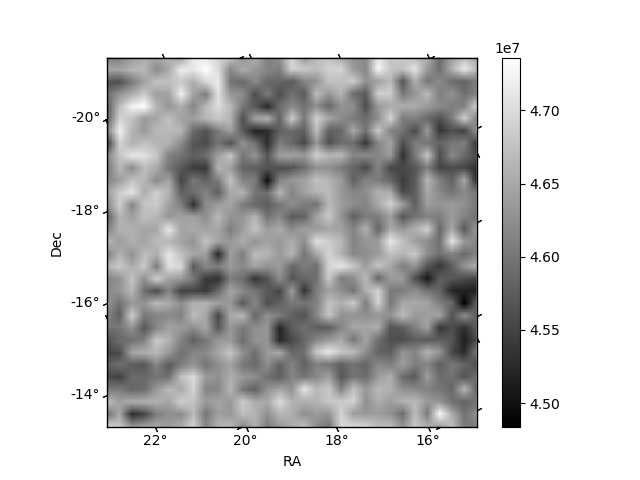
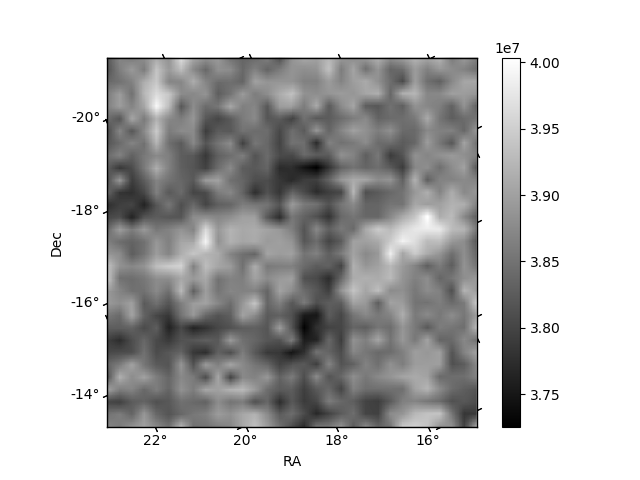
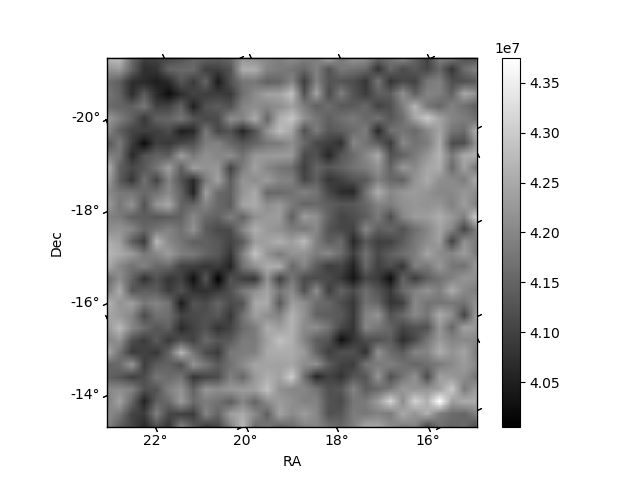
Histogram calculated using DETX and DETY for each event in the final _common_clean file
| Quadrant A | 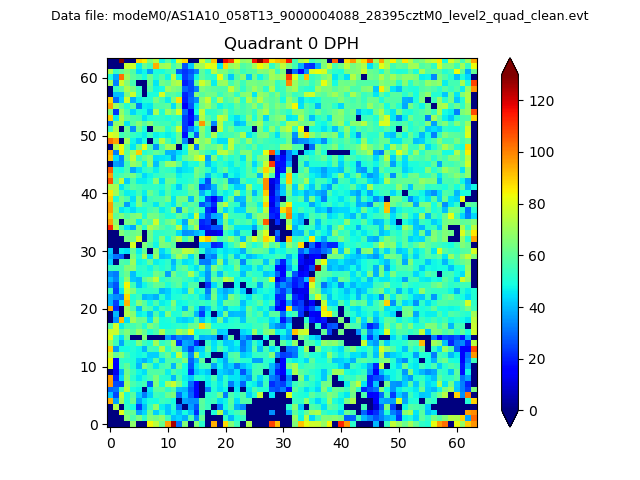 |
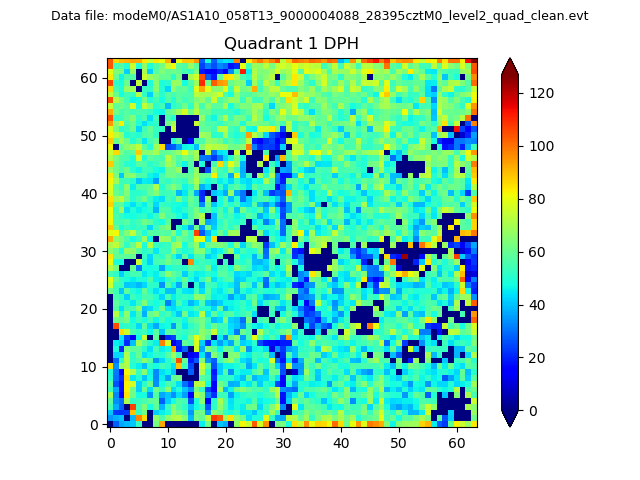 |
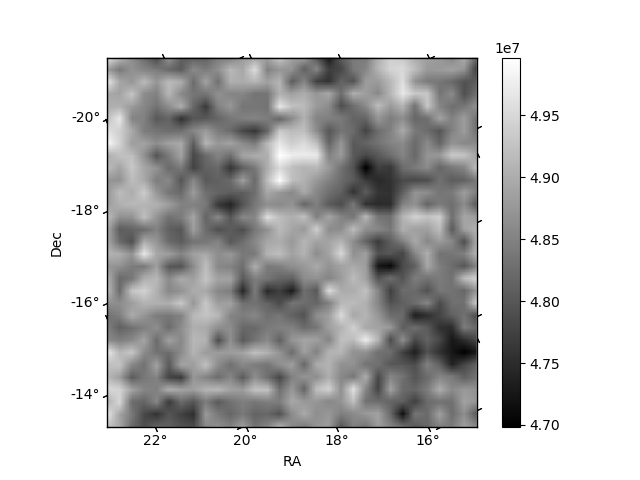
Quadrant B |
|---|---|---|---|
| Quadrant D | 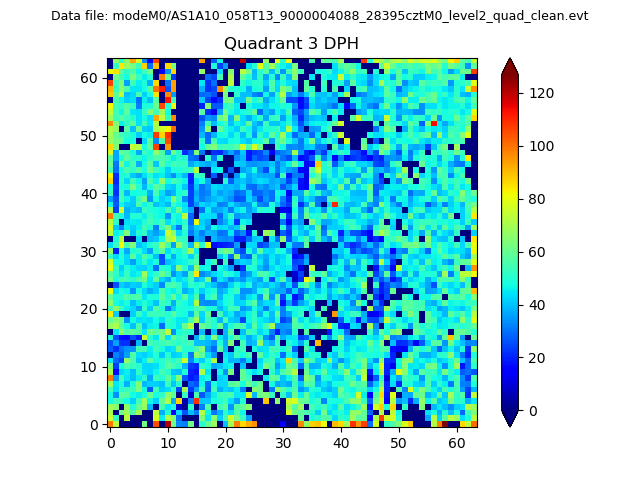 |
 |
Quadrant C |
| Plot type | Count rate plots | Images |
|---|---|---|
| Comparison with Poisson distribution Blue bars denote a histogram of data divided into 1 sec bins. Red curve is a Poisson curve with rate = median count rate of data. |
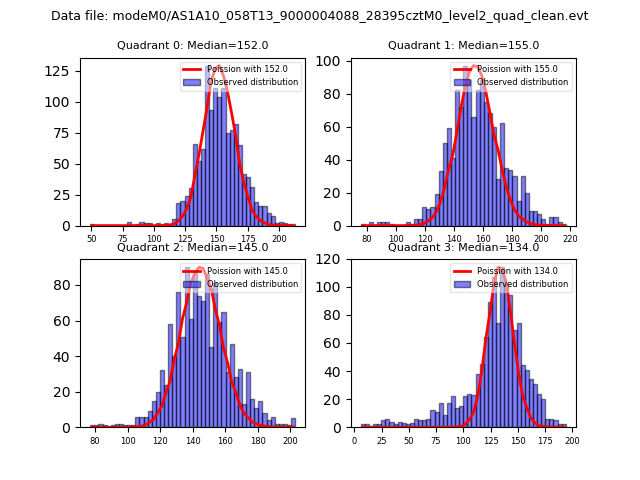 |
 |
| Quadrant-wise count rates Data is divided into 100 sec bins |
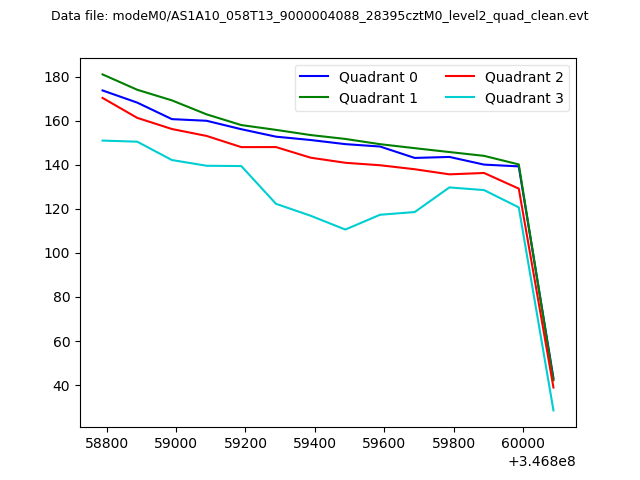 |
|
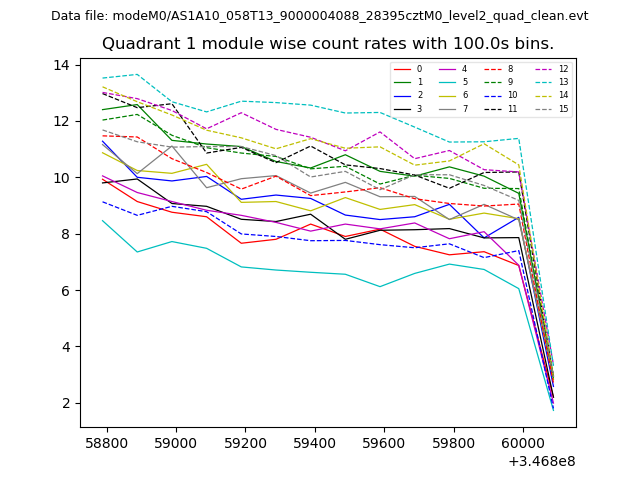
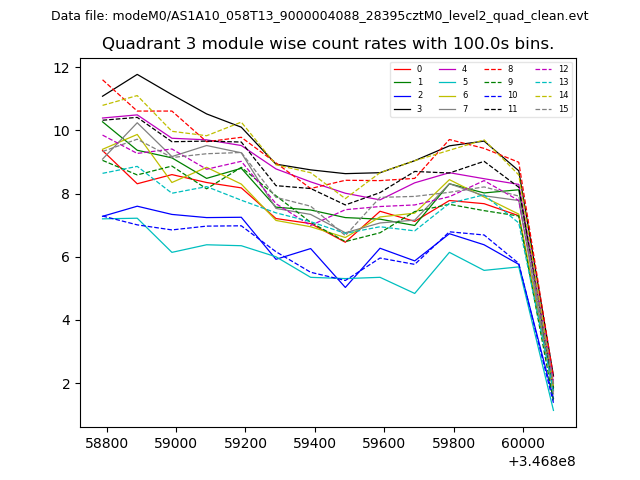
| Module-wise count rates for Quadrant A Data is divided into 100 sec bins |
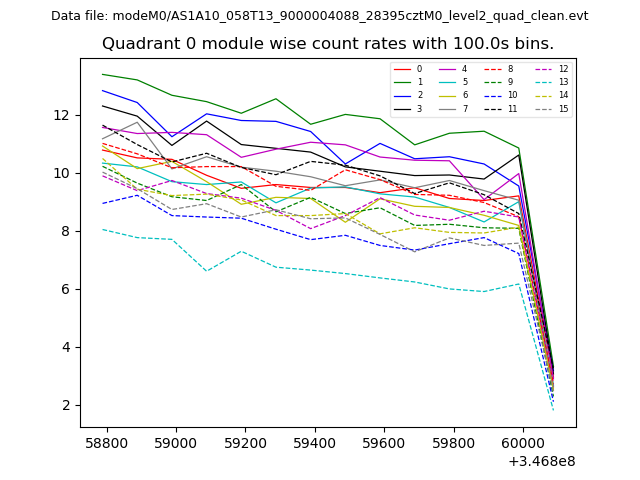 |
 |
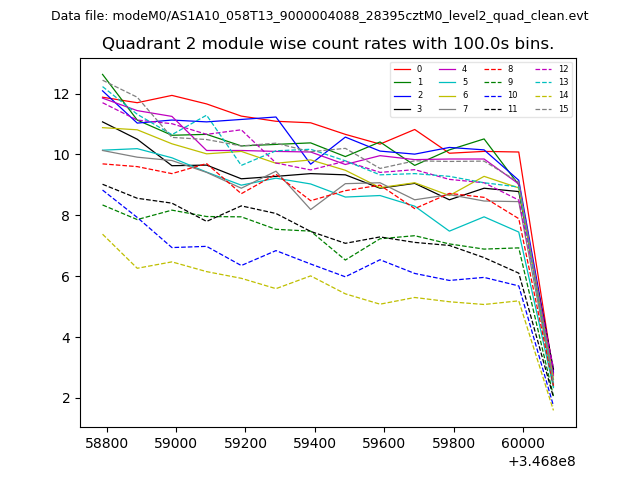
| Module-wise count rates for Quadrant B Data is divided into 100 sec bins |
 |
 |
| Module-wise count rates for Quadrant C Data is divided into 100 sec bins |
 |
 |
| Module-wise count rates for Quadrant D Data is divided into 100 sec bins |
 |
 |
| Parameter | Plot |
|---|---|
| CZT HV Monitor | 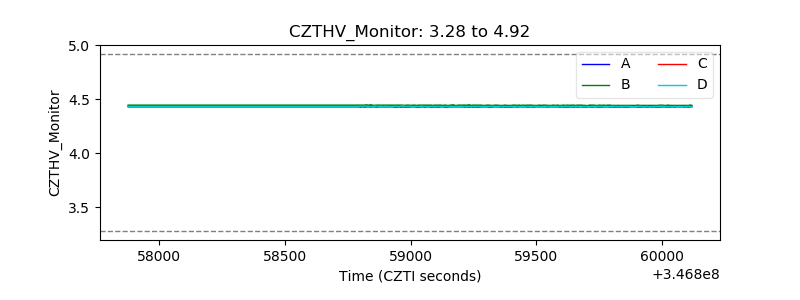 |
| D_VDD | 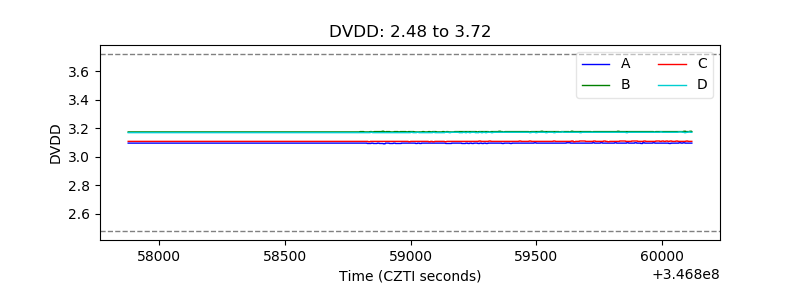 |
| Temperature 1 | 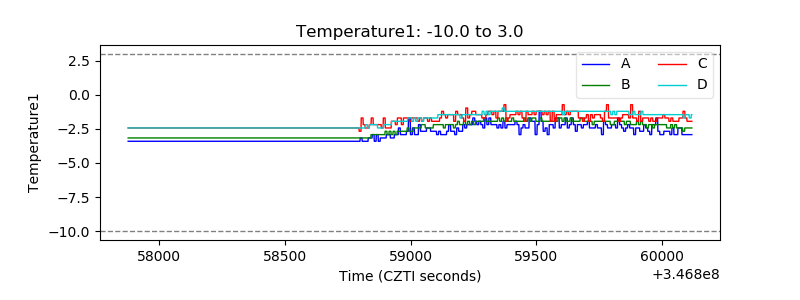 |
| Veto HV Monitor | 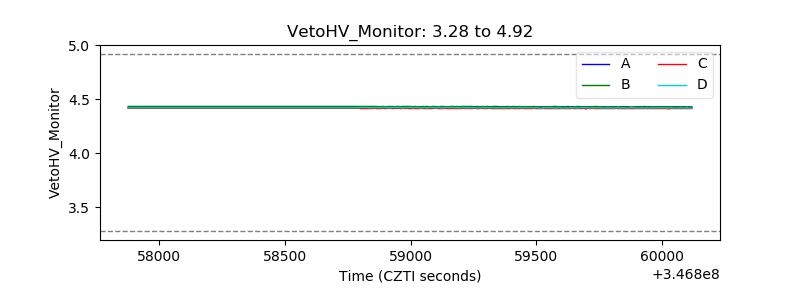 |
| Veto LLD | 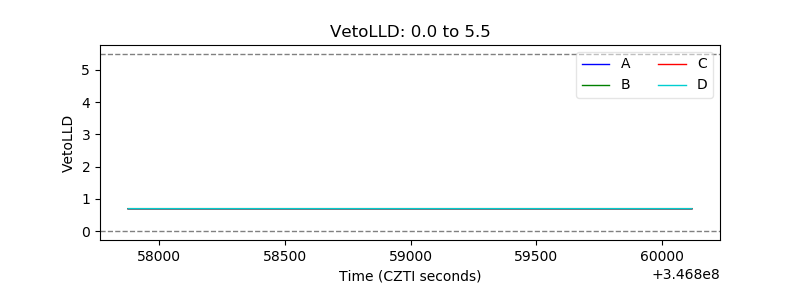 |
| Alpha Counter | 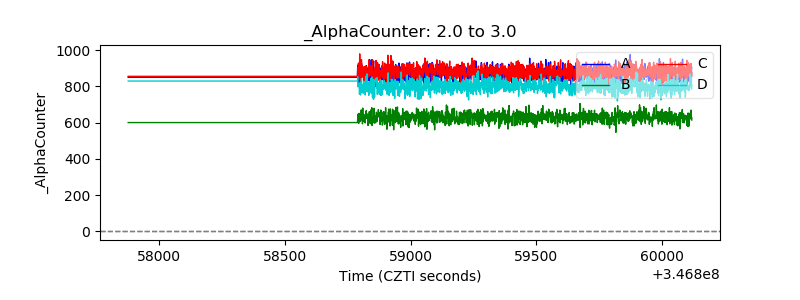 |
| _CPM_Rate |  |
| CZT Counter | 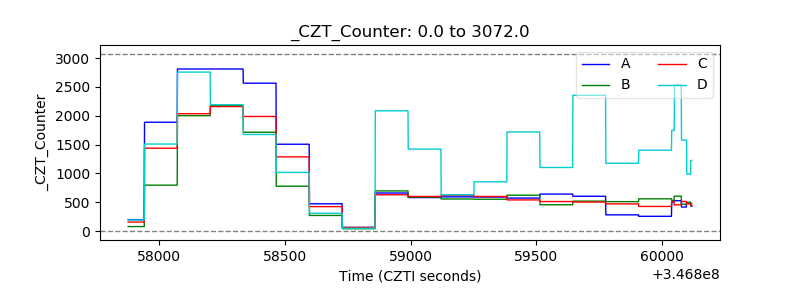 |
| +2.5 Volts monitor |  |
| +5 Volts monitor |  |
| _ROLL_ROT | 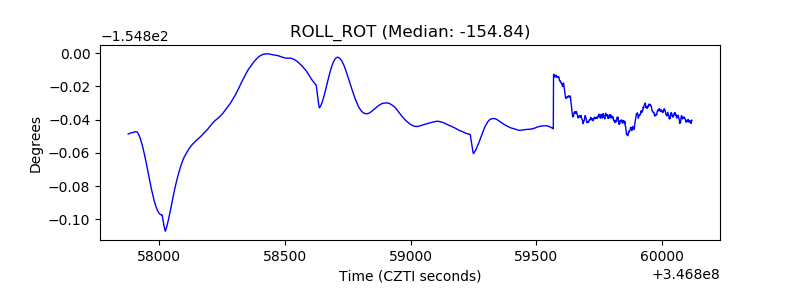 |
| _Roll_DEC | 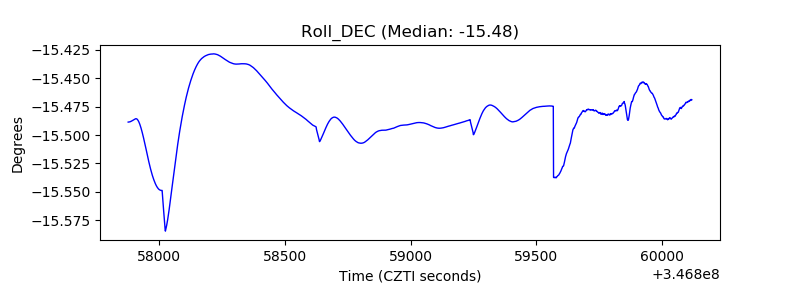 |
| _Roll_RA | 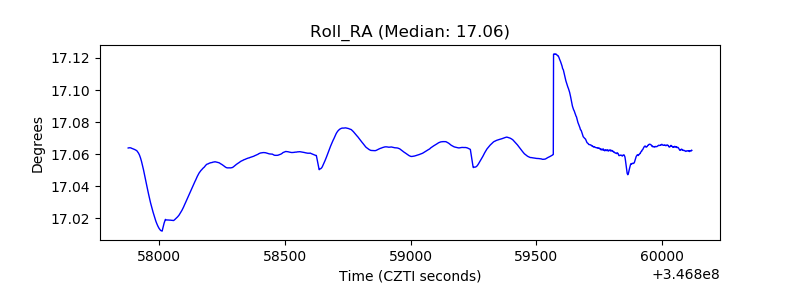 |
| Veto Counter | 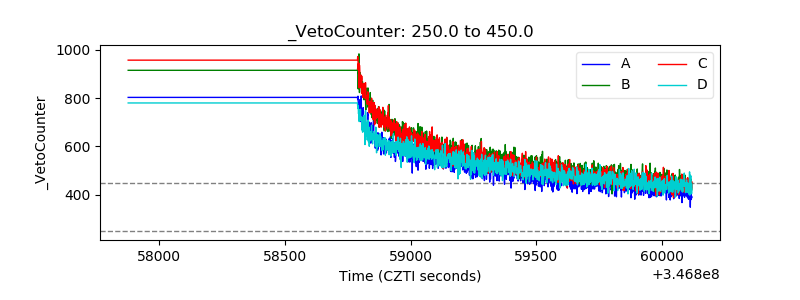 |