| Param | Original file | Final file |
|---|---|---|
| Filename | modeM0/AS1A10_058T13_9000004088_28397cztM0_level2.evt | modeM0/AS1A10_058T13_9000004088_28397cztM0_level2_quad_clean.evt |
| Size (bytes) | 529,660,800 | 92,191,680 |
| Size | 505.1 MB | 87.9 MB |
| Events in quadrant A | 3,042,368 | 617,308 |
| Events in quadrant B | 3,183,502 | 624,067 |
| Events in quadrant C | 3,015,744 | 585,762 |
| Events in quadrant D | 6,380,307 | 533,266 |
| Mode M0 | |||
|---|---|---|---|
| Quadrant | BADHDUFLAG | Total packets | Discarded packets |
| A | 0 | 13001 | 0 |
| B | 0 | 13292 | 0 |
| C | 0 | 12866 | 0 |
| D | 0 | 23087 | 0 |
| Mode M9 | |||
|---|---|---|---|
| Quadrant | BADHDUFLAG | Total packets | Discarded packets |
| A | 0 | 11 | 0 |
| B | 0 | 11 | 0 |
| C | 0 | 11 | 0 |
| D | 0 | 11 | 0 |
| Quadrant | Total seconds | Saturated seconds | Saturation percentage |
|---|---|---|---|
| A | 6177 | 27 | 0.437105% |
| B | 6178 | 47 | 0.760764% |
| C | 6178 | 59 | 0.955002% |
| D | 6178 | 848 | 13.726125% |
Noise dominated data is calculated using 1-second bins in cleaned event files. If a bin has >2000 counts, and if more than 50% of those come from <1% of pixels, then it is considered to be noise-dominated and hence unusable.
| Quadrant | # 1 sec bins | Bins with >0 counts | Bins with >2000 counts | High rate bins dominated by noise | Noise dominated (total time) | Noise dominated (detector-on time) | Marked lightcurve |
|---|---|---|---|---|---|---|---|
| A | 7342 | 6177 | 0 | 0 | 0.00% | 0.00% | 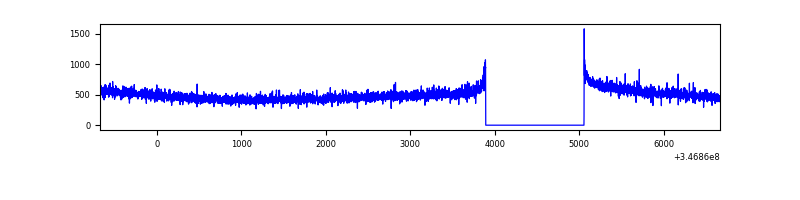 |
| B | 7343 | 6178 | 2 | 2 | 0.03% | 0.03% | 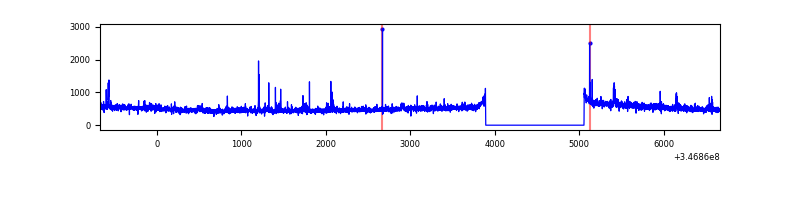 |
| C | 7343 | 6179 | 1 | 1 | 0.01% | 0.02% | 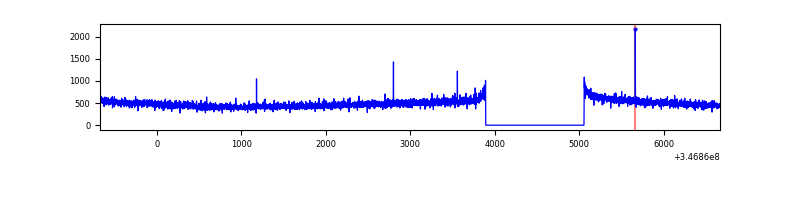 |
| D | 7343 | 6178 | 621 | 621 | 8.46% | 10.05% | 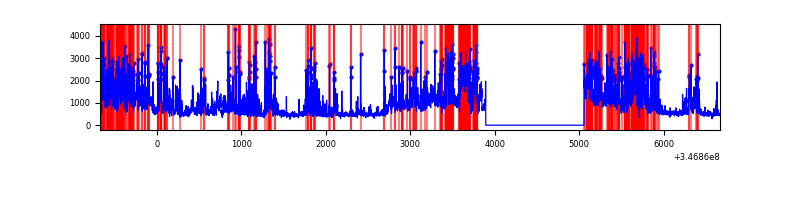 |
Top three noisy pixels from each quadrant. If the there are fewer than three noisy pixels in the level2.evt file, extra rows are filled as -1
| Pixel properties | Quadrant properties | ||||||
|---|---|---|---|---|---|---|---|
| Quadrant | DetID | PixID | Counts | Sigma | Mean | Median | Sigma |
| A | 13 | 254 | 9694 | 56.57 | 784 | 770 | 157.7 |
| A | 3 | 137 | 7332 | 41.6 | 784 | 770 | 157.7 |
| A | 6 | 16 | 6911 | 38.93 | 784 | 770 | 157.7 |
| B | 10 | 245 | 57179 | 383.86 | 777 | 759 | 147.0 |
| B | 10 | 246 | 30691 | 203.65 | 777 | 759 | 147.0 |
| B | 0 | 230 | 25644 | 169.31 | 777 | 759 | 147.0 |
| C | 14 | 238 | 121218 | 691.37 | 741 | 746 | 174.3 |
| C | 7 | 220 | 6076 | 30.59 | 741 | 746 | 174.3 |
| C | 13 | 61 | 5120 | 25.1 | 741 | 746 | 174.3 |
| D | 1 | 52 | 2623439 | 15593.73 | 702 | 683 | 168.2 |
| D | 8 | 195 | 858122 | 5097.95 | 702 | 683 | 168.2 |
| D | 2 | 250 | 216840 | 1285.17 | 702 | 683 | 168.2 |
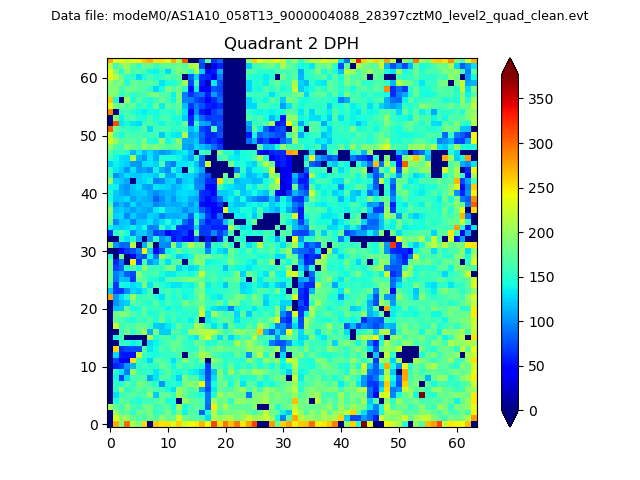
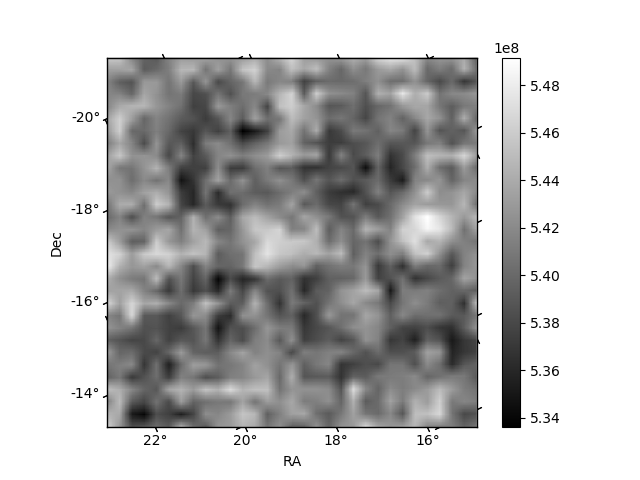
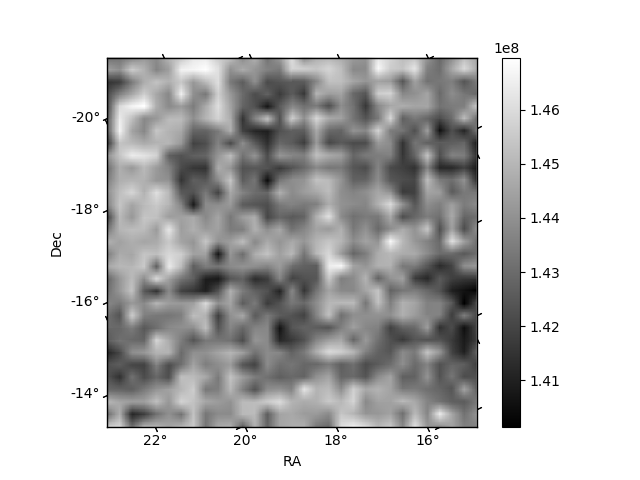
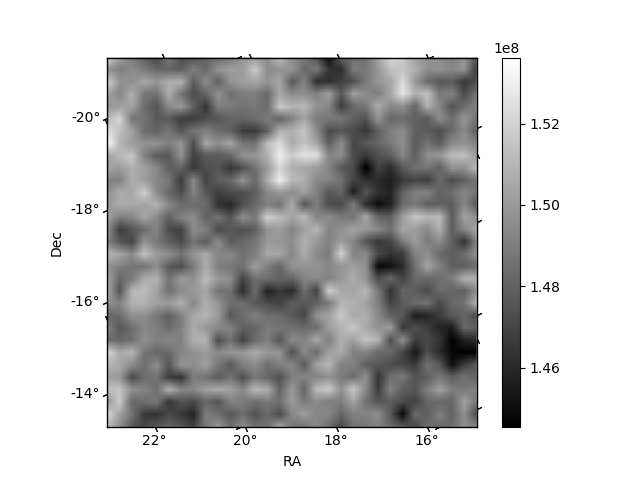
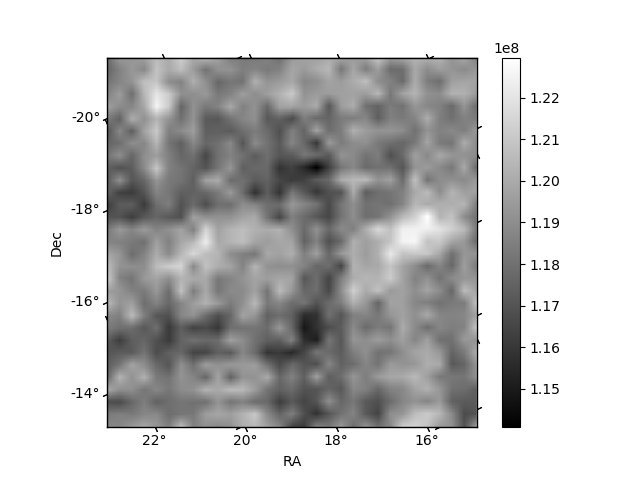
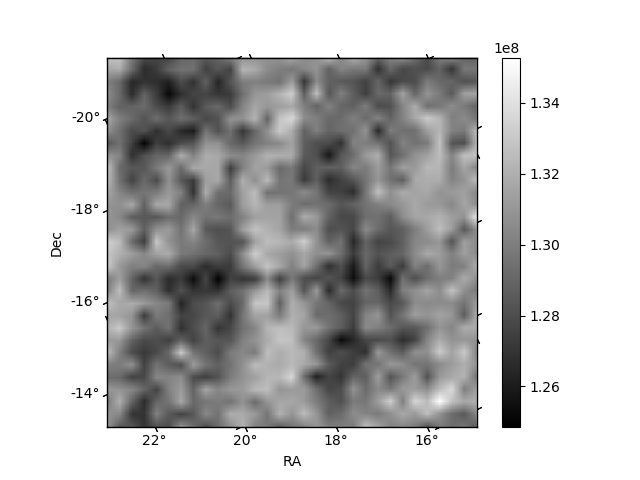
Histogram calculated using DETX and DETY for each event in the final _common_clean file
| Quadrant A | 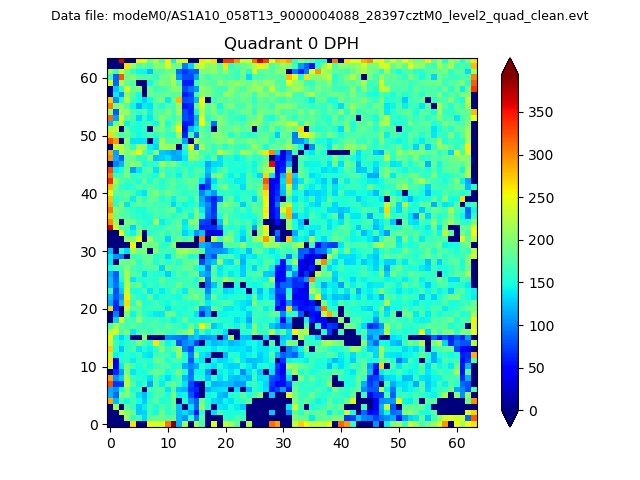 |
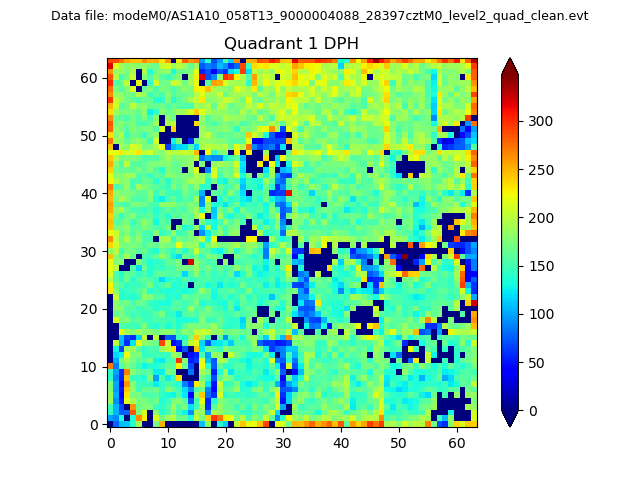 |
Quadrant B |
|---|---|---|---|
| Quadrant D | 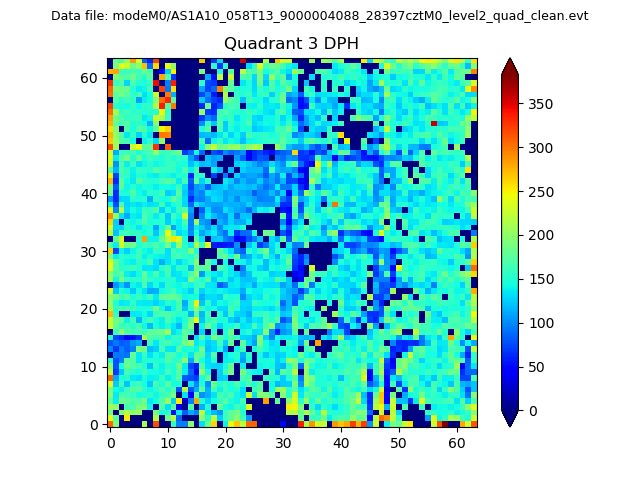 |
 |
Quadrant C |
| Plot type | Count rate plots | Images |
|---|---|---|
| Comparison with Poisson distribution Blue bars denote a histogram of data divided into 1 sec bins. Red curve is a Poisson curve with rate = median count rate of data. |
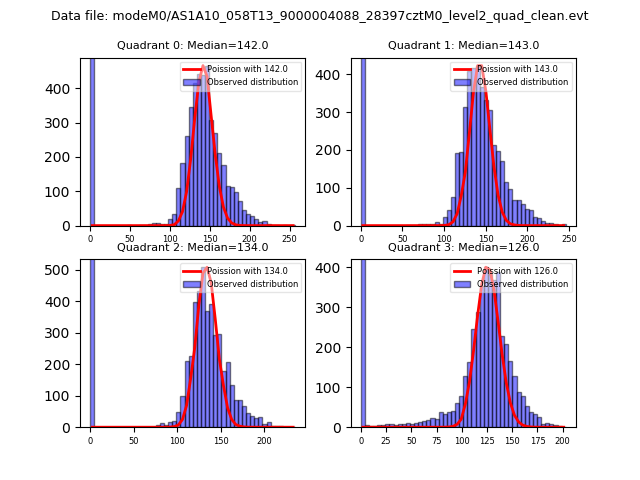 |
 |
| Quadrant-wise count rates Data is divided into 100 sec bins |
 |
|
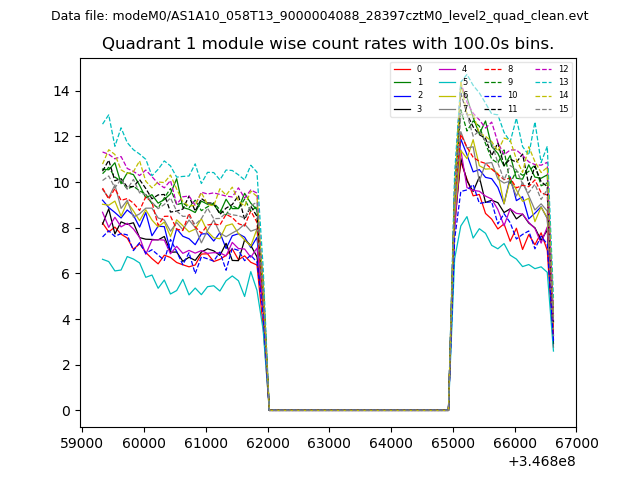
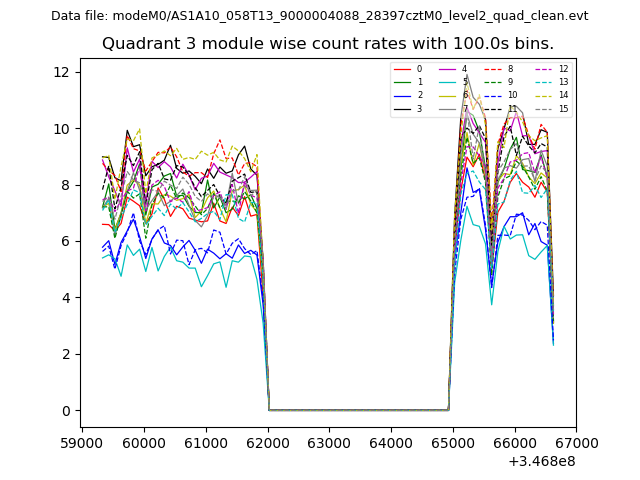
| Module-wise count rates for Quadrant A Data is divided into 100 sec bins |
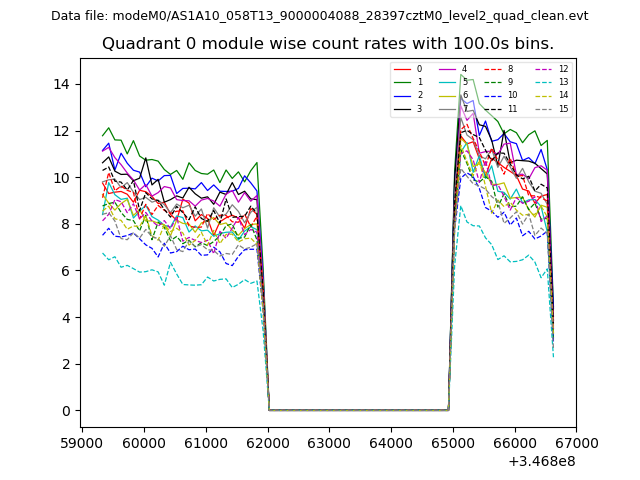 |
 |
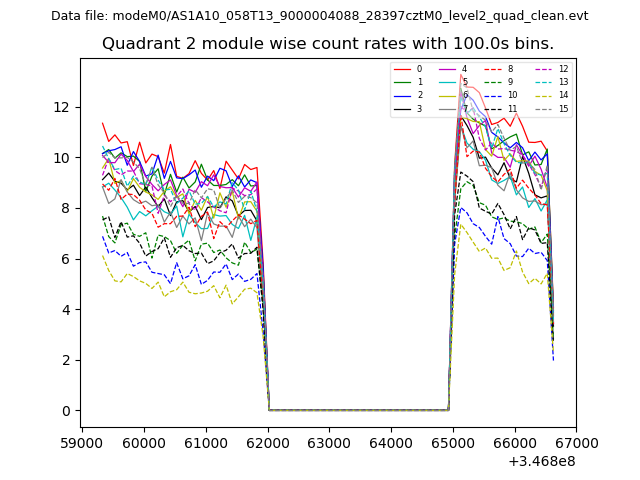
| Module-wise count rates for Quadrant B Data is divided into 100 sec bins |
 |
 |
| Module-wise count rates for Quadrant C Data is divided into 100 sec bins |
 |
 |
| Module-wise count rates for Quadrant D Data is divided into 100 sec bins |
 |
 |
| Parameter | Plot |
|---|---|
| CZT HV Monitor | 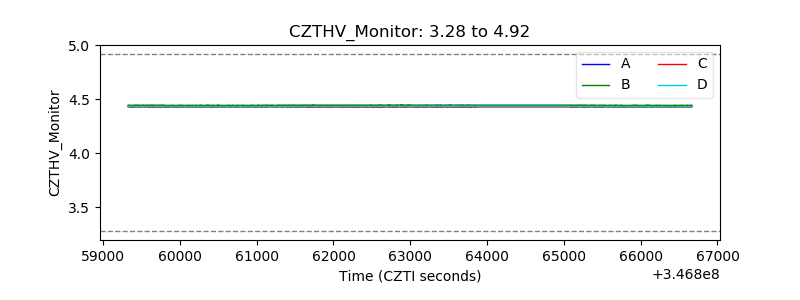 |
| D_VDD | 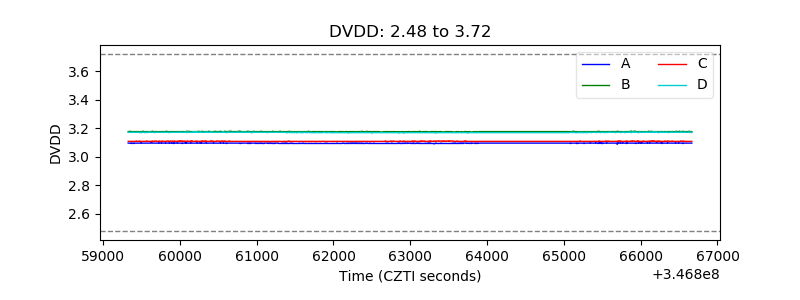 |
| Temperature 1 | 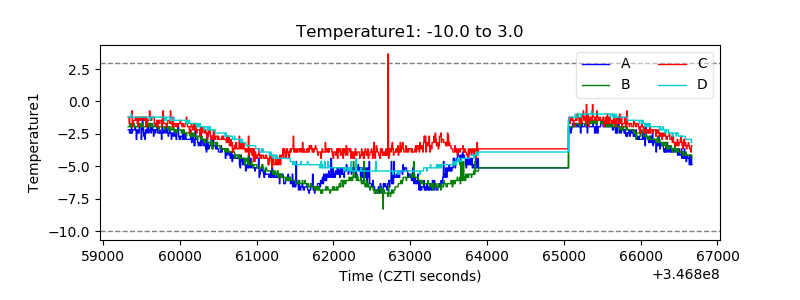 |
| Veto HV Monitor | 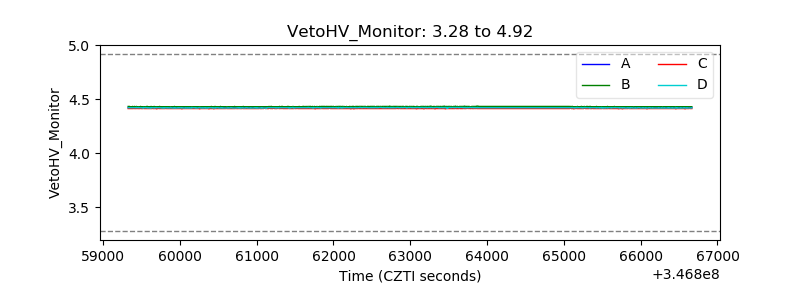 |
| Veto LLD | 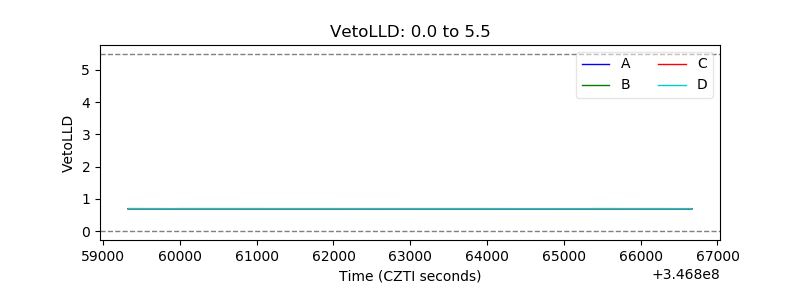 |
| Alpha Counter | 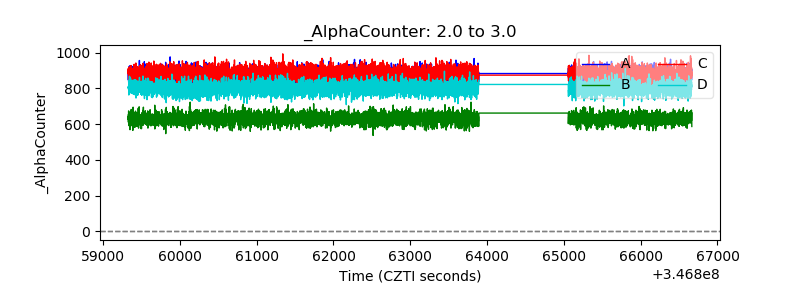 |
| _CPM_Rate | 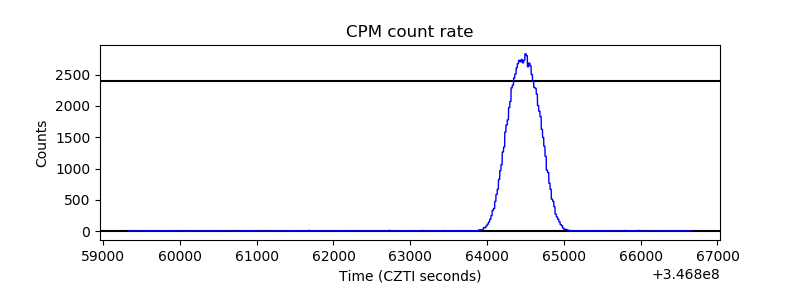 |
| CZT Counter | 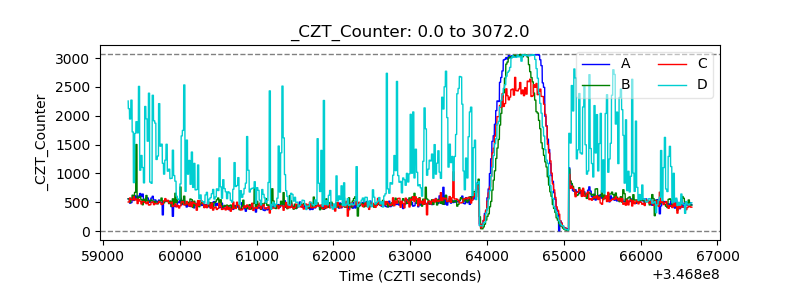 |
| +2.5 Volts monitor |  |
| +5 Volts monitor |  |
| _ROLL_ROT | 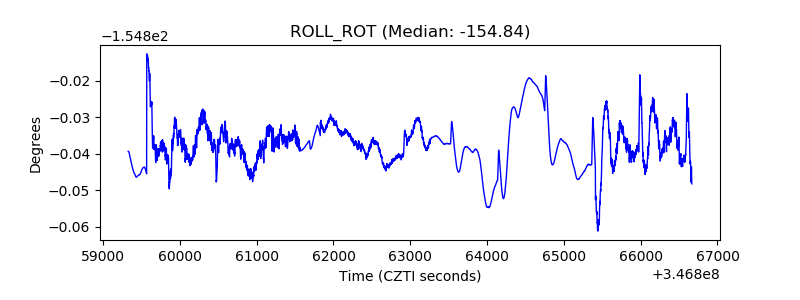 |
| _Roll_DEC | 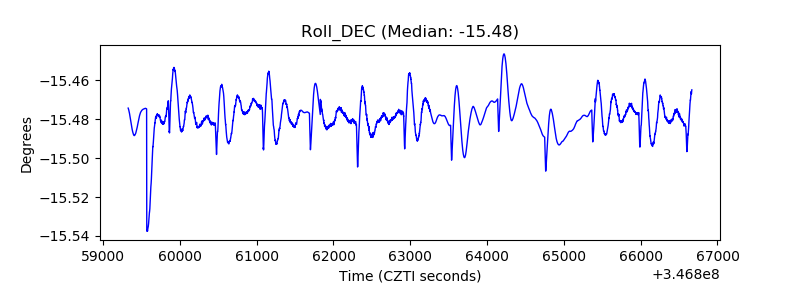 |
| _Roll_RA | 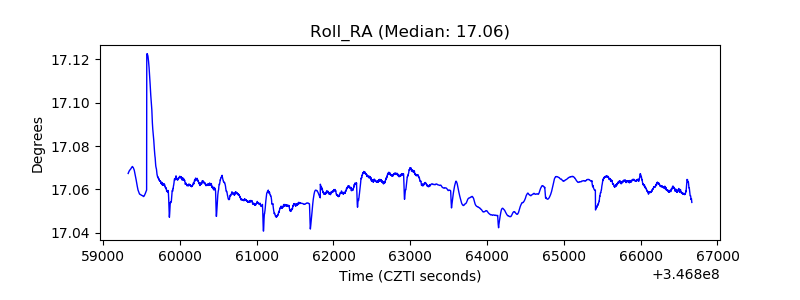 |
| Veto Counter | 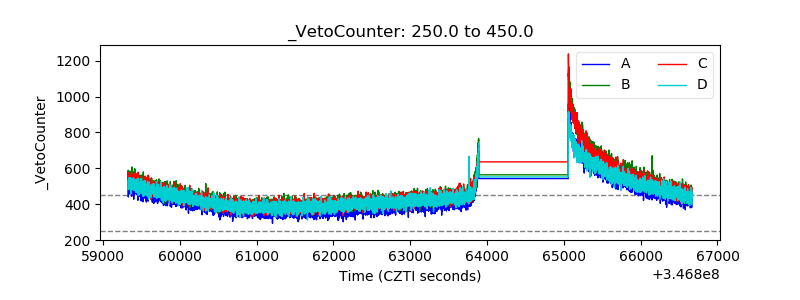 |