| Param | Original file | Final file |
|---|---|---|
| Filename | modeM0/AS1A10_058T13_9000004088_28399cztM0_level2.evt | modeM0/AS1A10_058T13_9000004088_28399cztM0_level2_quad_clean.evt |
| Size (bytes) | 510,655,680 | 97,369,920 |
| Size | 487.0 MB | 92.9 MB |
| Events in quadrant A | 3,277,325 | 645,805 |
| Events in quadrant B | 3,497,786 | 667,317 |
| Events in quadrant C | 3,290,451 | 620,182 |
| Events in quadrant D | 4,978,446 | 581,751 |
| Mode M0 | |||
|---|---|---|---|
| Quadrant | BADHDUFLAG | Total packets | Discarded packets |
| A | 0 | 13567 | 0 |
| B | 0 | 14326 | 0 |
| C | 0 | 13522 | 0 |
| D | 0 | 19158 | 0 |
| Mode M9 | |||
|---|---|---|---|
| Quadrant | BADHDUFLAG | Total packets | Discarded packets |
| A | 0 | 16 | 0 |
| B | 0 | 17 | 0 |
| C | 0 | 17 | 0 |
| D | 0 | 17 | 0 |
| Quadrant | Total seconds | Saturated seconds | Saturation percentage |
|---|---|---|---|
| A | 6215 | 58 | 0.933226% |
| B | 6215 | 93 | 1.496380% |
| C | 6215 | 85 | 1.367659% |
| D | 6215 | 361 | 5.808528% |
Noise dominated data is calculated using 1-second bins in cleaned event files. If a bin has >2000 counts, and if more than 50% of those come from <1% of pixels, then it is considered to be noise-dominated and hence unusable.
| Quadrant | # 1 sec bins | Bins with >0 counts | Bins with >2000 counts | High rate bins dominated by noise | Noise dominated (total time) | Noise dominated (detector-on time) | Marked lightcurve |
|---|---|---|---|---|---|---|---|
| A | 7555 | 6216 | 2 | 2 | 0.03% | 0.03% | 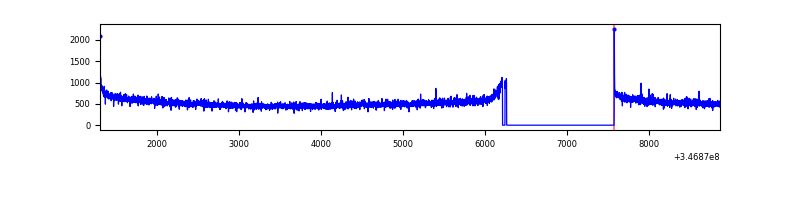 |
| B | 7555 | 6216 | 13 | 13 | 0.17% | 0.21% | 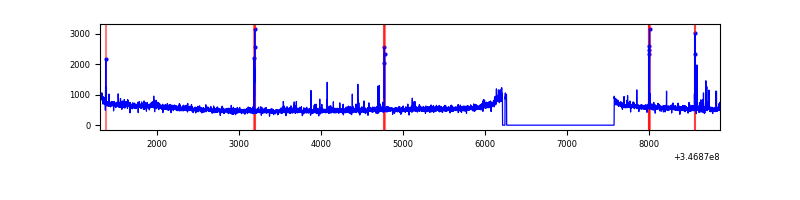 |
| C | 7555 | 6216 | 0 | 0 | 0.00% | 0.00% | 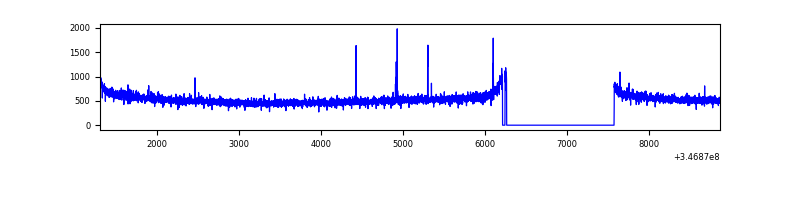 |
| D | 7555 | 6216 | 299 | 299 | 3.96% | 4.81% | 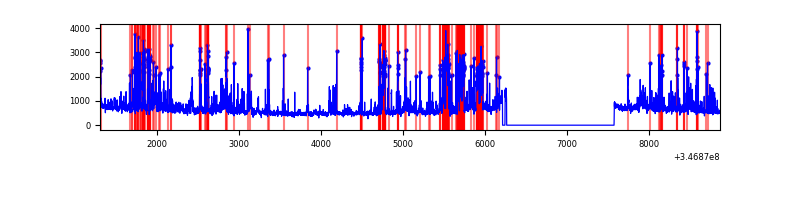 |
Top three noisy pixels from each quadrant. If the there are fewer than three noisy pixels in the level2.evt file, extra rows are filled as -1
| Pixel properties | Quadrant properties | ||||||
|---|---|---|---|---|---|---|---|
| Quadrant | DetID | PixID | Counts | Sigma | Mean | Median | Sigma |
| A | 8 | 192 | 10950 | 60.3 | 844 | 829 | 167.8 |
| A | 13 | 254 | 9675 | 52.71 | 844 | 829 | 167.8 |
| A | 3 | 137 | 7815 | 41.62 | 844 | 829 | 167.8 |
| B | 10 | 245 | 128885 | 810.35 | 845 | 827 | 158.0 |
| B | 10 | 246 | 41456 | 257.1 | 845 | 827 | 158.0 |
| B | 12 | 111 | 18739 | 113.35 | 845 | 827 | 158.0 |
| C | 14 | 238 | 130125 | 691.53 | 805 | 813 | 187.0 |
| C | 7 | 220 | 25298 | 130.94 | 805 | 813 | 187.0 |
| C | 13 | 61 | 5500 | 25.06 | 805 | 813 | 187.0 |
| D | 1 | 52 | 1228216 | 6544.07 | 788 | 769 | 187.6 |
| D | 8 | 195 | 472481 | 2514.91 | 788 | 769 | 187.6 |
| D | 13 | 238 | 131318 | 696.01 | 788 | 769 | 187.6 |
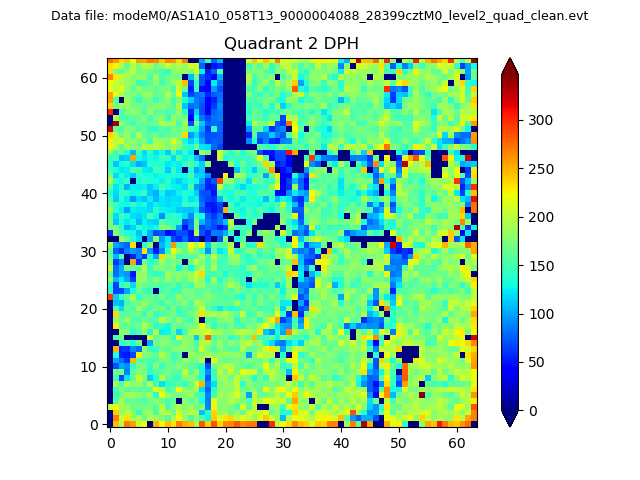
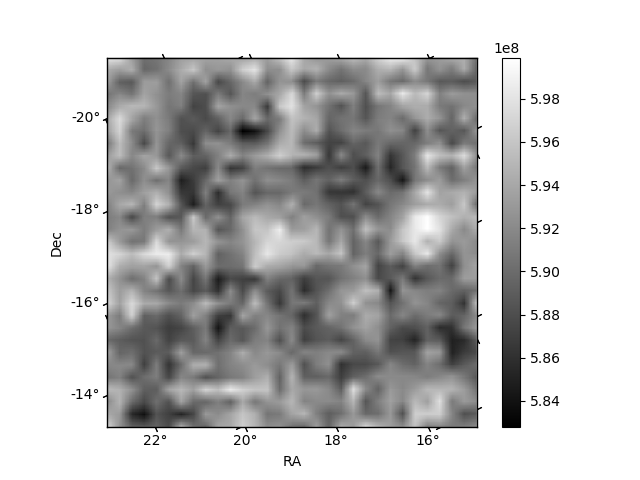
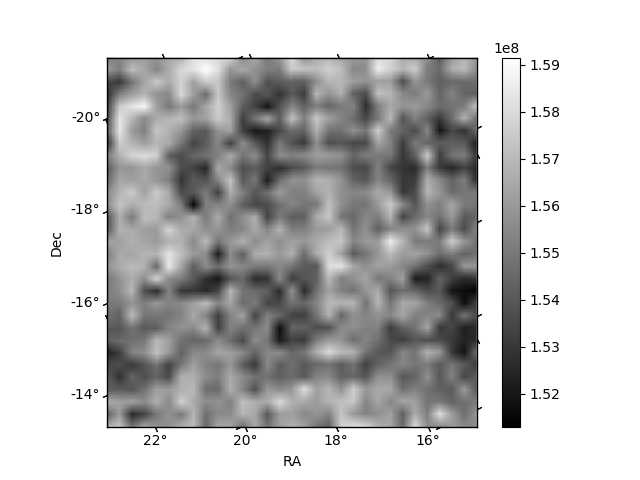
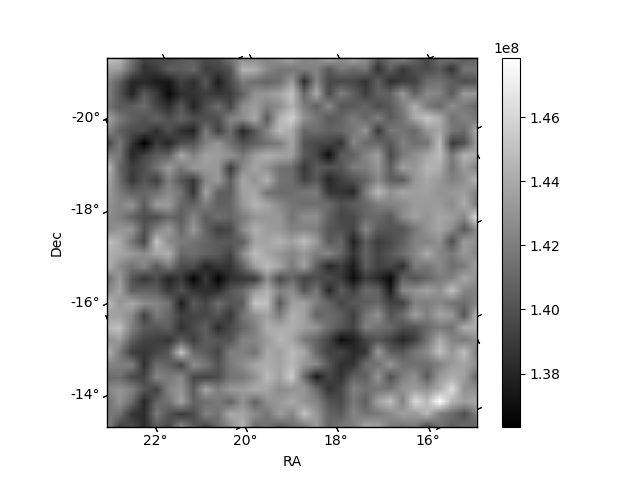
Histogram calculated using DETX and DETY for each event in the final _common_clean file
| Quadrant A | 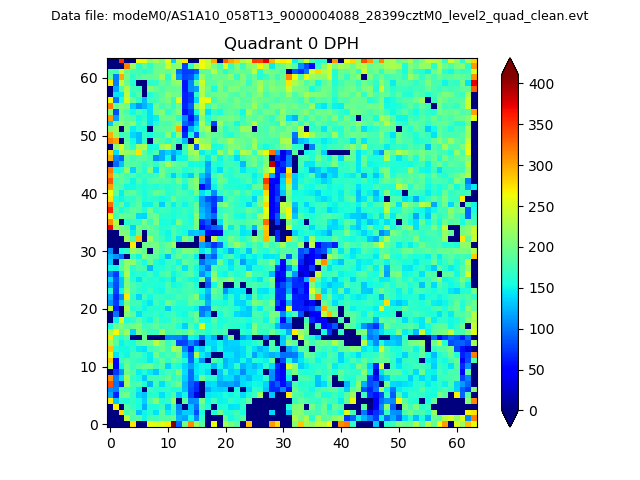 |
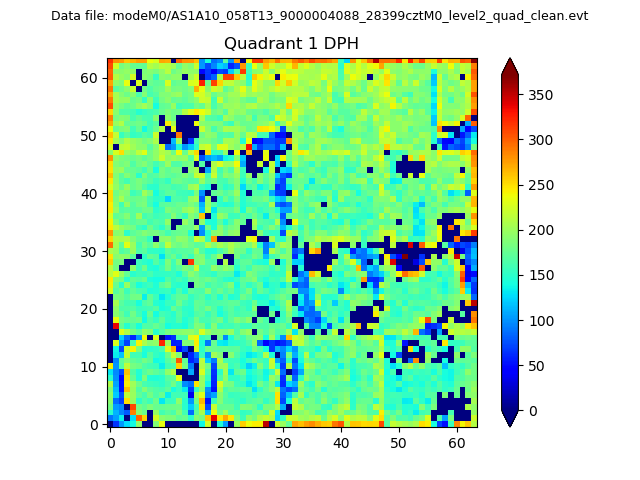 |
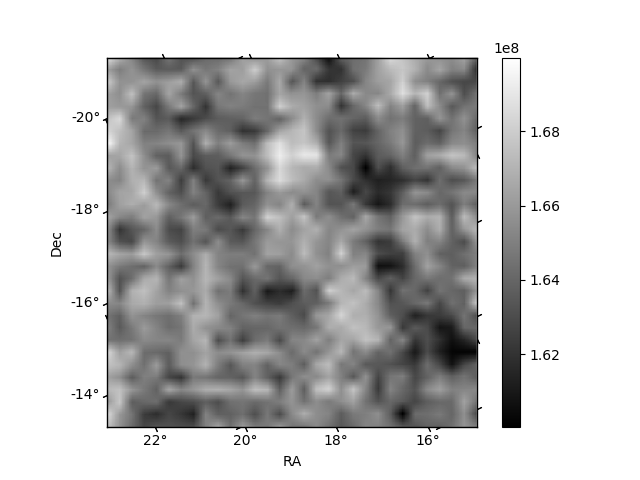
Quadrant B |
|---|---|---|---|
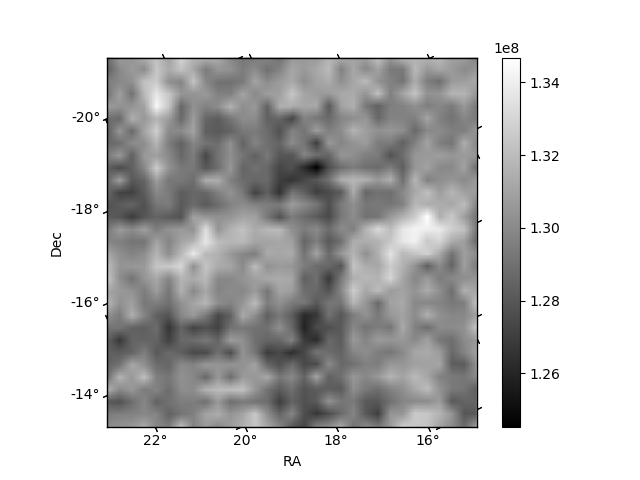
| Quadrant D | 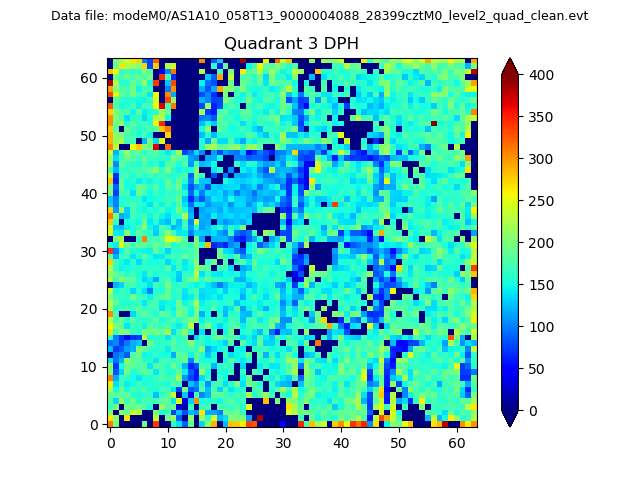 |
 |
Quadrant C |
| Plot type | Count rate plots | Images |
|---|---|---|
| Comparison with Poisson distribution Blue bars denote a histogram of data divided into 1 sec bins. Red curve is a Poisson curve with rate = median count rate of data. |
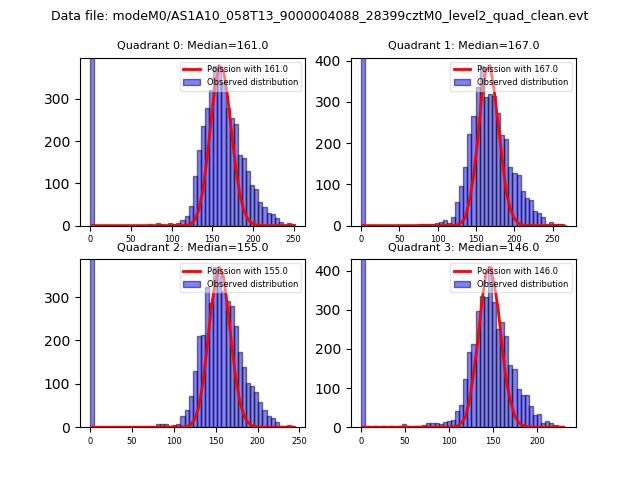 |
 |
| Quadrant-wise count rates Data is divided into 100 sec bins |
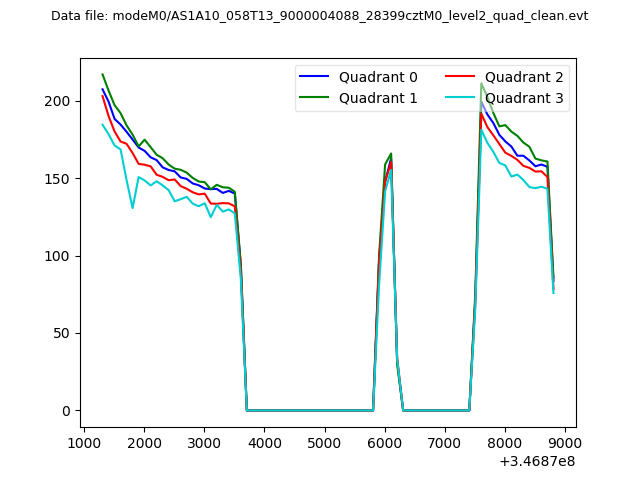 |
|
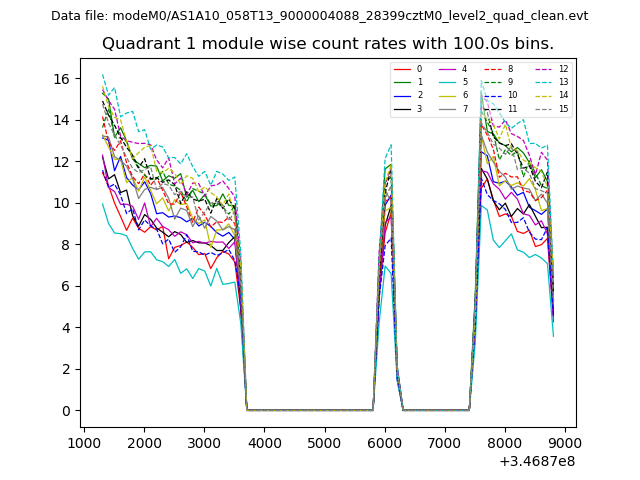
| Module-wise count rates for Quadrant A Data is divided into 100 sec bins |
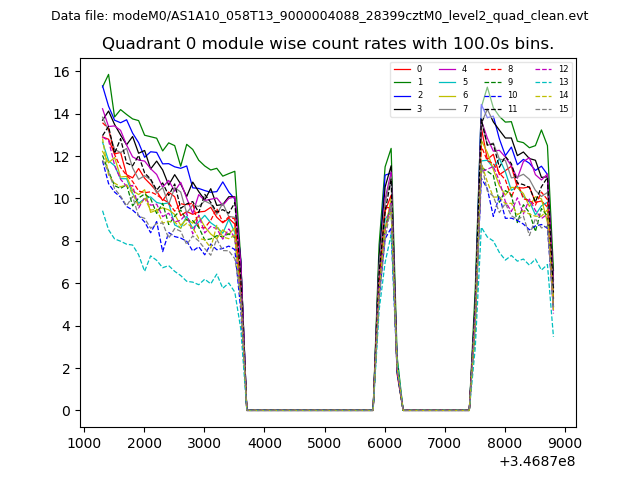 |
 |
| Module-wise count rates for Quadrant B Data is divided into 100 sec bins |
 |
 |
| Module-wise count rates for Quadrant C Data is divided into 100 sec bins |
 |
 |
| Module-wise count rates for Quadrant D Data is divided into 100 sec bins |
 |
 |
| Parameter | Plot |
|---|---|
| CZT HV Monitor |  |
| D_VDD | 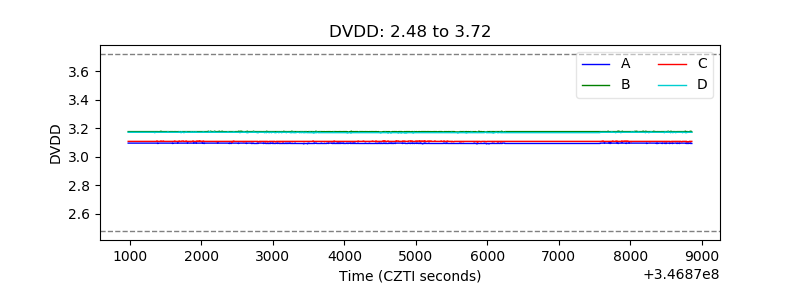 |
| Temperature 1 | 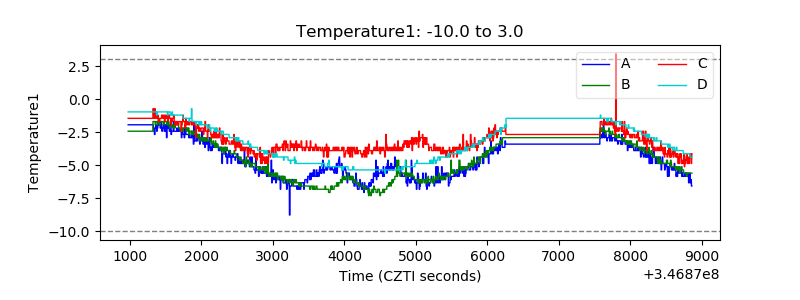 |
| Veto HV Monitor | 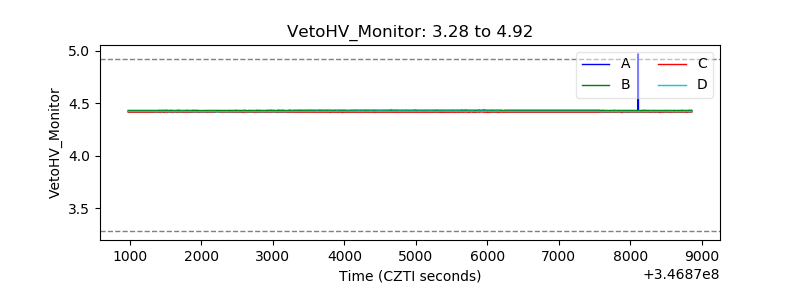 |
| Veto LLD | 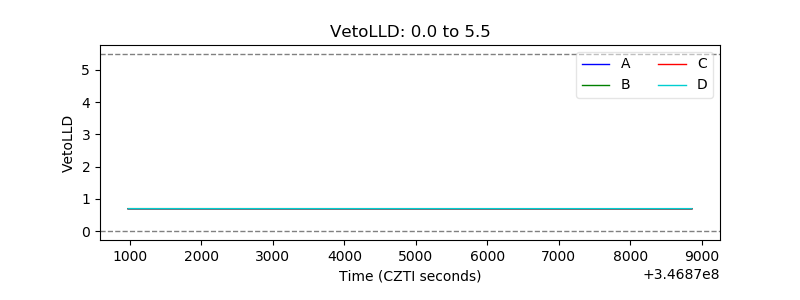 |
| Alpha Counter | 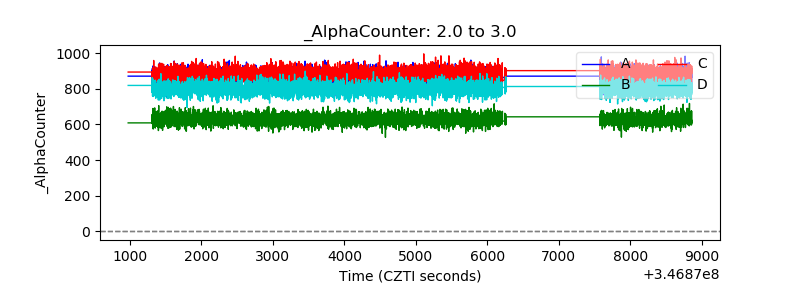 |
| _CPM_Rate | 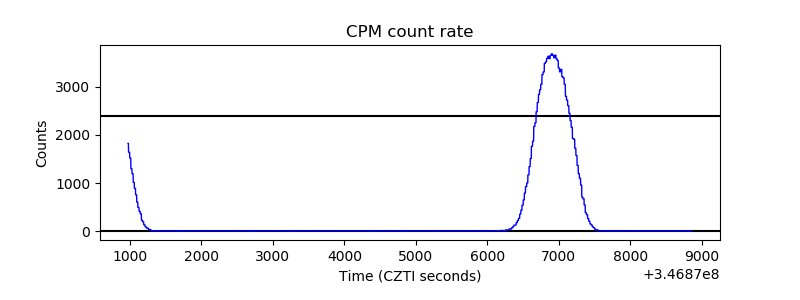 |
| CZT Counter | 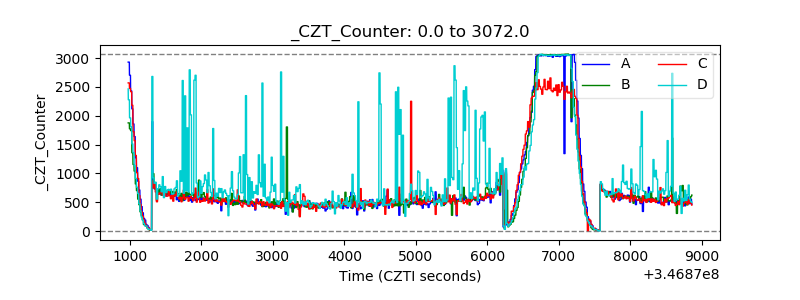 |
| +2.5 Volts monitor |  |
| +5 Volts monitor |  |
| _ROLL_ROT |  |
| _Roll_DEC | 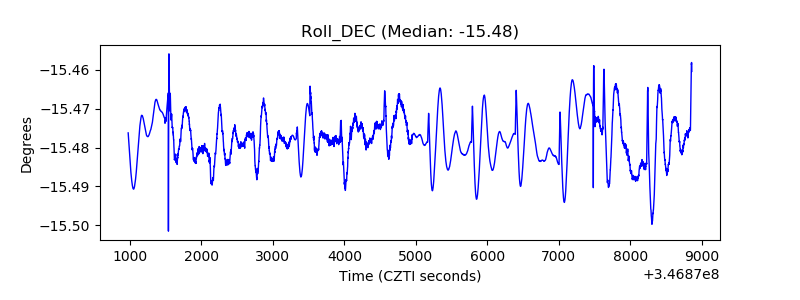 |
| _Roll_RA | 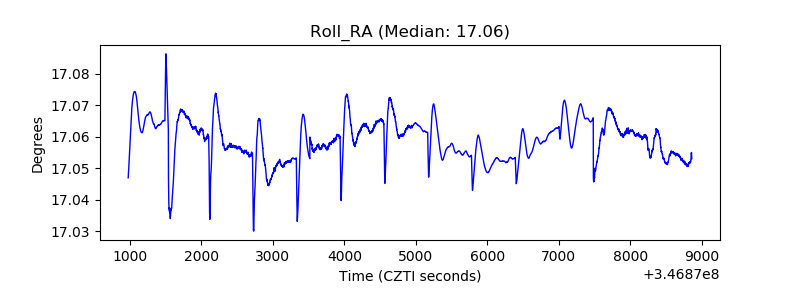 |
| Veto Counter |  |