| Param | Original file | Final file |
|---|---|---|
| Filename | modeM0/AS1A10_058T13_9000004088_28400cztM0_level2.evt | modeM0/AS1A10_058T13_9000004088_28400cztM0_level2_quad_clean.evt |
| Size (bytes) | 489,453,120 | 96,989,760 |
| Size | 466.8 MB | 92.5 MB |
| Events in quadrant A | 3,241,081 | 637,012 |
| Events in quadrant B | 3,498,321 | 663,448 |
| Events in quadrant C | 3,267,424 | 617,391 |
| Events in quadrant D | 4,394,423 | 585,106 |
| Mode M0 | |||
|---|---|---|---|
| Quadrant | BADHDUFLAG | Total packets | Discarded packets |
| A | 0 | 13360 | 0 |
| B | 0 | 14154 | 0 |
| C | 0 | 13319 | 0 |
| D | 0 | 17135 | 0 |
| Mode M9 | |||
|---|---|---|---|
| Quadrant | BADHDUFLAG | Total packets | Discarded packets |
| A | 0 | 24 | 0 |
| B | 0 | 25 | 0 |
| C | 0 | 25 | 0 |
| D | 0 | 25 | 0 |
| Quadrant | Total seconds | Saturated seconds | Saturation percentage |
|---|---|---|---|
| A | 6224 | 48 | 0.771208% |
| B | 6224 | 71 | 1.140746% |
| C | 6224 | 61 | 0.980077% |
| D | 6223 | 87 | 1.398040% |
Noise dominated data is calculated using 1-second bins in cleaned event files. If a bin has >2000 counts, and if more than 50% of those come from <1% of pixels, then it is considered to be noise-dominated and hence unusable.
| Quadrant | # 1 sec bins | Bins with >0 counts | Bins with >2000 counts | High rate bins dominated by noise | Noise dominated (total time) | Noise dominated (detector-on time) | Marked lightcurve |
|---|---|---|---|---|---|---|---|
| A | 7599 | 6225 | 1 | 1 | 0.01% | 0.02% | 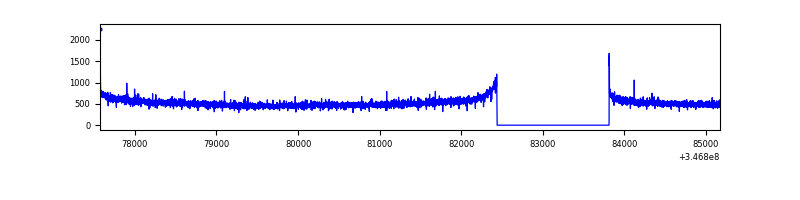 |
| B | 7599 | 6225 | 9 | 9 | 0.12% | 0.14% | 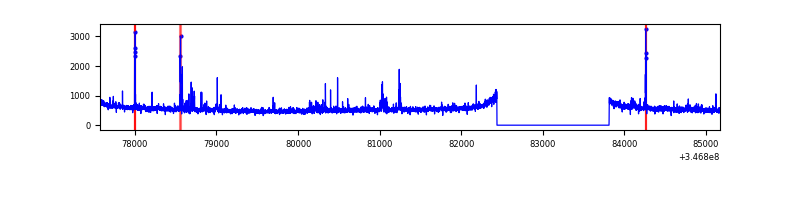 |
| C | 7599 | 6225 | 0 | 0 | 0.00% | 0.00% | 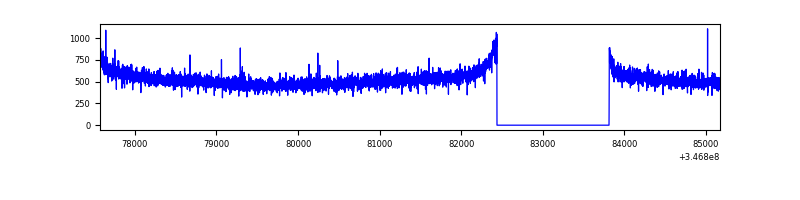 |
| D | 7598 | 6224 | 92 | 92 | 1.21% | 1.48% | 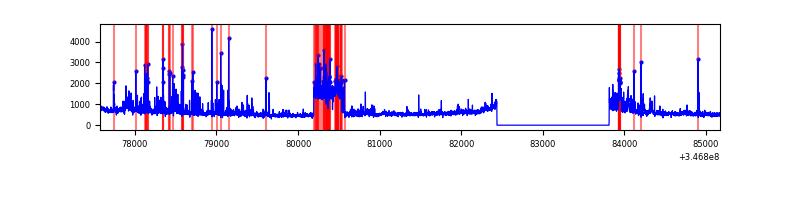 |
Top three noisy pixels from each quadrant. If the there are fewer than three noisy pixels in the level2.evt file, extra rows are filled as -1
| Pixel properties | Quadrant properties | ||||||
|---|---|---|---|---|---|---|---|
| Quadrant | DetID | PixID | Counts | Sigma | Mean | Median | Sigma |
| A | 13 | 254 | 9992 | 55.12 | 836 | 821 | 166.4 |
| A | 8 | 192 | 9051 | 49.46 | 836 | 821 | 166.4 |
| A | 3 | 137 | 7722 | 41.47 | 836 | 821 | 166.4 |
| B | 10 | 245 | 152921 | 956.58 | 841 | 822 | 159.0 |
| B | 10 | 246 | 30164 | 184.54 | 841 | 822 | 159.0 |
| B | 12 | 111 | 18536 | 111.41 | 841 | 822 | 159.0 |
| C | 14 | 238 | 131744 | 696.85 | 804 | 813 | 187.9 |
| C | 7 | 220 | 7354 | 34.81 | 804 | 813 | 187.9 |
| C | 13 | 61 | 5567 | 25.3 | 804 | 813 | 187.9 |
| D | 8 | 195 | 782089 | 4105.1 | 795 | 775 | 190.3 |
| D | 1 | 52 | 402162 | 2108.93 | 795 | 775 | 190.3 |
| D | 2 | 250 | 87964 | 458.1 | 795 | 775 | 190.3 |
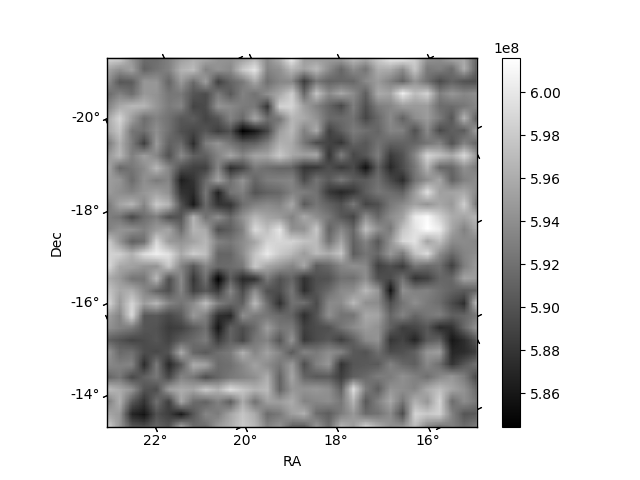
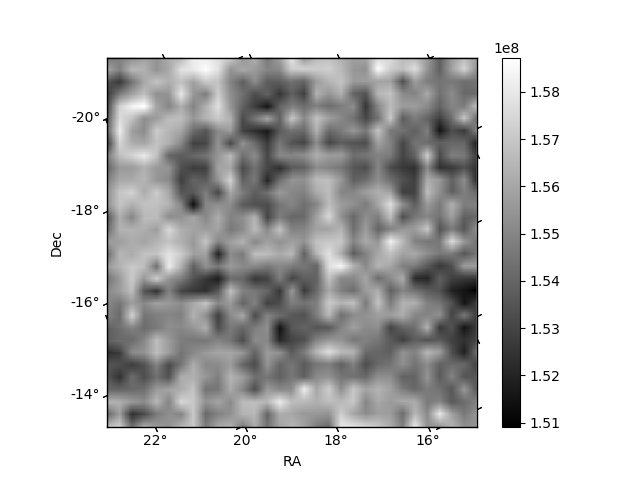
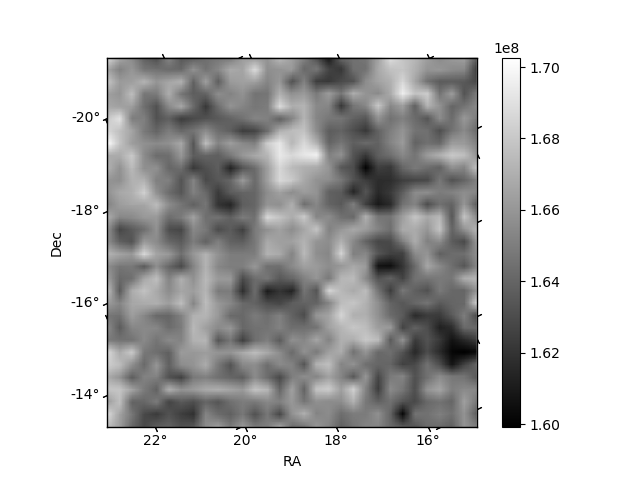
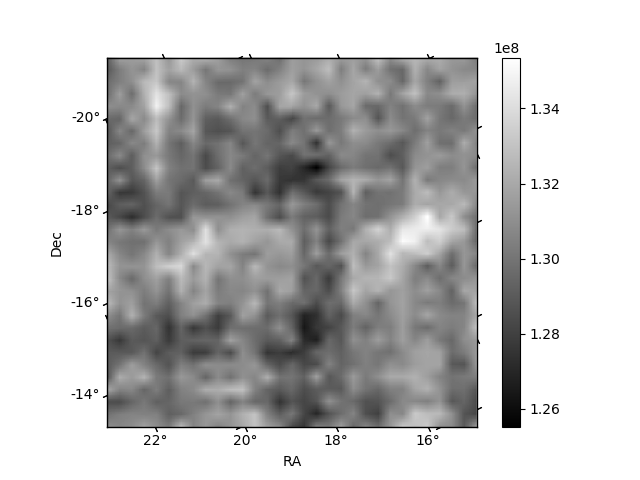
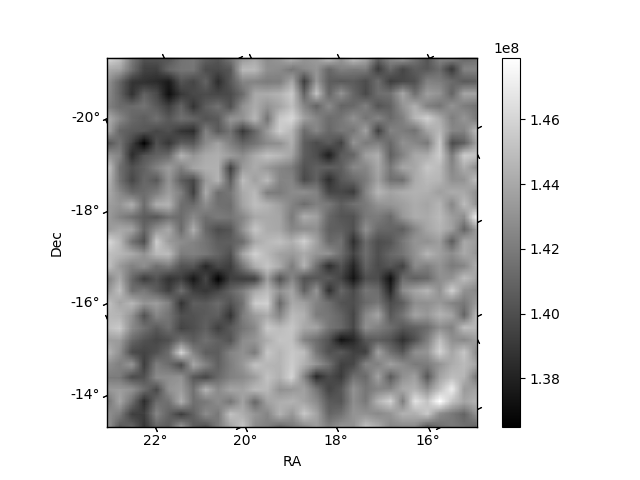
Histogram calculated using DETX and DETY for each event in the final _common_clean file
| Quadrant A | 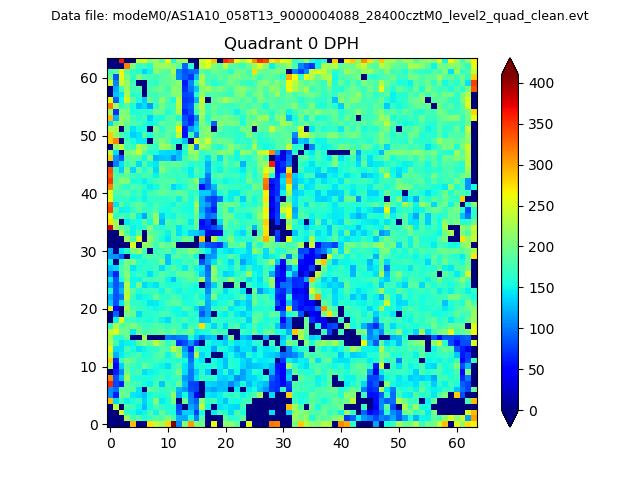 |
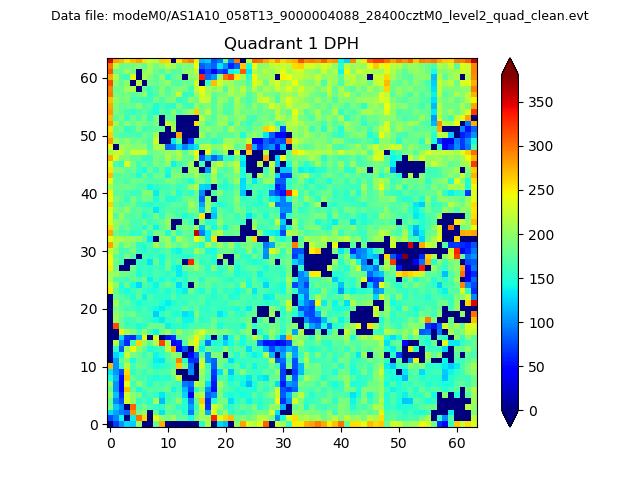 |
Quadrant B |
|---|---|---|---|
| Quadrant D | 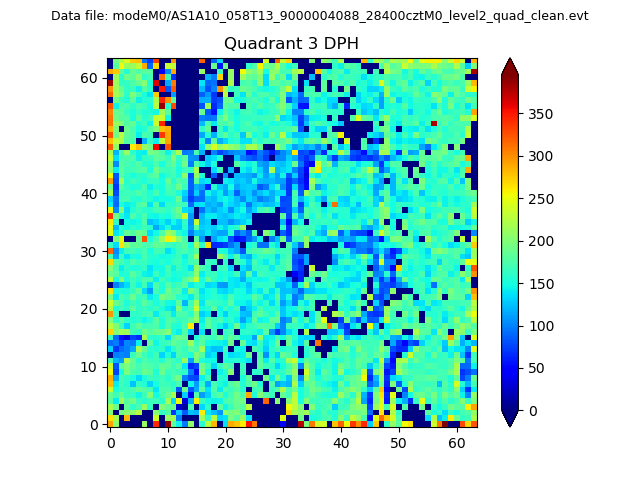 |
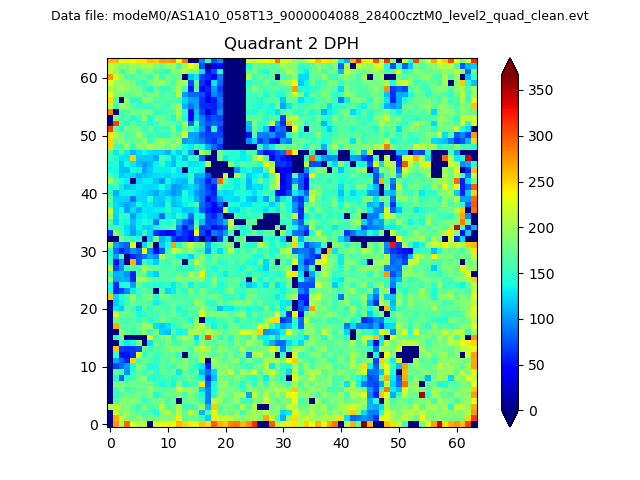 |
Quadrant C |
| Plot type | Count rate plots | Images |
|---|---|---|
| Comparison with Poisson distribution Blue bars denote a histogram of data divided into 1 sec bins. Red curve is a Poisson curve with rate = median count rate of data. |
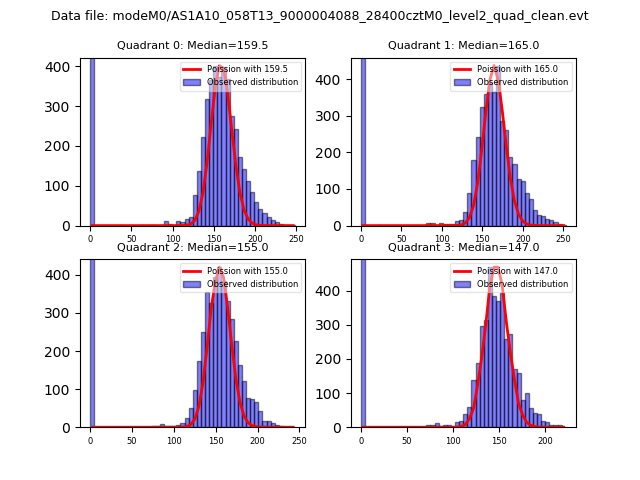 |
 |
| Quadrant-wise count rates Data is divided into 100 sec bins |
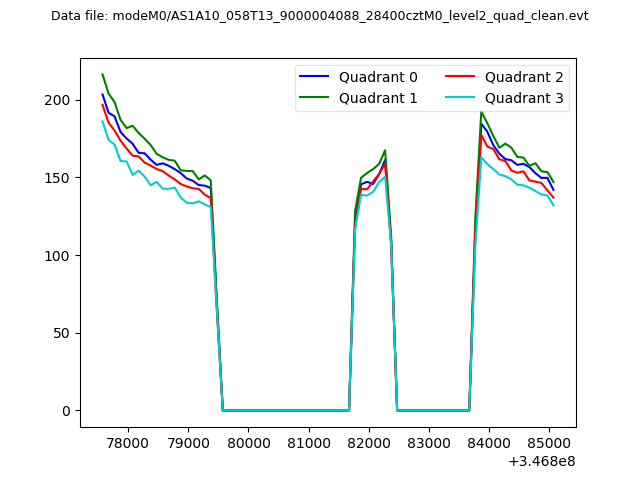 |
|
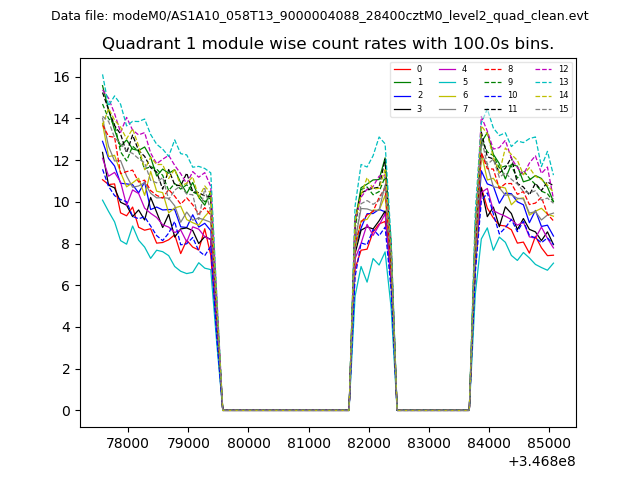
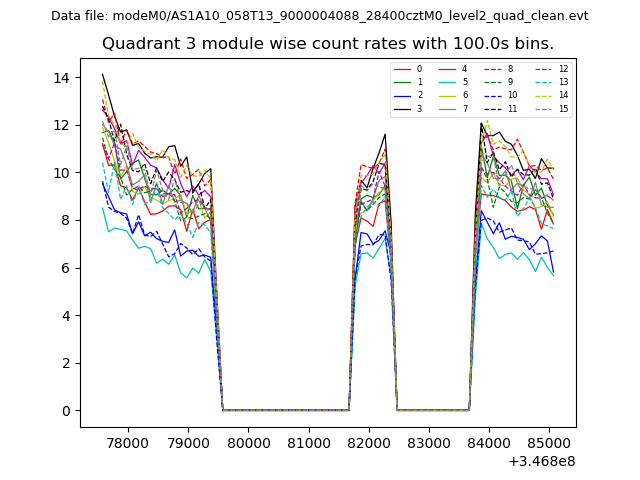
| Module-wise count rates for Quadrant A Data is divided into 100 sec bins |
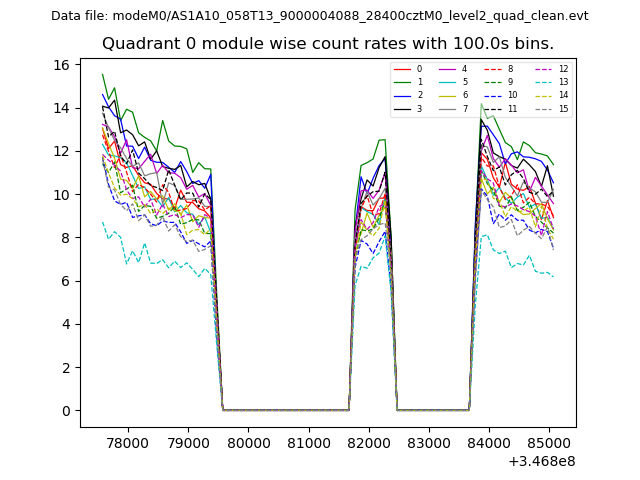 |
 |
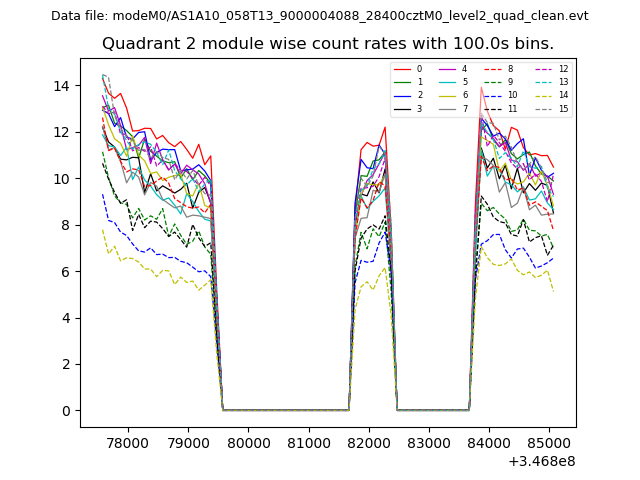
| Module-wise count rates for Quadrant B Data is divided into 100 sec bins |
 |
 |
| Module-wise count rates for Quadrant C Data is divided into 100 sec bins |
 |
 |
| Module-wise count rates for Quadrant D Data is divided into 100 sec bins |
 |
 |
| Parameter | Plot |
|---|---|
| CZT HV Monitor | 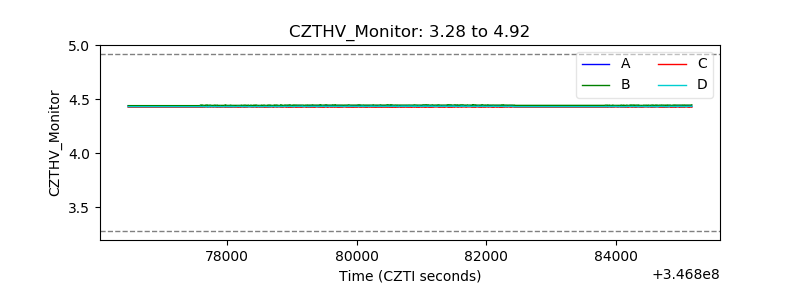 |
| D_VDD | 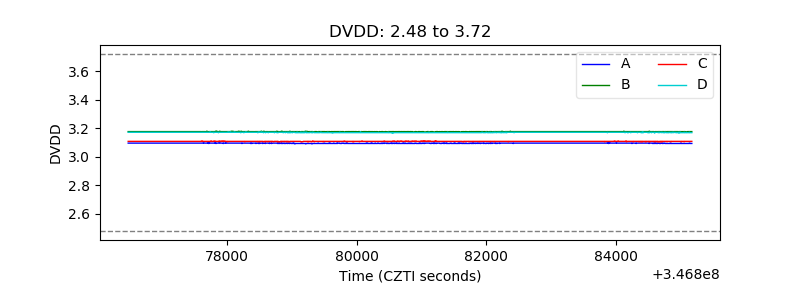 |
| Temperature 1 | 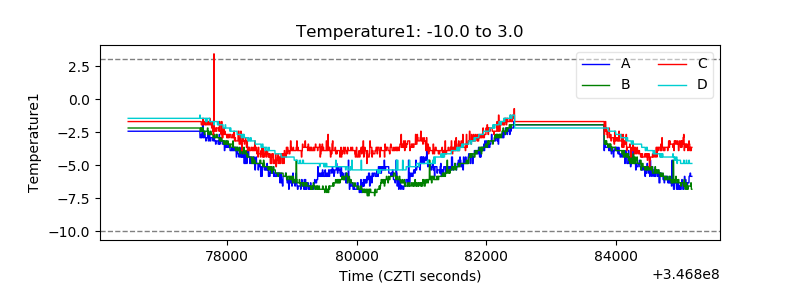 |
| Veto HV Monitor | 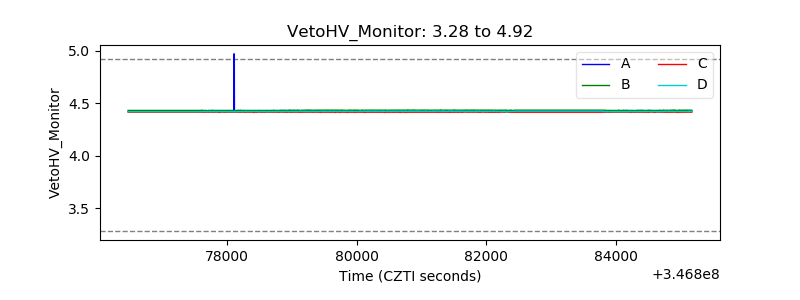 |
| Veto LLD | 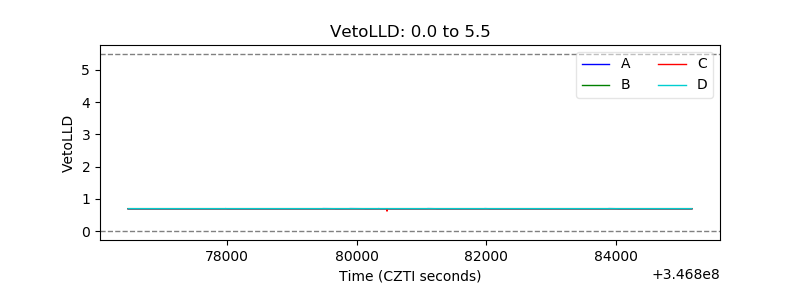 |
| Alpha Counter | 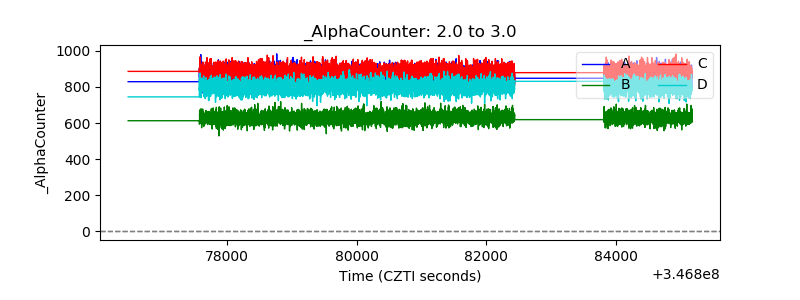 |
| _CPM_Rate | 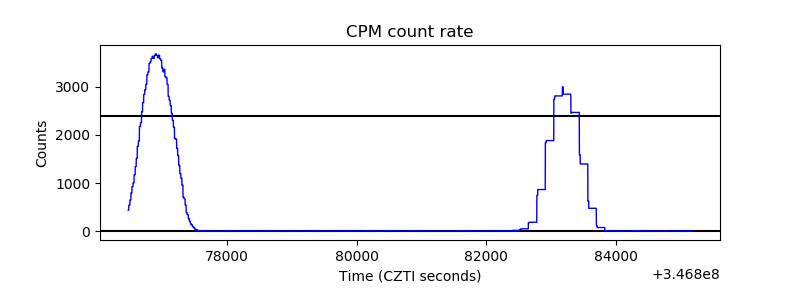 |
| CZT Counter | 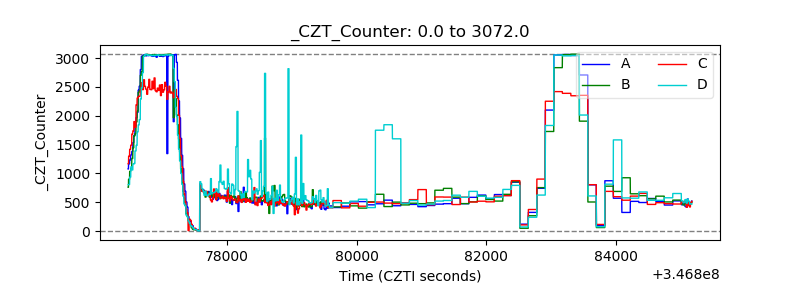 |
| +2.5 Volts monitor | 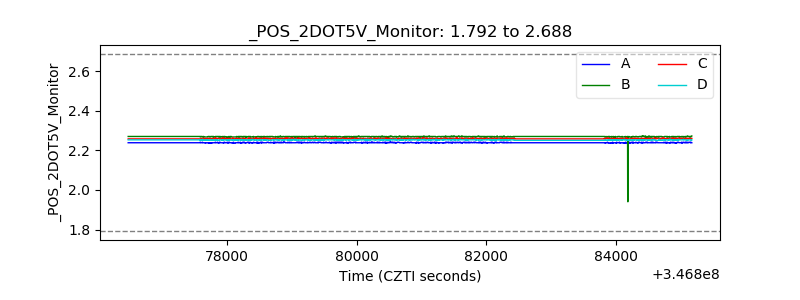 |
| +5 Volts monitor | 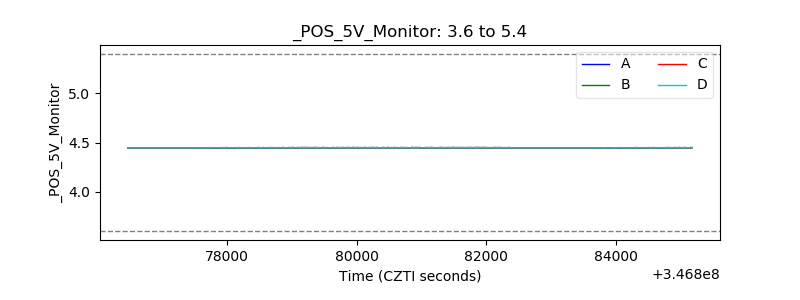 |
| _ROLL_ROT | 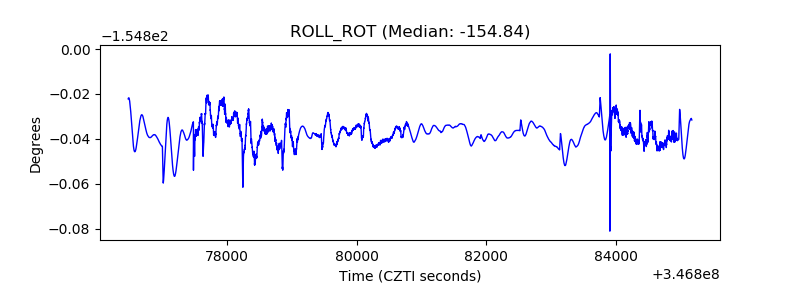 |
| _Roll_DEC | 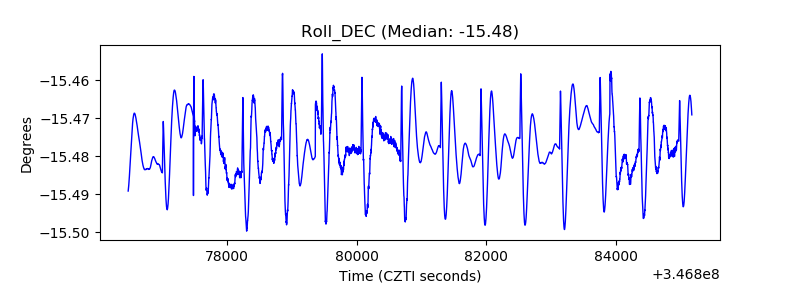 |
| _Roll_RA | 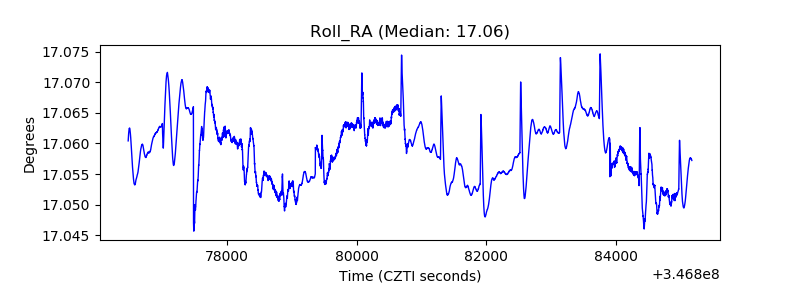 |
| Veto Counter | 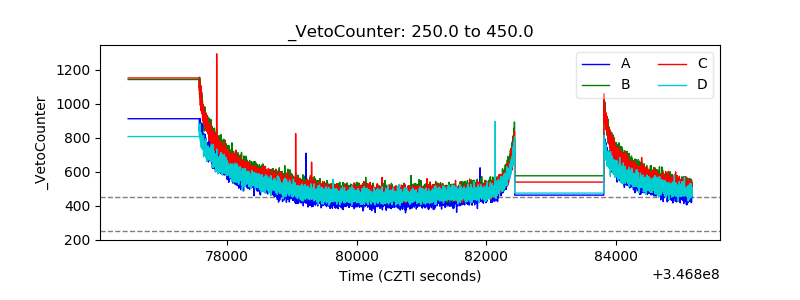 |