| Param | Original file | Final file |
|---|---|---|
| Filename | modeM0/AS1A10_058T13_9000004088_28401cztM0_level2.evt | modeM0/AS1A10_058T13_9000004088_28401cztM0_level2_quad_clean.evt |
| Size (bytes) | 484,211,520 | 90,630,720 |
| Size | 461.8 MB | 86.4 MB |
| Events in quadrant A | 3,183,281 | 586,989 |
| Events in quadrant B | 3,584,115 | 605,550 |
| Events in quadrant C | 3,224,167 | 570,633 |
| Events in quadrant D | 4,248,950 | 545,364 |
| Mode M0 | |||
|---|---|---|---|
| Quadrant | BADHDUFLAG | Total packets | Discarded packets |
| A | 0 | 13181 | 0 |
| B | 0 | 14448 | 0 |
| C | 0 | 13186 | 0 |
| D | 0 | 16523 | 0 |
| Mode M9 | |||
|---|---|---|---|
| Quadrant | BADHDUFLAG | Total packets | Discarded packets |
| A | 0 | 20 | 0 |
| B | 0 | 21 | 0 |
| C | 0 | 21 | 0 |
| D | 0 | 21 | 0 |
| Quadrant | Total seconds | Saturated seconds | Saturation percentage |
|---|---|---|---|
| A | 6254 | 28 | 0.447713% |
| B | 6254 | 95 | 1.519028% |
| C | 6254 | 86 | 1.375120% |
| D | 6254 | 108 | 1.726895% |
Noise dominated data is calculated using 1-second bins in cleaned event files. If a bin has >2000 counts, and if more than 50% of those come from <1% of pixels, then it is considered to be noise-dominated and hence unusable.
| Quadrant | # 1 sec bins | Bins with >0 counts | Bins with >2000 counts | High rate bins dominated by noise | Noise dominated (total time) | Noise dominated (detector-on time) | Marked lightcurve |
|---|---|---|---|---|---|---|---|
| A | 7554 | 6255 | 0 | 0 | 0.00% | 0.00% | 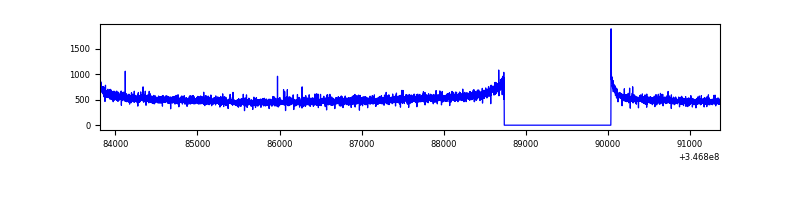 |
| B | 7554 | 6255 | 26 | 26 | 0.34% | 0.42% | 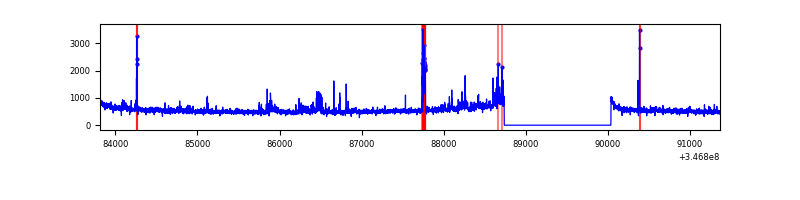 |
| C | 7554 | 6255 | 2 | 2 | 0.03% | 0.03% | 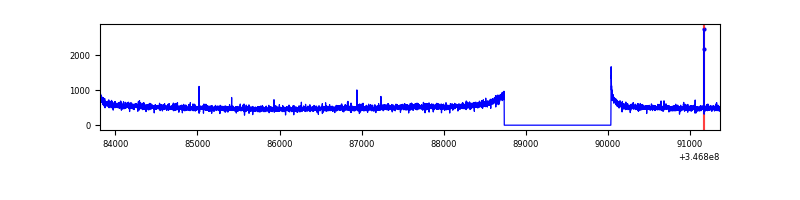 |
| D | 7554 | 6255 | 95 | 95 | 1.26% | 1.52% | 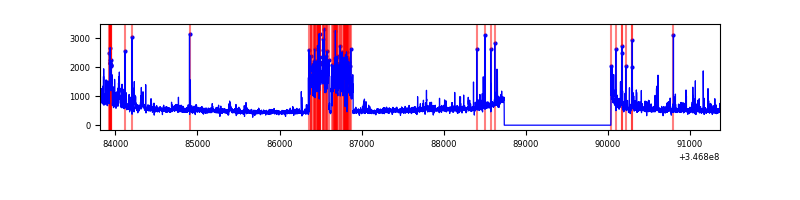 |
Top three noisy pixels from each quadrant. If the there are fewer than three noisy pixels in the level2.evt file, extra rows are filled as -1
| Pixel properties | Quadrant properties | ||||||
|---|---|---|---|---|---|---|---|
| Quadrant | DetID | PixID | Counts | Sigma | Mean | Median | Sigma |
| A | 4 | 2 | 11846 | 67.51 | 819 | 804 | 163.5 |
| A | 13 | 254 | 11024 | 62.49 | 819 | 804 | 163.5 |
| A | 13 | 6 | 8115 | 44.7 | 819 | 804 | 163.5 |
| B | 10 | 245 | 231632 | 1498.56 | 822 | 805 | 154.0 |
| B | 15 | 33 | 62049 | 397.6 | 822 | 805 | 154.0 |
| B | 10 | 246 | 27554 | 173.66 | 822 | 805 | 154.0 |
| C | 14 | 238 | 129528 | 696.0 | 791 | 797 | 185.0 |
| C | 7 | 220 | 9485 | 46.97 | 791 | 797 | 185.0 |
| C | 0 | 10 | 5766 | 26.87 | 791 | 797 | 185.0 |
| D | 8 | 195 | 876170 | 4685.16 | 782 | 763 | 186.8 |
| D | 1 | 52 | 269849 | 1440.14 | 782 | 763 | 186.8 |
| D | 7 | 80 | 64960 | 343.58 | 782 | 763 | 186.8 |
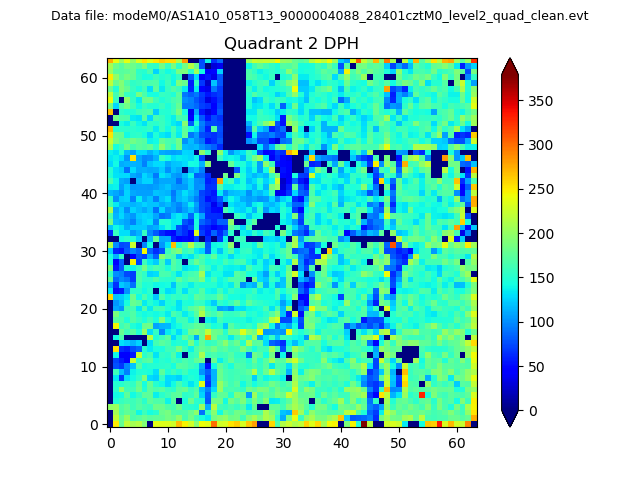
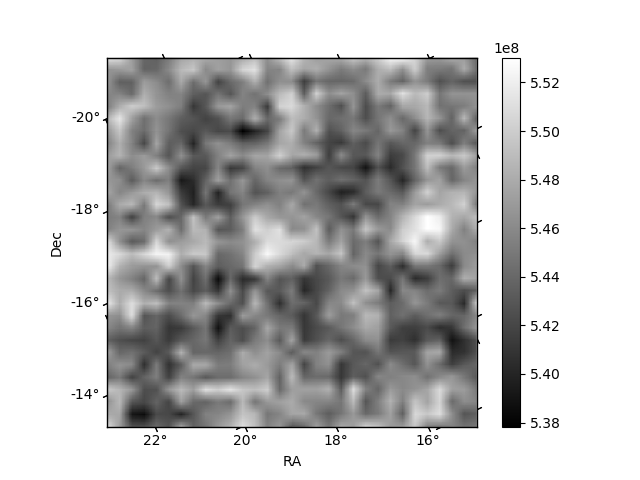
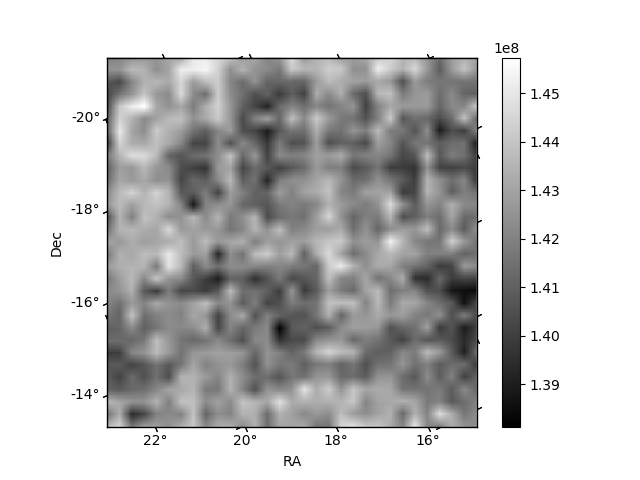
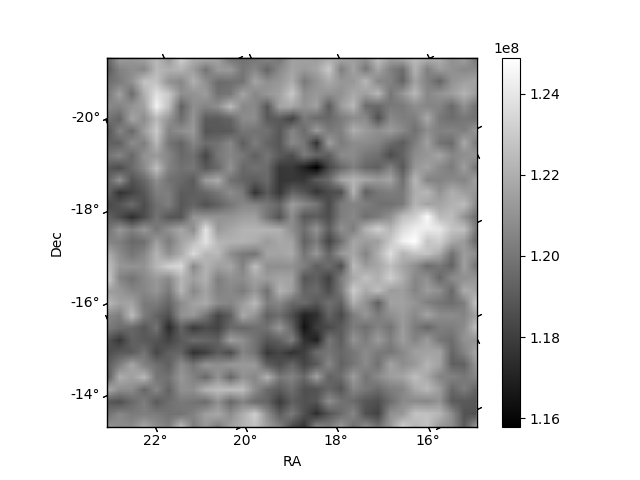
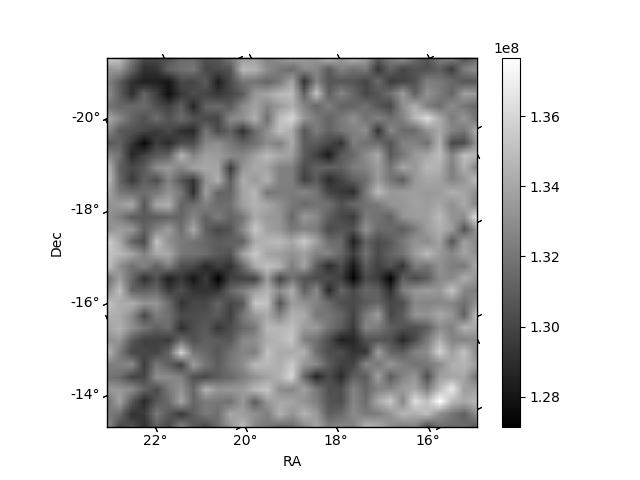
Histogram calculated using DETX and DETY for each event in the final _common_clean file
| Quadrant A | 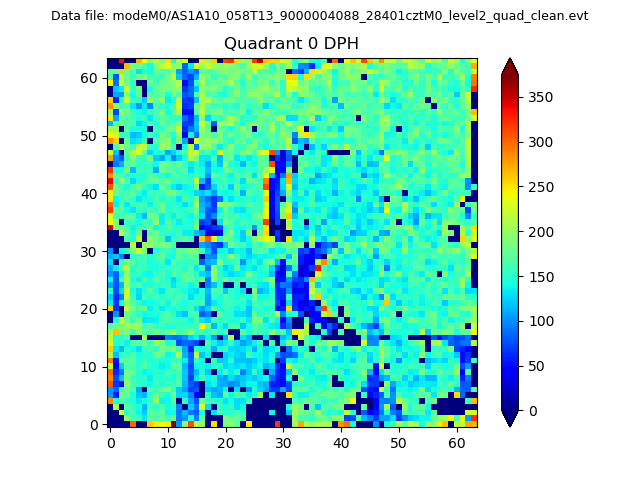 |
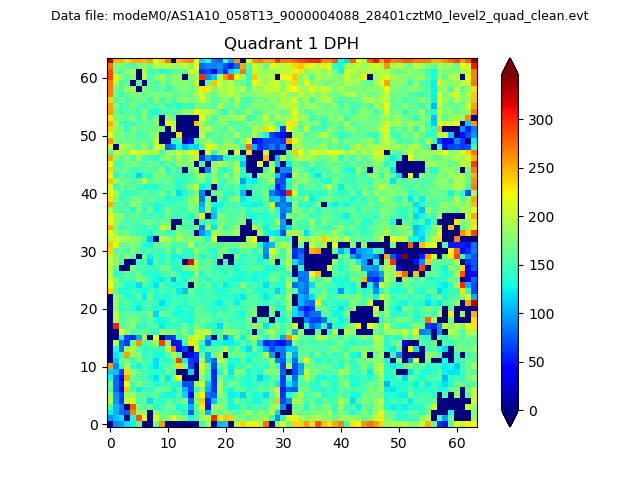 |
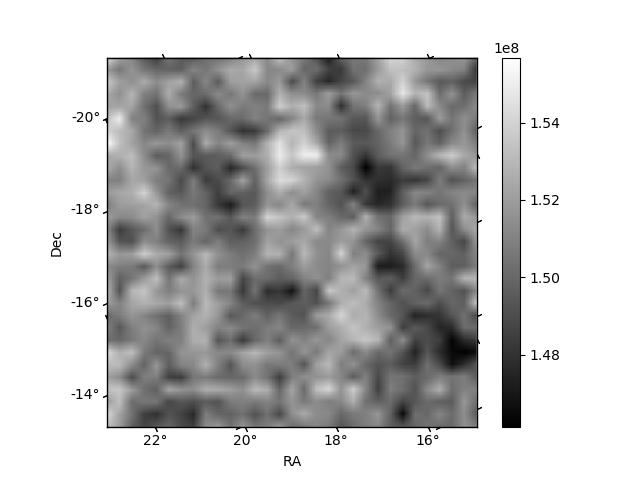
Quadrant B |
|---|---|---|---|
| Quadrant D | 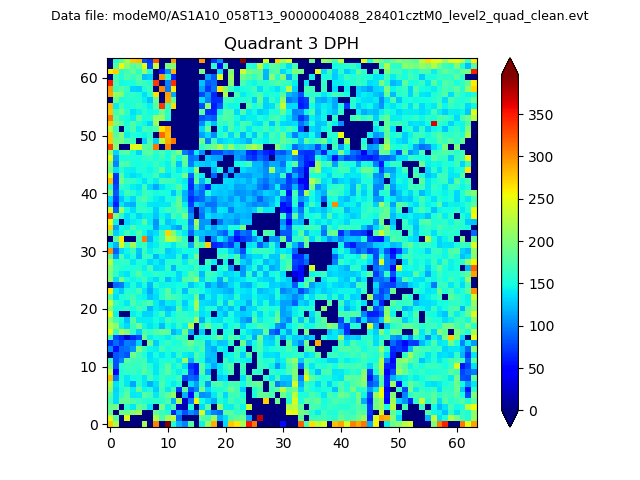 |
 |
Quadrant C |
| Plot type | Count rate plots | Images |
|---|---|---|
| Comparison with Poisson distribution Blue bars denote a histogram of data divided into 1 sec bins. Red curve is a Poisson curve with rate = median count rate of data. |
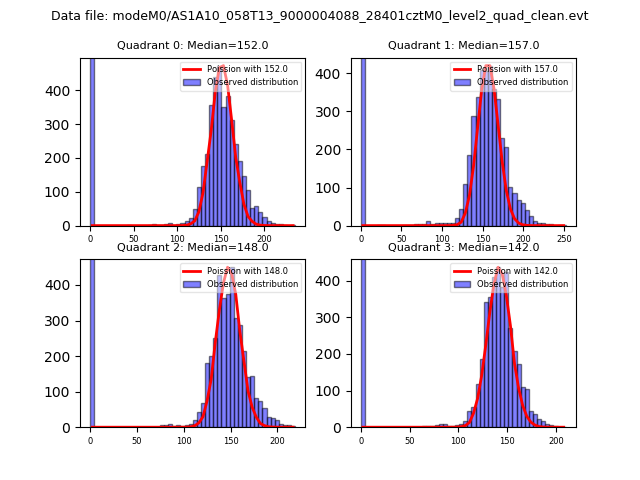 |
 |
| Quadrant-wise count rates Data is divided into 100 sec bins |
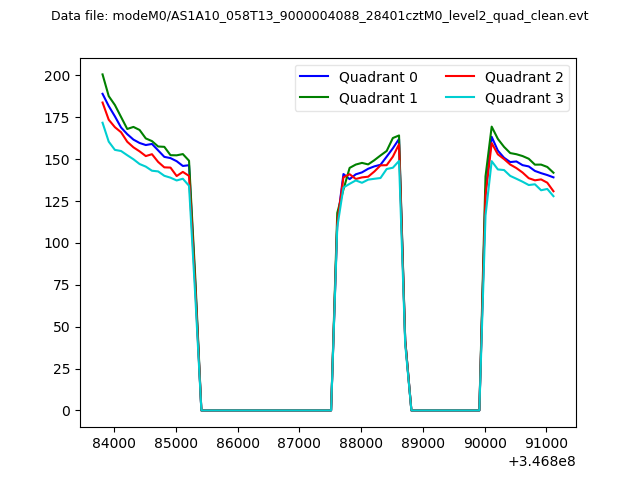 |
|
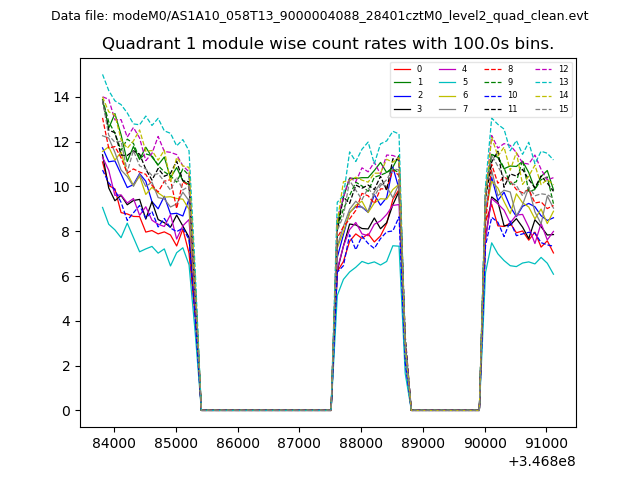
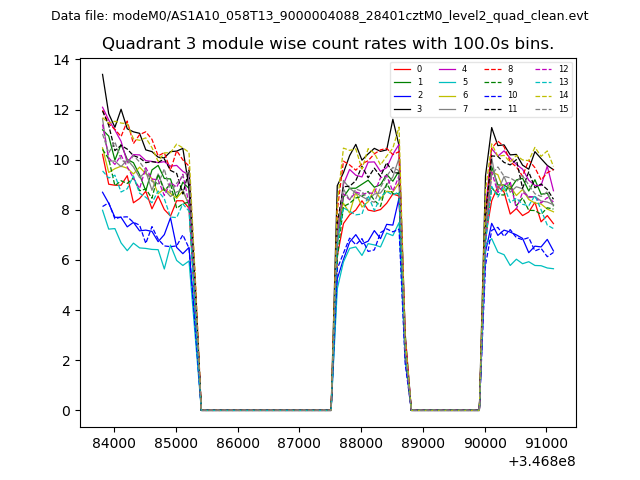
| Module-wise count rates for Quadrant A Data is divided into 100 sec bins |
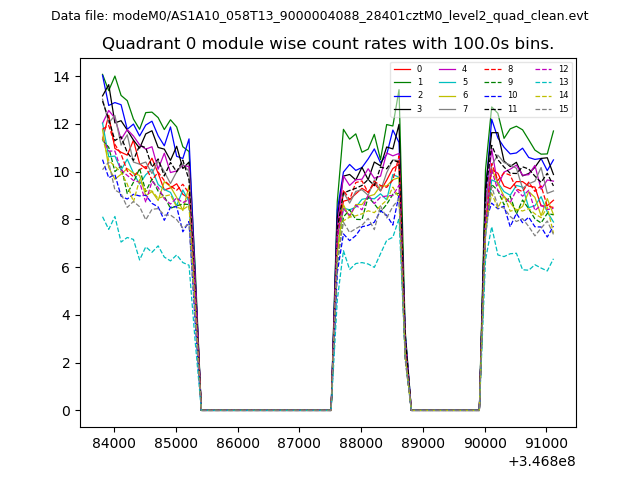 |
 |
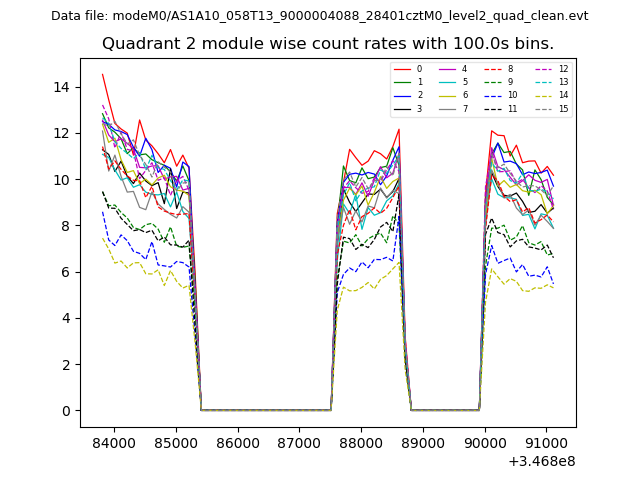
| Module-wise count rates for Quadrant B Data is divided into 100 sec bins |
 |
 |
| Module-wise count rates for Quadrant C Data is divided into 100 sec bins |
 |
 |
| Module-wise count rates for Quadrant D Data is divided into 100 sec bins |
 |
 |
| Parameter | Plot |
|---|---|
| CZT HV Monitor | 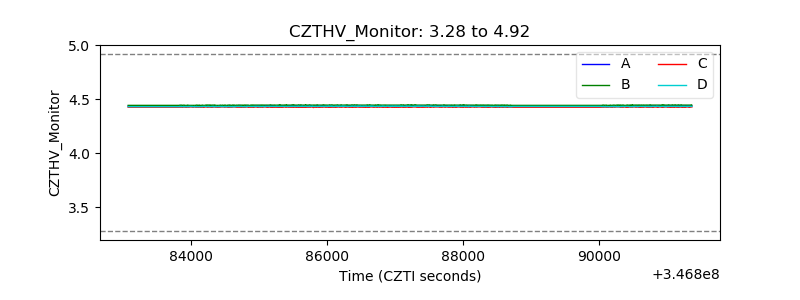 |
| D_VDD | 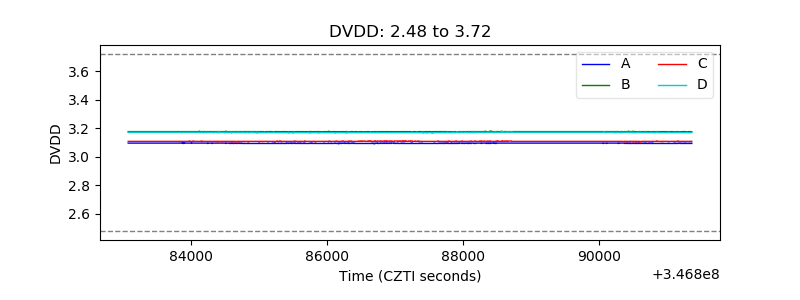 |
| Temperature 1 | 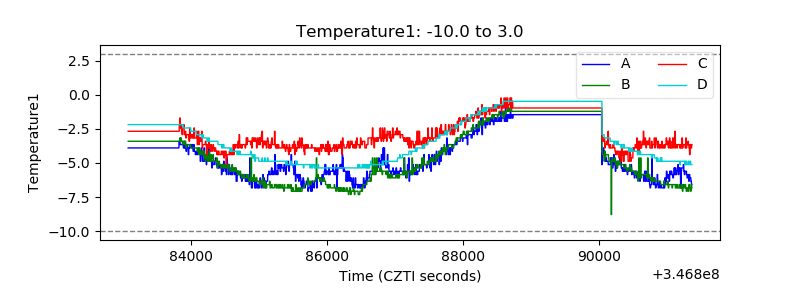 |
| Veto HV Monitor | 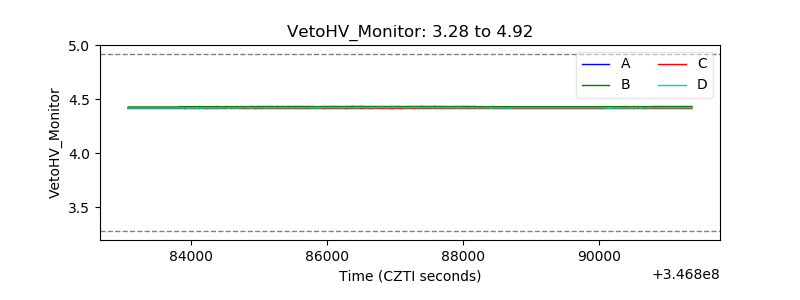 |
| Veto LLD | 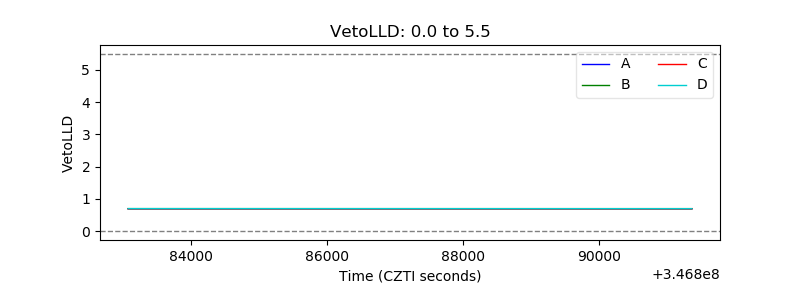 |
| Alpha Counter | 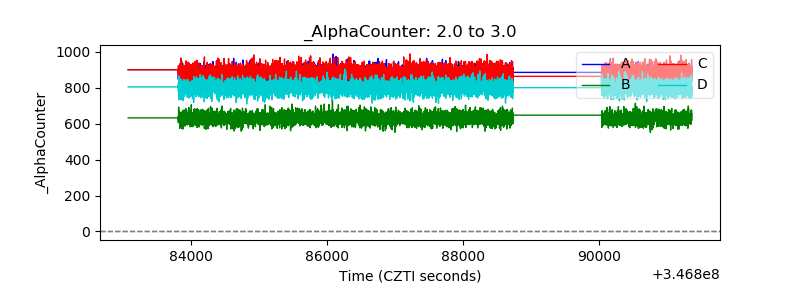 |
| _CPM_Rate | 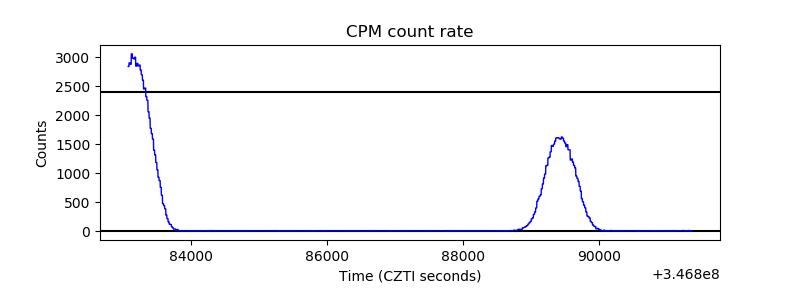 |
| CZT Counter | 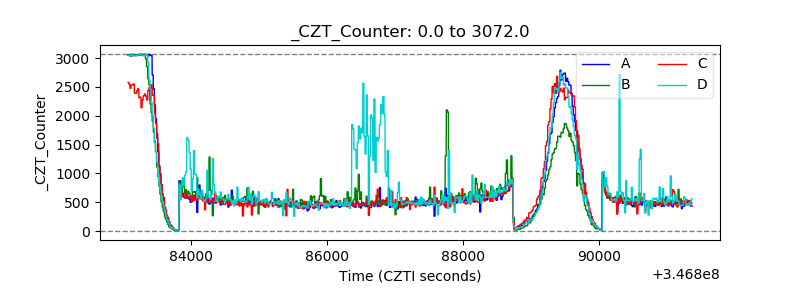 |
| +2.5 Volts monitor |  |
| +5 Volts monitor |  |
| _ROLL_ROT |  |
| _Roll_DEC |  |
| _Roll_RA | 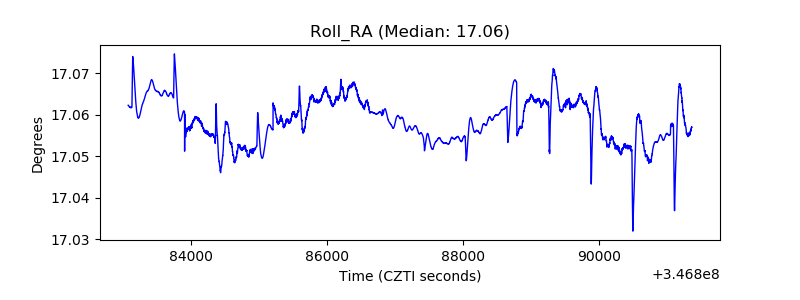 |
| Veto Counter | 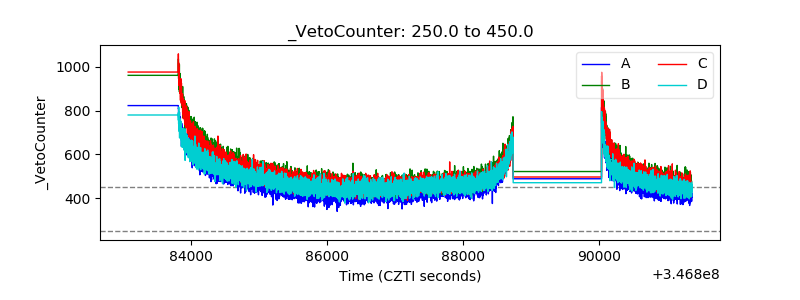 |