| Param | Original file | Final file |
|---|---|---|
| Filename | modeM0/AS1A10_058T13_9000004088_28402cztM0_level2.evt | modeM0/AS1A10_058T13_9000004088_28402cztM0_level2_quad_clean.evt |
| Size (bytes) | 501,505,920 | 84,571,200 |
| Size | 478.3 MB | 80.7 MB |
| Events in quadrant A | 3,326,568 | 529,230 |
| Events in quadrant B | 3,672,380 | 543,376 |
| Events in quadrant C | 3,384,120 | 516,646 |
| Events in quadrant D | 4,341,372 | 495,490 |
| Mode M0 | |||
|---|---|---|---|
| Quadrant | BADHDUFLAG | Total packets | Discarded packets |
| A | 0 | 14092 | 0 |
| B | 0 | 14990 | 0 |
| C | 0 | 14086 | 0 |
| D | 0 | 17138 | 0 |
| Mode M9 | |||
|---|---|---|---|
| Quadrant | BADHDUFLAG | Total packets | Discarded packets |
| A | 0 | 13 | 0 |
| B | 0 | 14 | 0 |
| C | 0 | 14 | 0 |
| D | 0 | 14 | 0 |
| Quadrant | Total seconds | Saturated seconds | Saturation percentage |
|---|---|---|---|
| A | 6829 | 25 | 0.366086% |
| B | 6829 | 80 | 1.171475% |
| C | 6829 | 67 | 0.981110% |
| D | 6828 | 155 | 2.270064% |
Noise dominated data is calculated using 1-second bins in cleaned event files. If a bin has >2000 counts, and if more than 50% of those come from <1% of pixels, then it is considered to be noise-dominated and hence unusable.
| Quadrant | # 1 sec bins | Bins with >0 counts | Bins with >2000 counts | High rate bins dominated by noise | Noise dominated (total time) | Noise dominated (detector-on time) | Marked lightcurve |
|---|---|---|---|---|---|---|---|
| A | 7874 | 6830 | 0 | 0 | 0.00% | 0.00% | 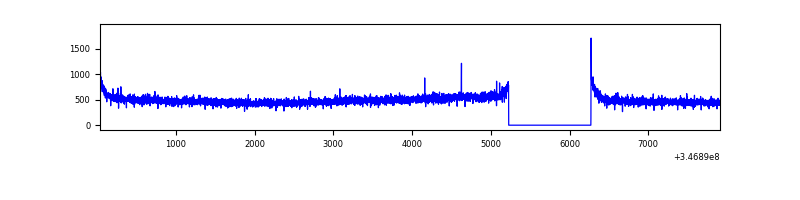 |
| B | 7874 | 6830 | 30 | 30 | 0.38% | 0.44% | 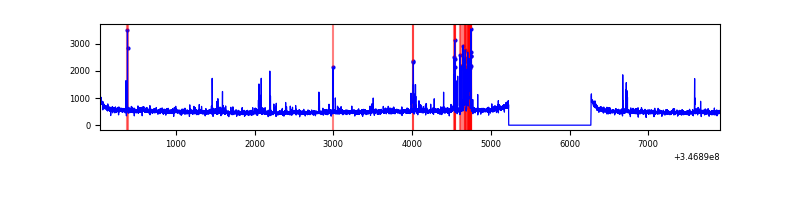 |
| C | 7874 | 6830 | 2 | 2 | 0.03% | 0.03% | 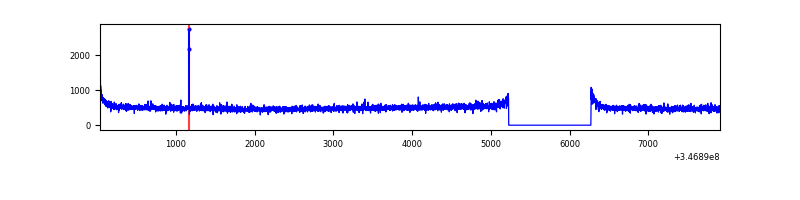 |
| D | 7873 | 6829 | 132 | 132 | 1.68% | 1.93% | 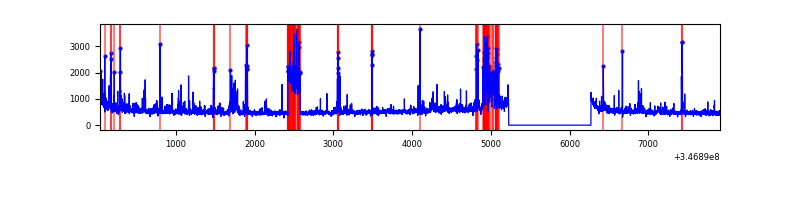 |
Top three noisy pixels from each quadrant. If the there are fewer than three noisy pixels in the level2.evt file, extra rows are filled as -1
| Pixel properties | Quadrant properties | ||||||
|---|---|---|---|---|---|---|---|
| Quadrant | DetID | PixID | Counts | Sigma | Mean | Median | Sigma |
| A | 13 | 254 | 11433 | 61.0 | 859 | 843 | 173.6 |
| A | 3 | 137 | 8284 | 42.86 | 859 | 843 | 173.6 |
| A | 8 | 192 | 7256 | 36.94 | 859 | 843 | 173.6 |
| B | 10 | 246 | 123930 | 747.31 | 862 | 842 | 164.7 |
| B | 10 | 245 | 95300 | 573.49 | 862 | 842 | 164.7 |
| B | 0 | 230 | 25436 | 149.32 | 862 | 842 | 164.7 |
| C | 14 | 238 | 132564 | 674.39 | 830 | 838 | 195.3 |
| C | 7 | 220 | 9425 | 43.96 | 830 | 838 | 195.3 |
| C | 0 | 10 | 6009 | 26.47 | 830 | 838 | 195.3 |
| D | 8 | 195 | 551074 | 2781.27 | 825 | 801 | 197.8 |
| D | 1 | 52 | 369233 | 1862.18 | 825 | 801 | 197.8 |
| D | 2 | 250 | 261041 | 1315.34 | 825 | 801 | 197.8 |
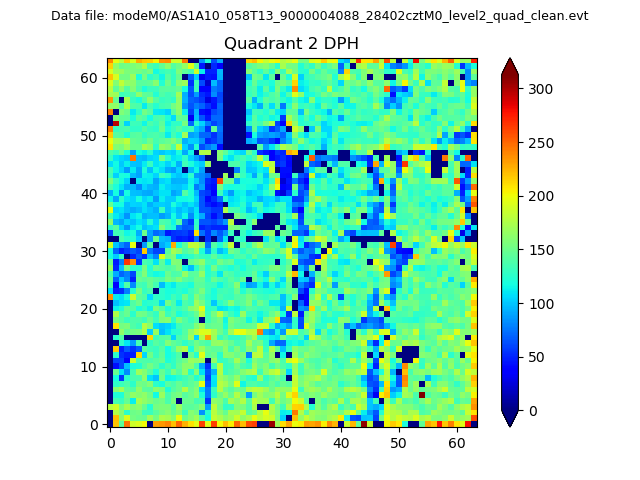
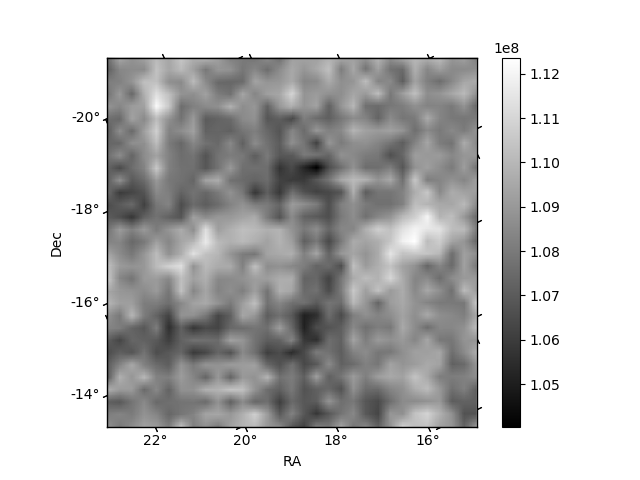
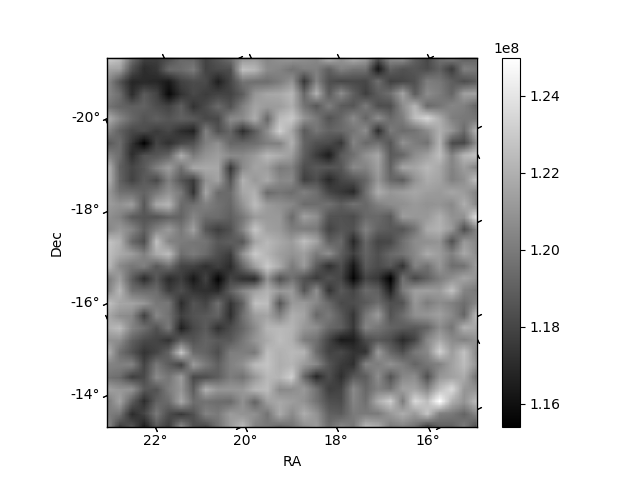
Histogram calculated using DETX and DETY for each event in the final _common_clean file
| Quadrant A | 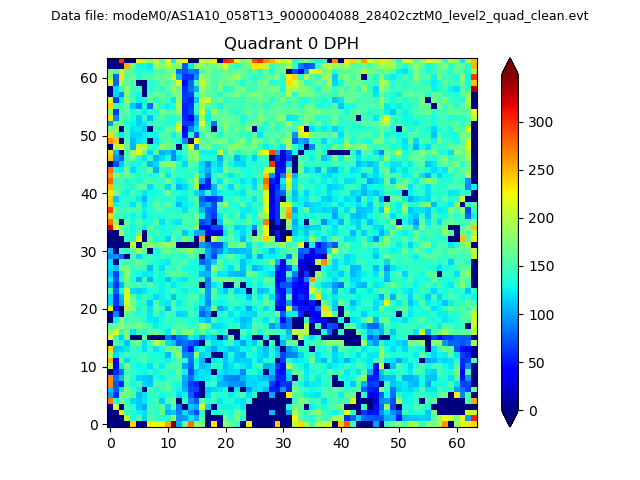 |
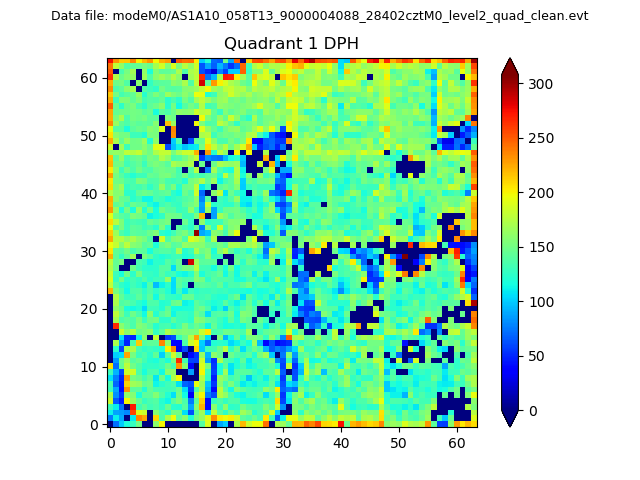 |
Quadrant B |
|---|---|---|---|
| Quadrant D | 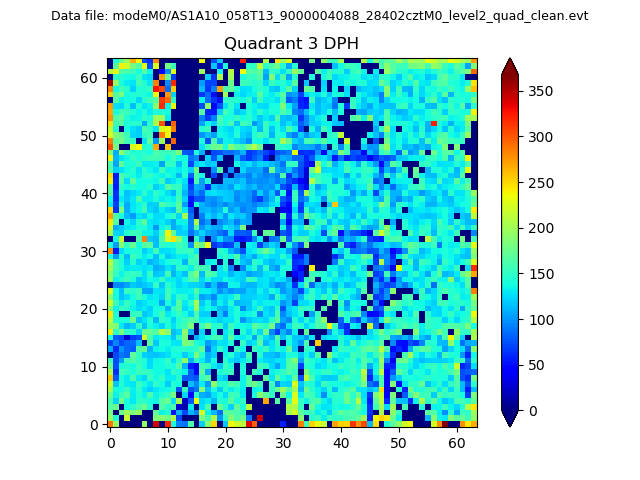 |
 |
Quadrant C |
| Plot type | Count rate plots | Images |
|---|---|---|
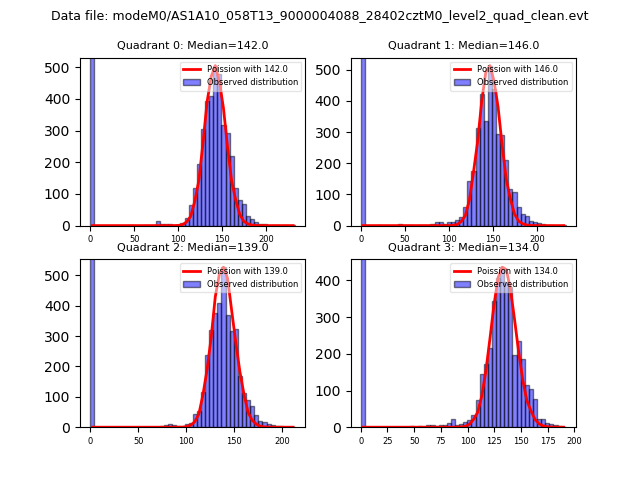
| Comparison with Poisson distribution Blue bars denote a histogram of data divided into 1 sec bins. Red curve is a Poisson curve with rate = median count rate of data. |
 |
 |
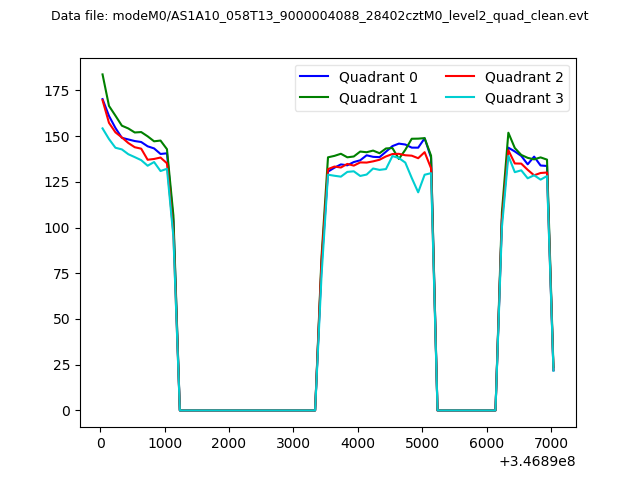
| Quadrant-wise count rates Data is divided into 100 sec bins |
 |
|
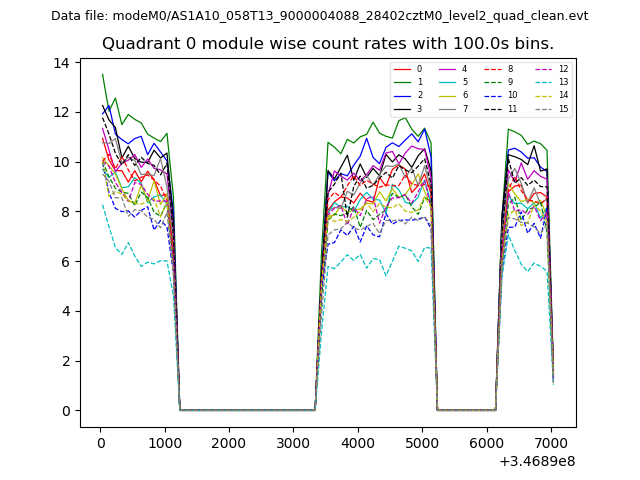
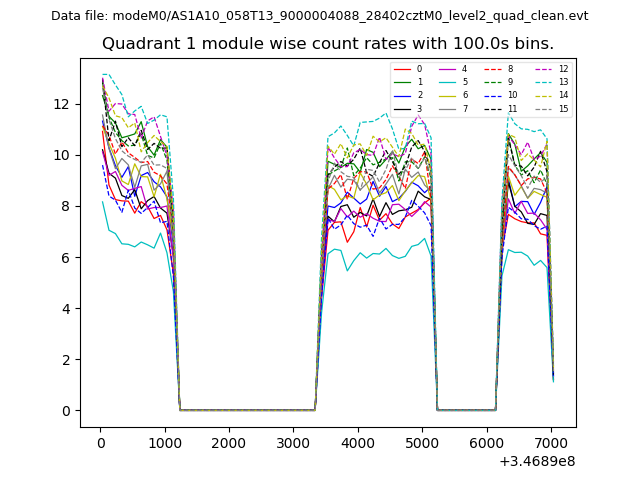
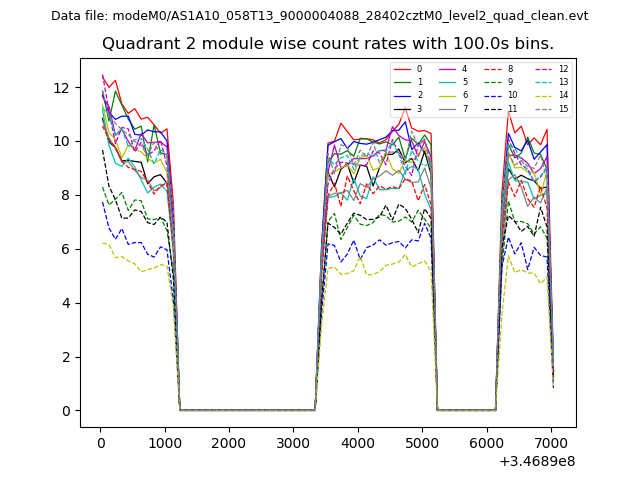
| Module-wise count rates for Quadrant A Data is divided into 100 sec bins |
 |
 |
| Module-wise count rates for Quadrant B Data is divided into 100 sec bins |
 |
 |
| Module-wise count rates for Quadrant C Data is divided into 100 sec bins |
 |
 |
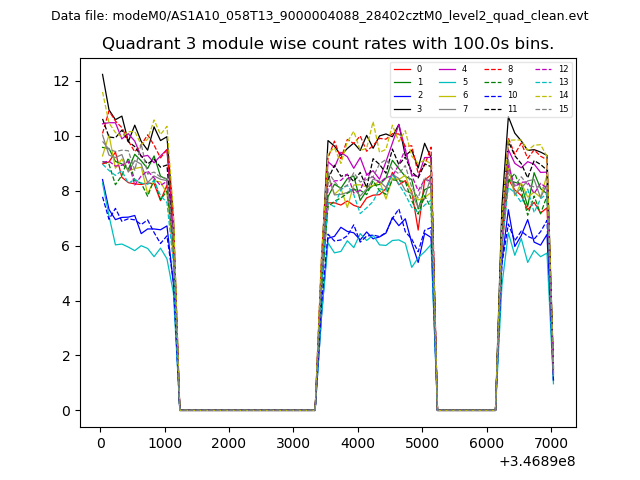
| Module-wise count rates for Quadrant D Data is divided into 100 sec bins |
 |
 |
| Parameter | Plot |
|---|---|
| CZT HV Monitor | 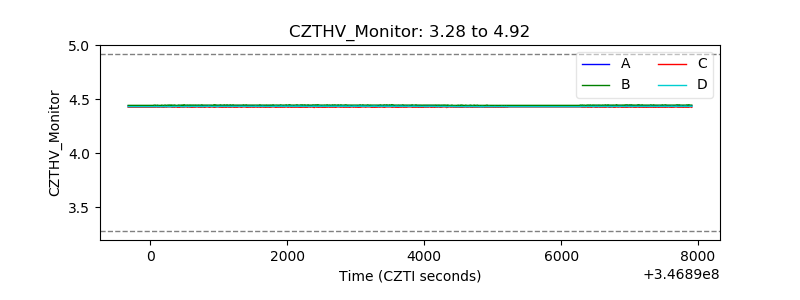 |
| D_VDD | 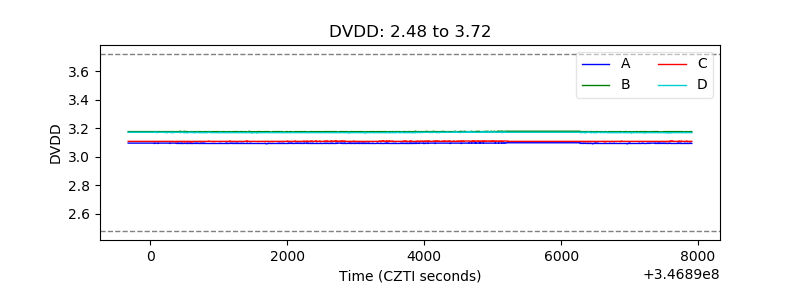 |
| Temperature 1 | 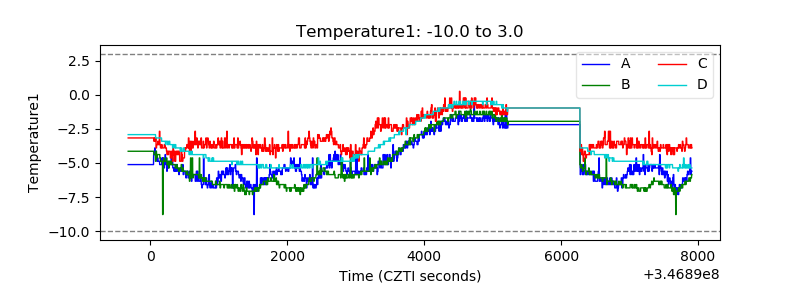 |
| Veto HV Monitor | 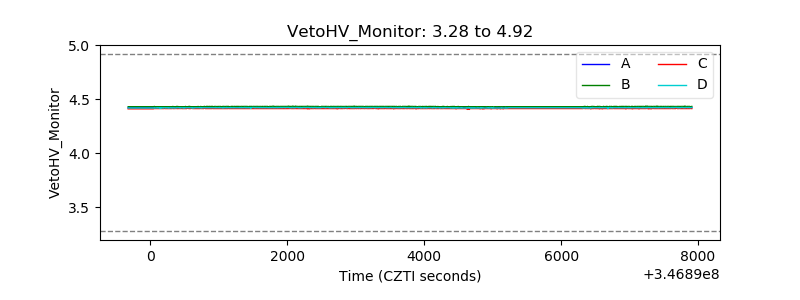 |
| Veto LLD | 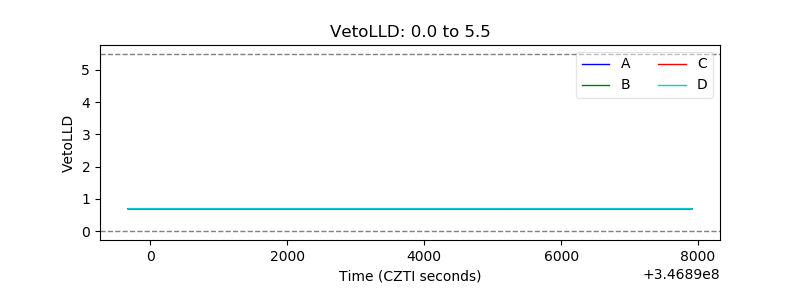 |
| Alpha Counter | 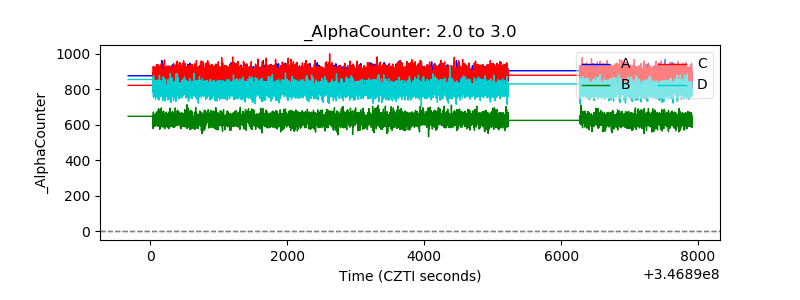 |
| _CPM_Rate |  |
| CZT Counter | 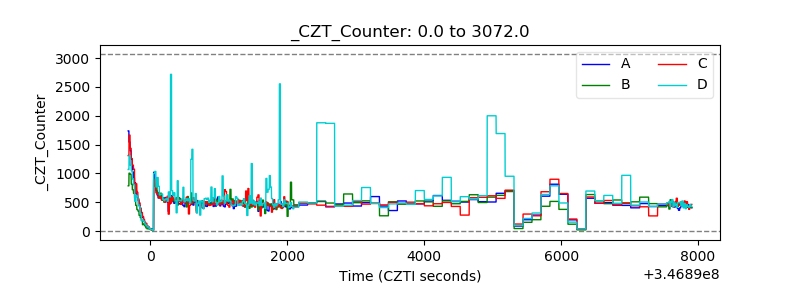 |
| +2.5 Volts monitor |  |
| +5 Volts monitor |  |
| _ROLL_ROT | 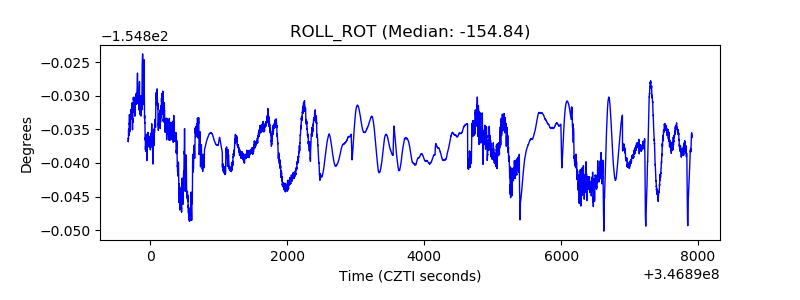 |
| _Roll_DEC | 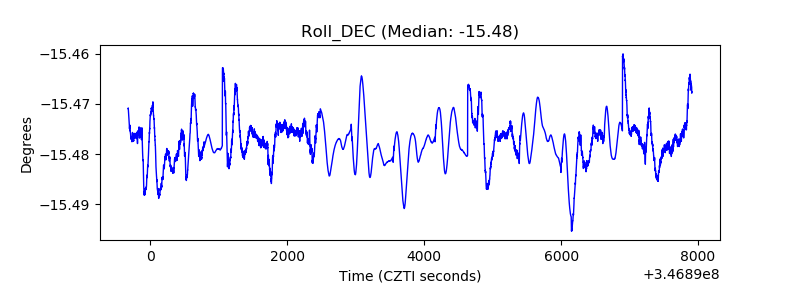 |
| _Roll_RA | 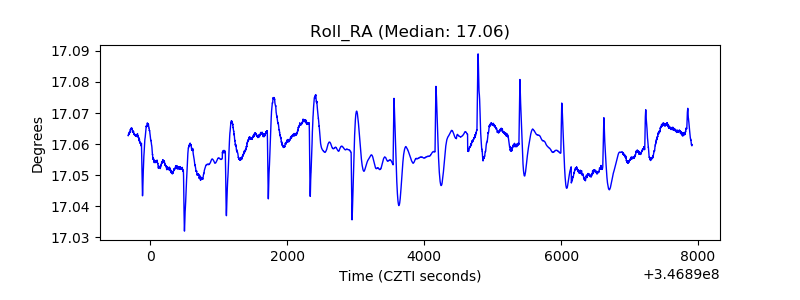 |
| Veto Counter | 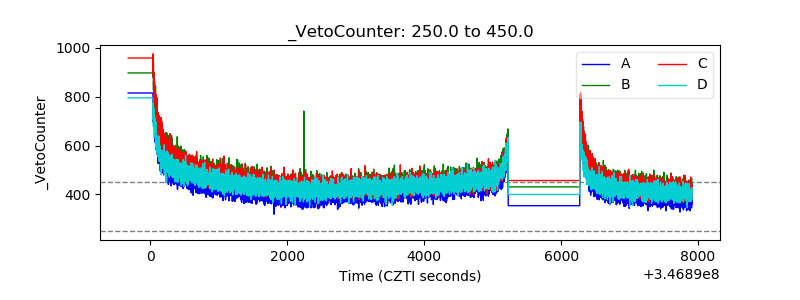 |