| Param | Original file | Final file |
|---|---|---|
| Filename | modeM0/AS1A10_058T13_9000004088_28403cztM0_level2.evt | modeM0/AS1A10_058T13_9000004088_28403cztM0_level2_quad_clean.evt |
| Size (bytes) | 551,188,800 | 88,390,080 |
| Size | 525.7 MB | 84.3 MB |
| Events in quadrant A | 3,615,446 | 550,549 |
| Events in quadrant B | 3,858,268 | 561,457 |
| Events in quadrant C | 3,692,226 | 534,815 |
| Events in quadrant D | 5,021,453 | 511,101 |
| Mode M0 | |||
|---|---|---|---|
| Quadrant | BADHDUFLAG | Total packets | Discarded packets |
| A | 0 | 15449 | 0 |
| B | 0 | 16020 | 0 |
| C | 0 | 15562 | 0 |
| D | 0 | 19693 | 0 |
| Mode M9 | |||
|---|---|---|---|
| Quadrant | BADHDUFLAG | Total packets | Discarded packets |
| A | 0 | 16 | 0 |
| B | 0 | 16 | 0 |
| C | 0 | 16 | 0 |
| D | 0 | 16 | 0 |
| Quadrant | Total seconds | Saturated seconds | Saturation percentage |
|---|---|---|---|
| A | 7448 | 46 | 0.617615% |
| B | 7449 | 99 | 1.329037% |
| C | 7449 | 114 | 1.530407% |
| D | 7449 | 235 | 3.154786% |
Noise dominated data is calculated using 1-second bins in cleaned event files. If a bin has >2000 counts, and if more than 50% of those come from <1% of pixels, then it is considered to be noise-dominated and hence unusable.
| Quadrant | # 1 sec bins | Bins with >0 counts | Bins with >2000 counts | High rate bins dominated by noise | Noise dominated (total time) | Noise dominated (detector-on time) | Marked lightcurve |
|---|---|---|---|---|---|---|---|
| A | 9098 | 7450 | 0 | 0 | 0.00% | 0.00% | 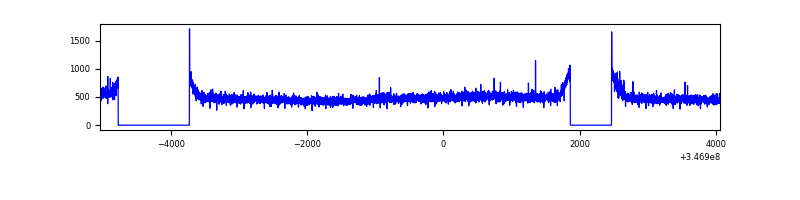 |
| B | 9099 | 7451 | 7 | 7 | 0.08% | 0.09% |  |
| C | 9099 | 7451 | 5 | 5 | 0.05% | 0.07% | 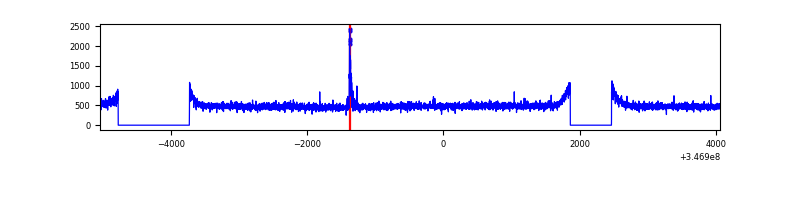 |
| D | 9099 | 7451 | 172 | 172 | 1.89% | 2.31% | 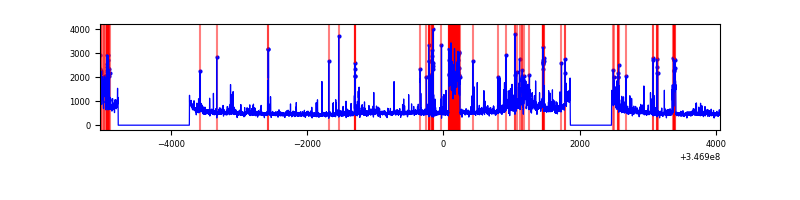 |
Top three noisy pixels from each quadrant. If the there are fewer than three noisy pixels in the level2.evt file, extra rows are filled as -1
| Pixel properties | Quadrant properties | ||||||
|---|---|---|---|---|---|---|---|
| Quadrant | DetID | PixID | Counts | Sigma | Mean | Median | Sigma |
| A | 6 | 16 | 12936 | 63.75 | 932 | 912 | 188.6 |
| A | 13 | 254 | 11458 | 55.92 | 932 | 912 | 188.6 |
| A | 3 | 137 | 9235 | 44.13 | 932 | 912 | 188.6 |
| B | 10 | 245 | 103015 | 560.15 | 935 | 913 | 182.3 |
| B | 10 | 246 | 37686 | 201.74 | 935 | 913 | 182.3 |
| B | 12 | 111 | 22706 | 119.56 | 935 | 913 | 182.3 |
| C | 14 | 238 | 142183 | 664.45 | 899 | 907 | 212.6 |
| C | 7 | 220 | 45670 | 210.53 | 899 | 907 | 212.6 |
| C | 13 | 61 | 6167 | 24.74 | 899 | 907 | 212.6 |
| D | 8 | 195 | 647140 | 2991.44 | 896 | 871 | 216.0 |
| D | 2 | 250 | 429389 | 1983.52 | 896 | 871 | 216.0 |
| D | 1 | 52 | 420449 | 1942.14 | 896 | 871 | 216.0 |
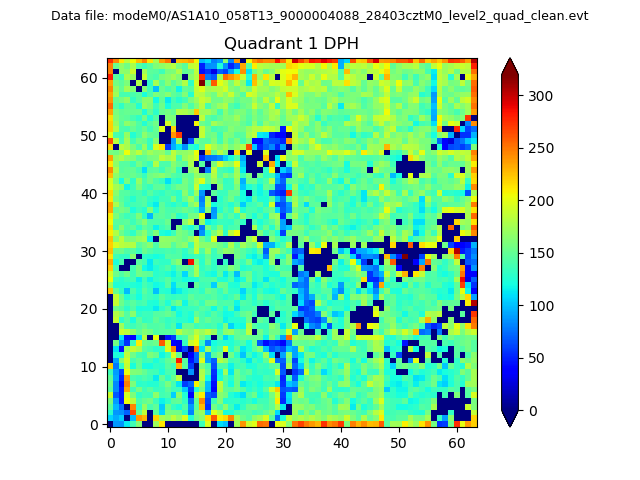
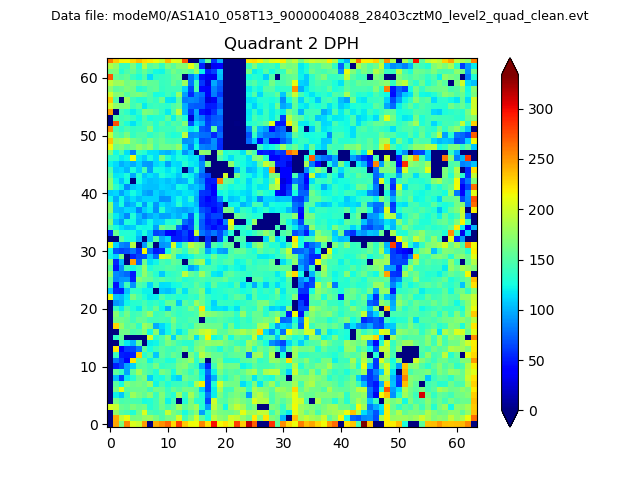
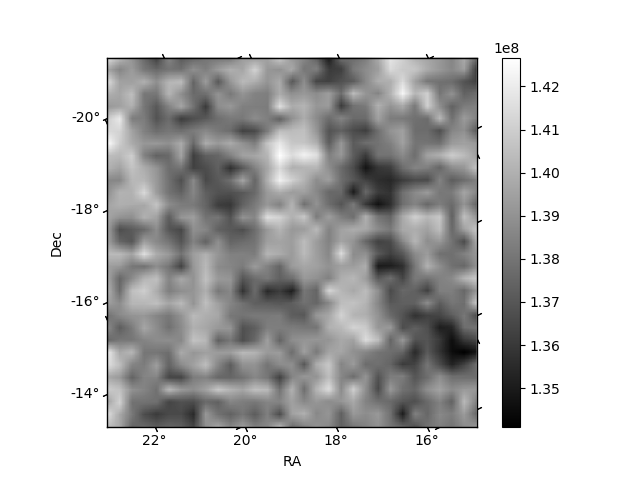
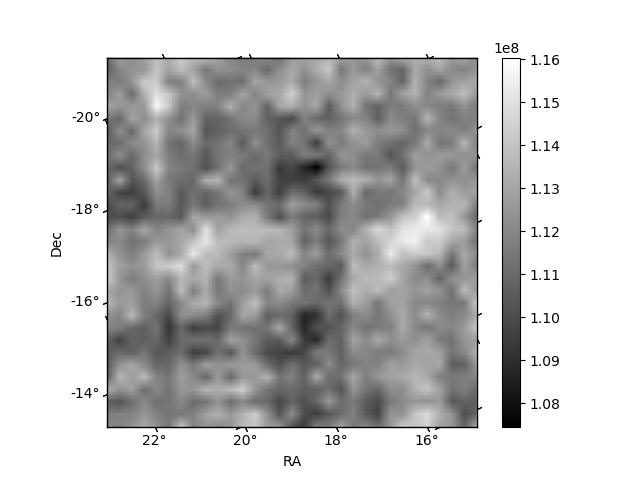
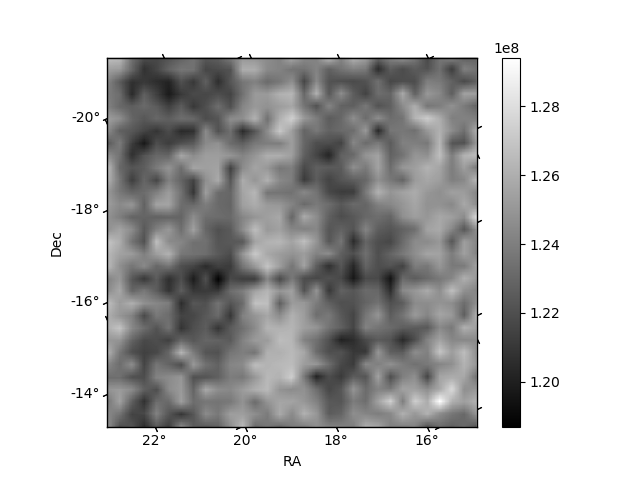
Histogram calculated using DETX and DETY for each event in the final _common_clean file
| Quadrant A |  |
 |
Quadrant B |
|---|---|---|---|
| Quadrant D | 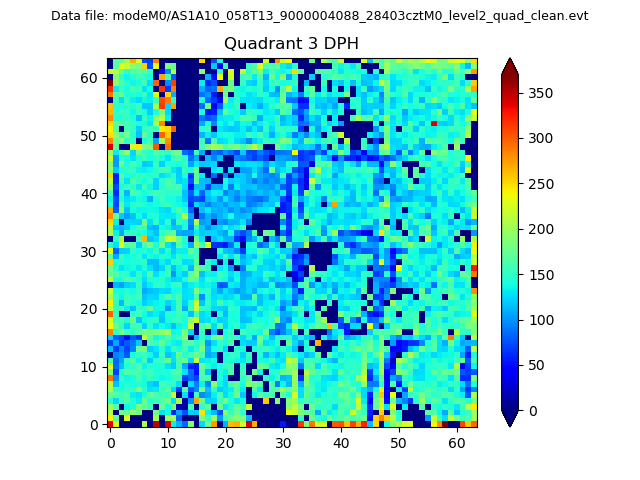 |
 |
Quadrant C |
| Plot type | Count rate plots | Images |
|---|---|---|
| Comparison with Poisson distribution Blue bars denote a histogram of data divided into 1 sec bins. Red curve is a Poisson curve with rate = median count rate of data. |
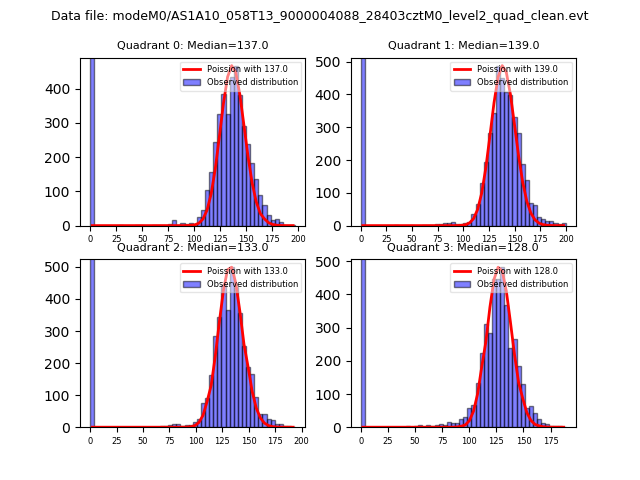 |
 |
| Quadrant-wise count rates Data is divided into 100 sec bins |
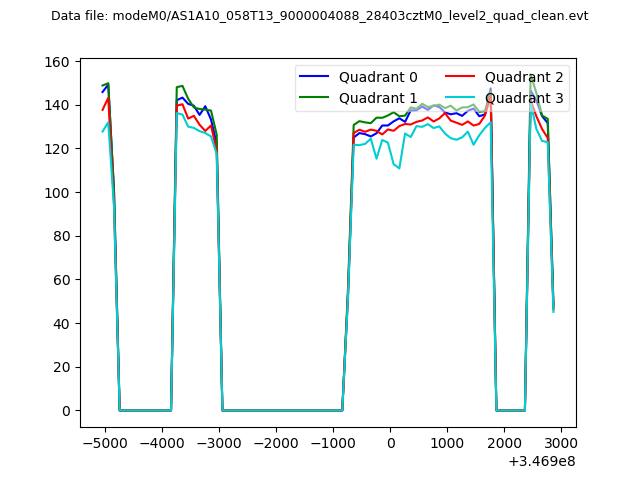 |
|
| Module-wise count rates for Quadrant A Data is divided into 100 sec bins |
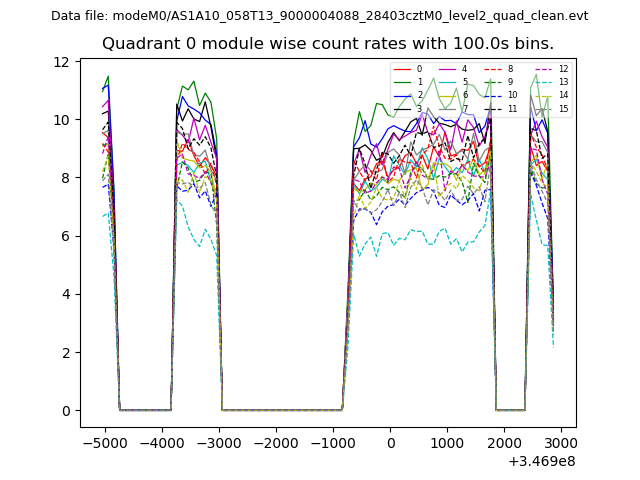 |
 |
| Module-wise count rates for Quadrant B Data is divided into 100 sec bins |
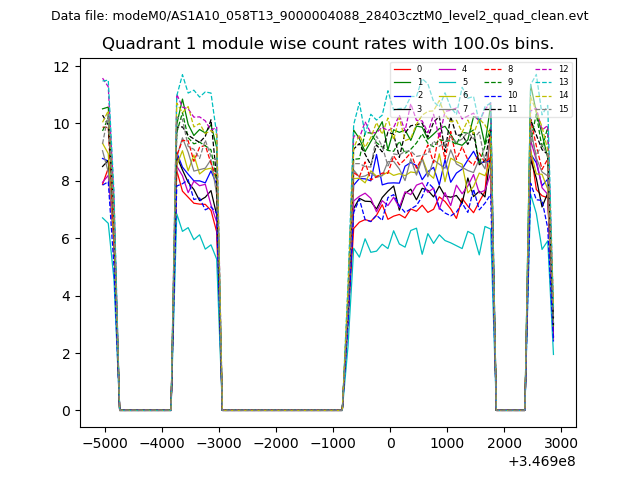 |
 |
| Module-wise count rates for Quadrant C Data is divided into 100 sec bins |
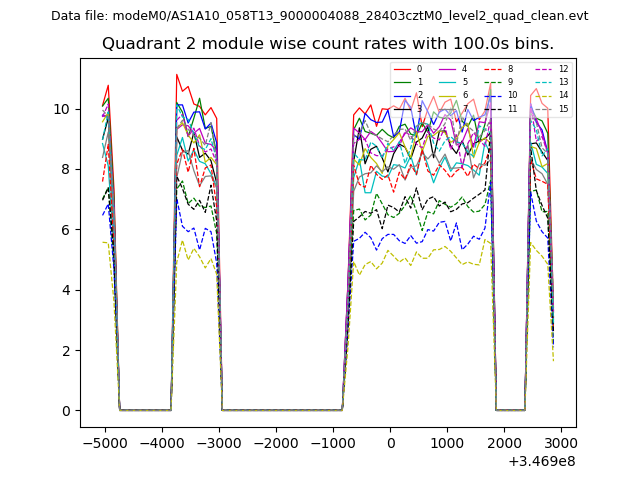 |
 |
| Module-wise count rates for Quadrant D Data is divided into 100 sec bins |
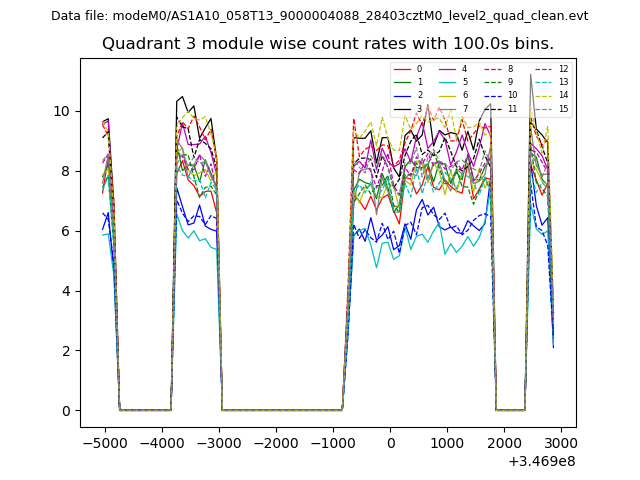 |
 |
| Parameter | Plot |
|---|---|
| CZT HV Monitor | 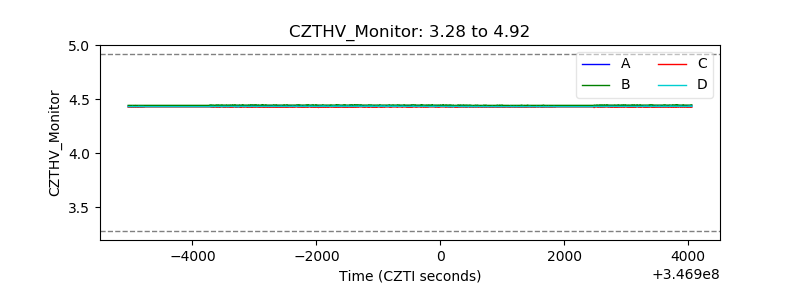 |
| D_VDD | 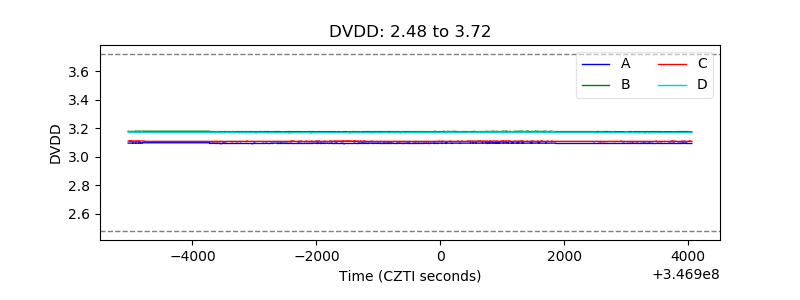 |
| Temperature 1 | 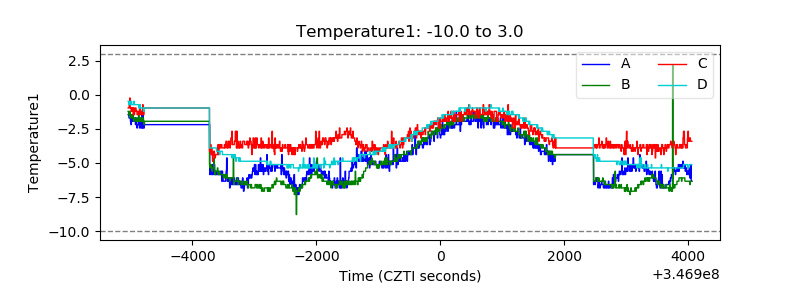 |
| Veto HV Monitor | 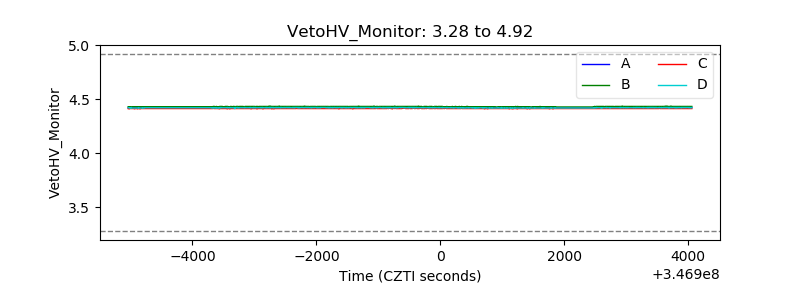 |
| Veto LLD | 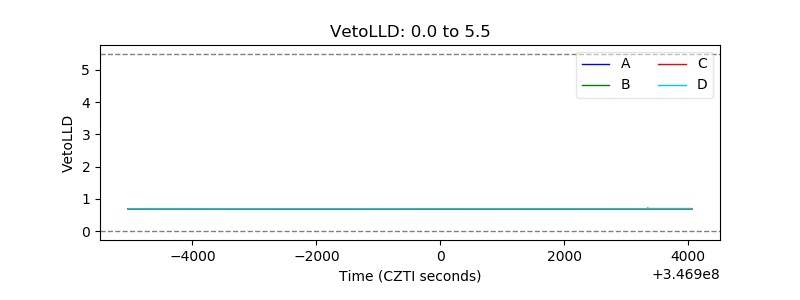 |
| Alpha Counter | 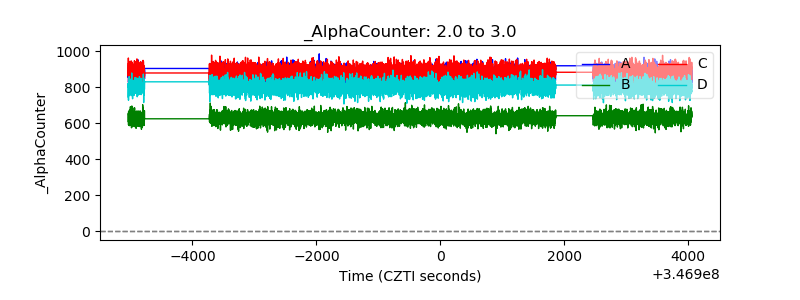 |
| _CPM_Rate | 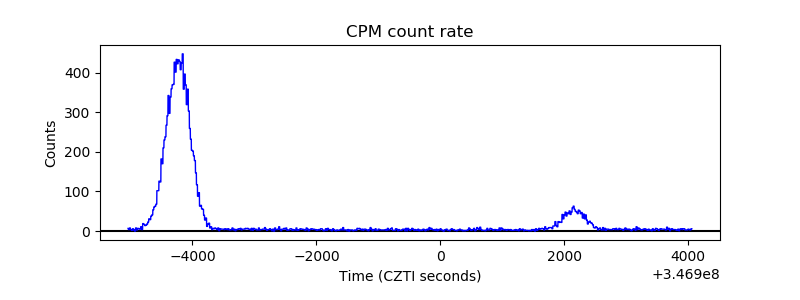 |
| CZT Counter | 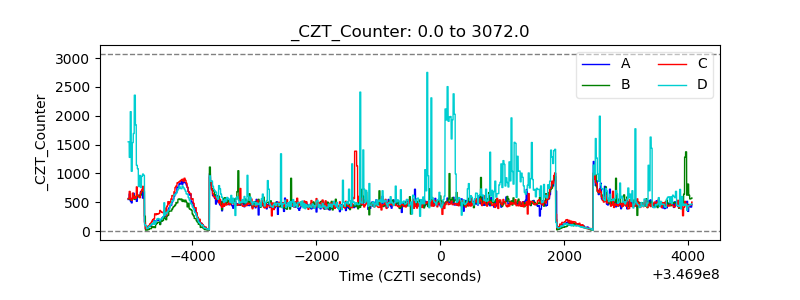 |
| +2.5 Volts monitor | 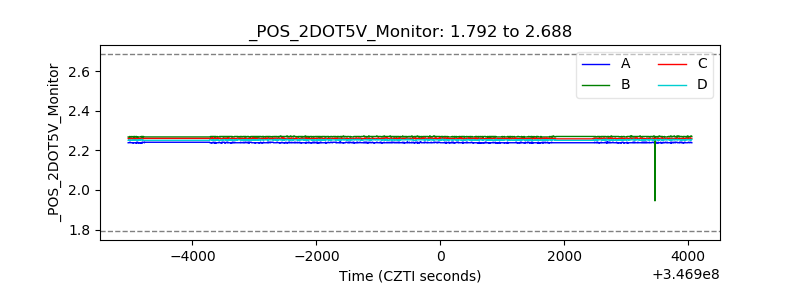 |
| +5 Volts monitor | 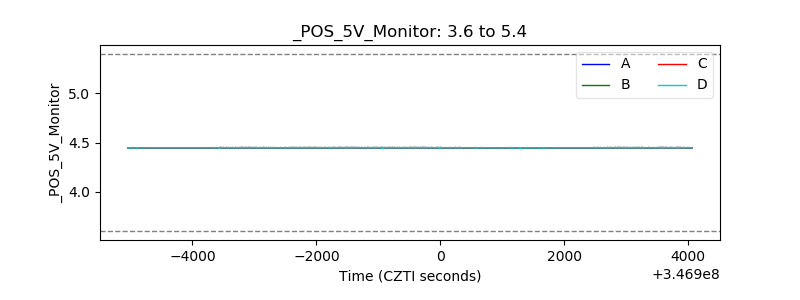 |
| _ROLL_ROT | 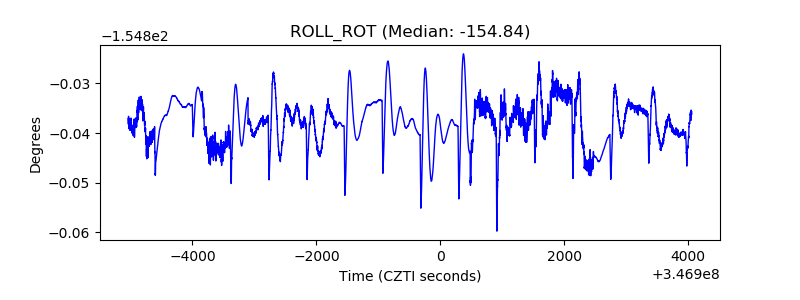 |
| _Roll_DEC | 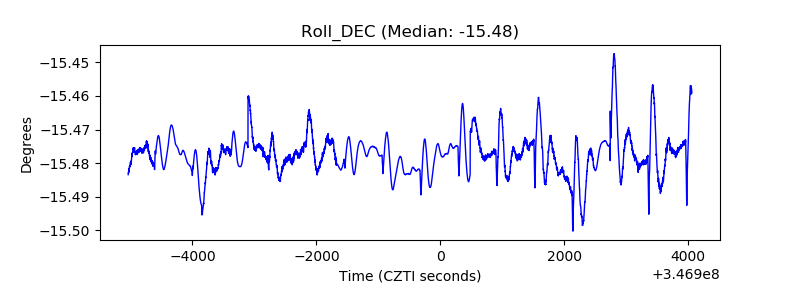 |
| _Roll_RA | 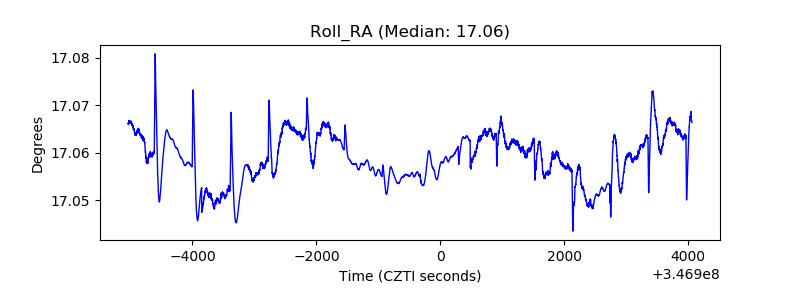 |
| Veto Counter | 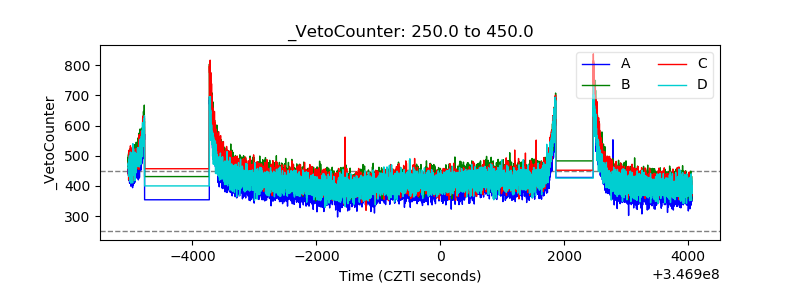 |