| Param | Original file | Final file |
|---|---|---|
| Filename | modeM0/AS1A10_058T13_9000004088_28404cztM0_level2.evt | modeM0/AS1A10_058T13_9000004088_28404cztM0_level2_quad_clean.evt |
| Size (bytes) | 618,552,000 | 86,189,760 |
| Size | 589.9 MB | 82.2 MB |
| Events in quadrant A | 3,885,917 | 528,314 |
| Events in quadrant B | 4,151,457 | 537,989 |
| Events in quadrant C | 3,909,563 | 514,821 |
| Events in quadrant D | 6,258,266 | 487,261 |
| Mode M0 | |||
|---|---|---|---|
| Quadrant | BADHDUFLAG | Total packets | Discarded packets |
| A | 0 | 16607 | 0 |
| B | 0 | 17136 | 0 |
| C | 0 | 16556 | 0 |
| D | 0 | 23719 | 0 |
| Mode M9 | |||
|---|---|---|---|
| Quadrant | BADHDUFLAG | Total packets | Discarded packets |
| A | 1 | 140680765356840 | 46 |
| B | 1 | -1 | -1 |
| C | 1 | -1 | -1 |
| D | 1 | -1 | -1 |
| Quadrant | Total seconds | Saturated seconds | Saturation percentage |
|---|---|---|---|
| A | 7778 | 296 | 3.805606% |
| B | 7778 | 376 | 4.834148% |
| C | 7777 | 365 | 4.693326% |
| D | 7777 | 713 | 9.168060% |
Noise dominated data is calculated using 1-second bins in cleaned event files. If a bin has >2000 counts, and if more than 50% of those come from <1% of pixels, then it is considered to be noise-dominated and hence unusable.
| Quadrant | # 1 sec bins | Bins with >0 counts | Bins with >2000 counts | High rate bins dominated by noise | Noise dominated (total time) | Noise dominated (detector-on time) | Marked lightcurve |
|---|---|---|---|---|---|---|---|
| A | 7778 | 7778 | 1 | 1 | 0.01% | 0.01% | 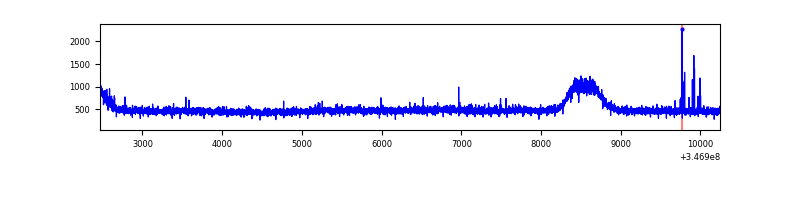 |
| B | 7778 | 7778 | 11 | 11 | 0.14% | 0.14% | 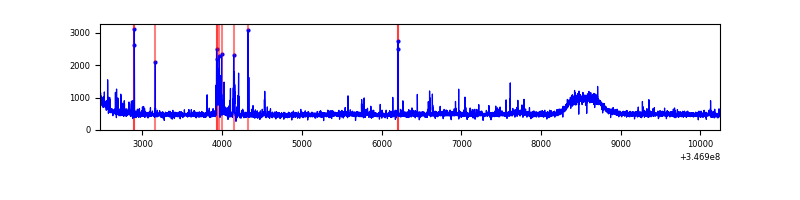 |
| C | 7777 | 7777 | 0 | 0 | 0.00% | 0.00% | 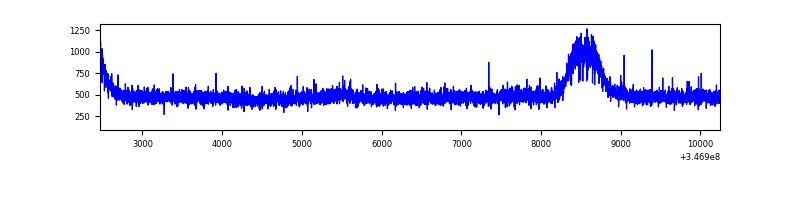 |
| D | 7777 | 7777 | 397 | 397 | 5.10% | 5.10% | 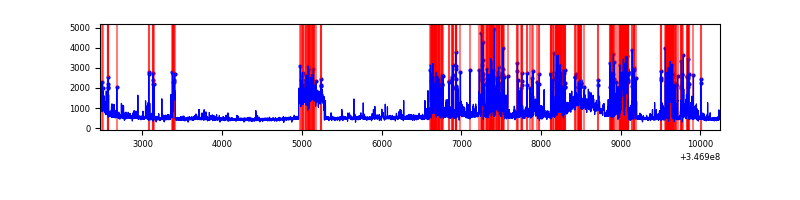 |
Top three noisy pixels from each quadrant. If the there are fewer than three noisy pixels in the level2.evt file, extra rows are filled as -1
| Pixel properties | Quadrant properties | ||||||
|---|---|---|---|---|---|---|---|
| Quadrant | DetID | PixID | Counts | Sigma | Mean | Median | Sigma |
| A | 6 | 16 | 17886 | 83.09 | 999 | 976 | 203.5 |
| A | 15 | 47 | 12878 | 58.48 | 999 | 976 | 203.5 |
| A | 13 | 254 | 12052 | 54.42 | 999 | 976 | 203.5 |
| B | 10 | 245 | 181082 | 919.47 | 992 | 965 | 195.9 |
| B | 10 | 246 | 43313 | 216.18 | 992 | 965 | 195.9 |
| B | 12 | 111 | 25143 | 123.43 | 992 | 965 | 195.9 |
| C | 14 | 238 | 150990 | 652.08 | 961 | 969 | 230.1 |
| C | 7 | 220 | 10768 | 42.59 | 961 | 969 | 230.1 |
| C | 13 | 61 | 6466 | 23.89 | 961 | 969 | 230.1 |
| D | 1 | 52 | 1638298 | 7155.42 | 943 | 917 | 228.8 |
| D | 8 | 195 | 737736 | 3219.93 | 943 | 917 | 228.8 |
| D | 7 | 80 | 143616 | 623.6 | 943 | 917 | 228.8 |
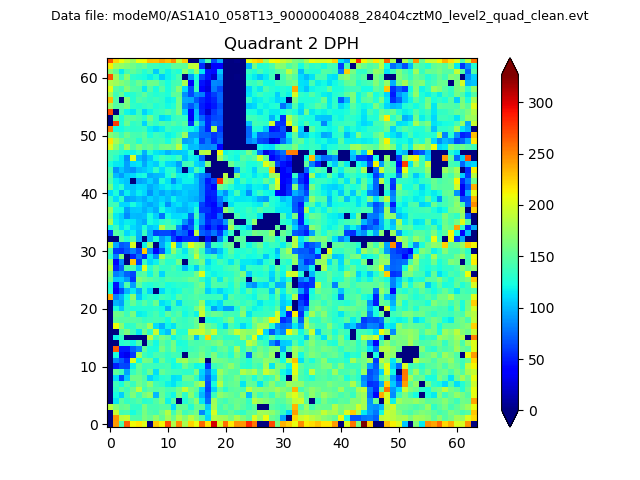
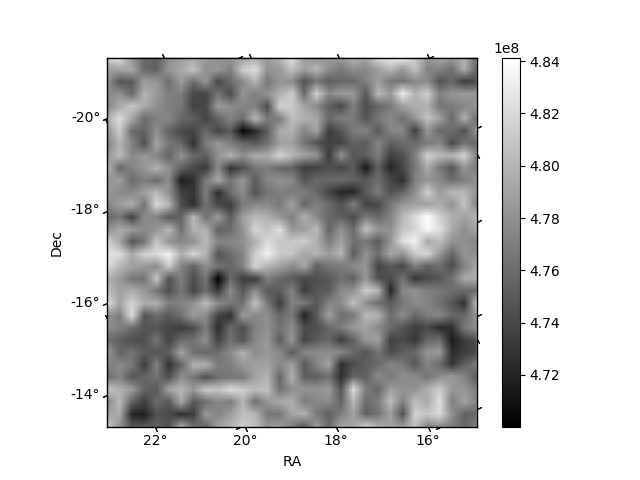
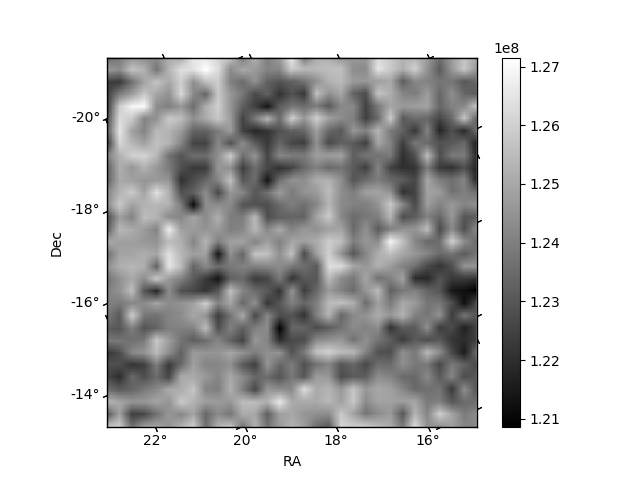
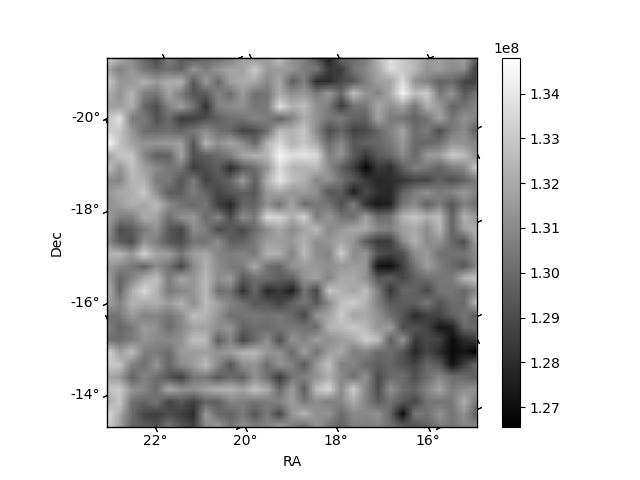
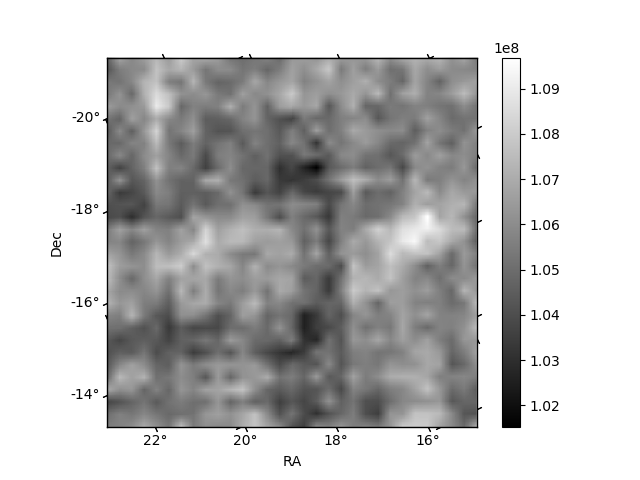
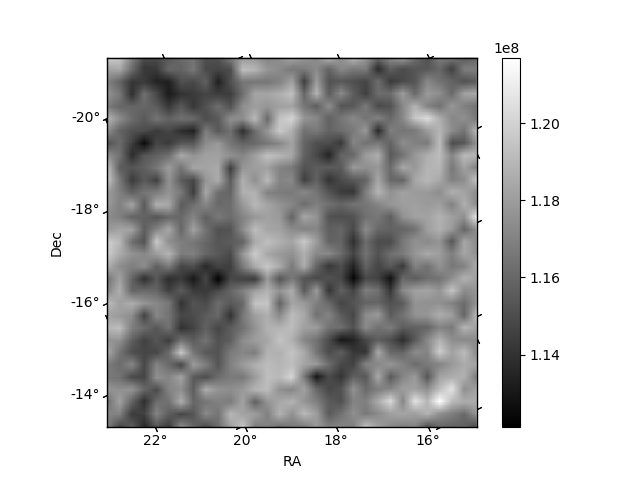
Histogram calculated using DETX and DETY for each event in the final _common_clean file
| Quadrant A | 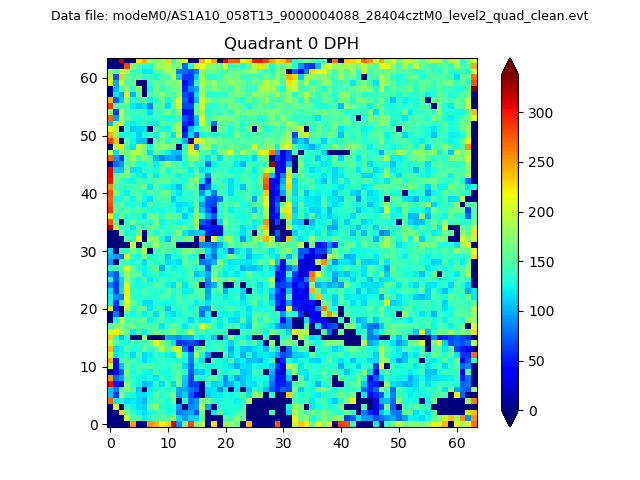 |
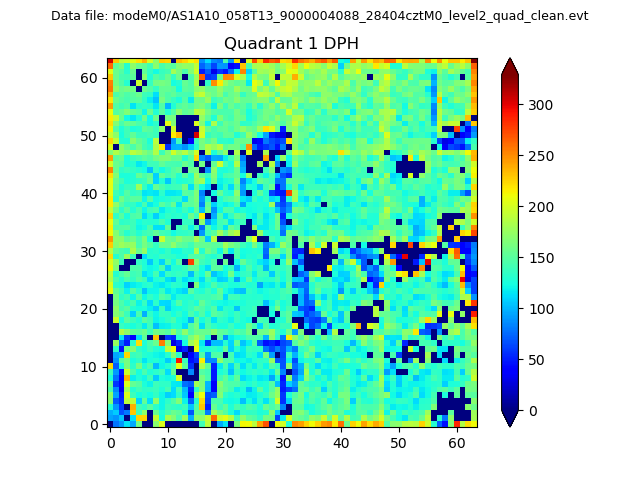 |
Quadrant B |
|---|---|---|---|
| Quadrant D | 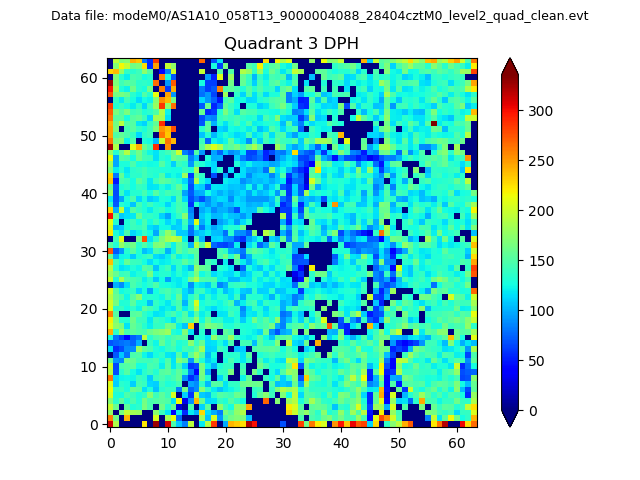 |
 |
Quadrant C |
| Plot type | Count rate plots | Images |
|---|---|---|
| Comparison with Poisson distribution Blue bars denote a histogram of data divided into 1 sec bins. Red curve is a Poisson curve with rate = median count rate of data. |
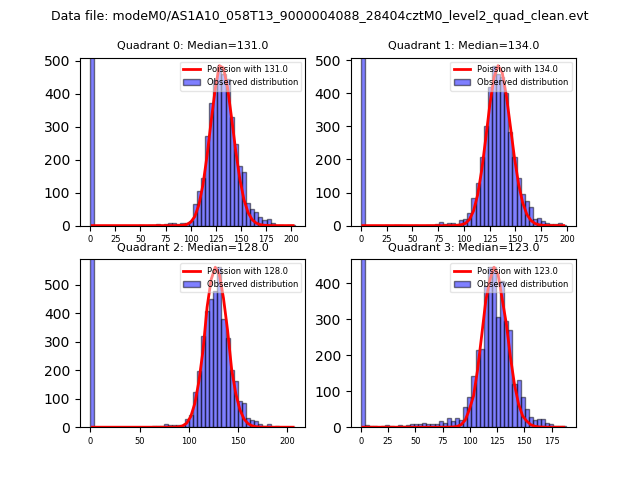 |
 |
| Quadrant-wise count rates Data is divided into 100 sec bins |
 |
|
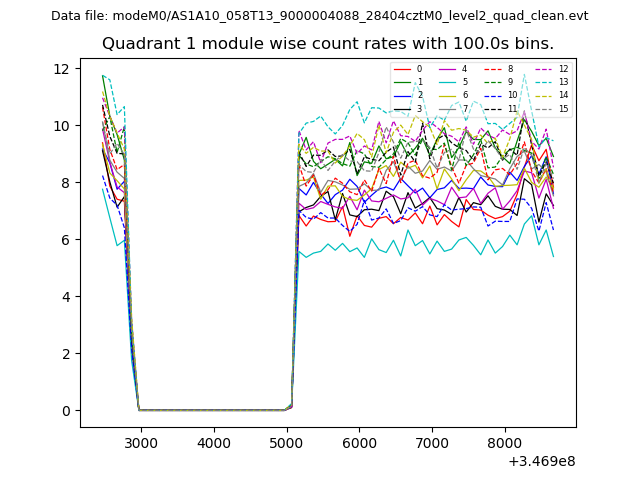
| Module-wise count rates for Quadrant A Data is divided into 100 sec bins |
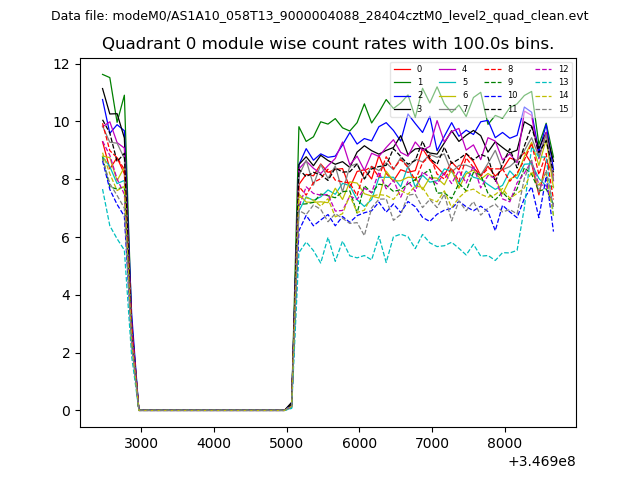 |
 |
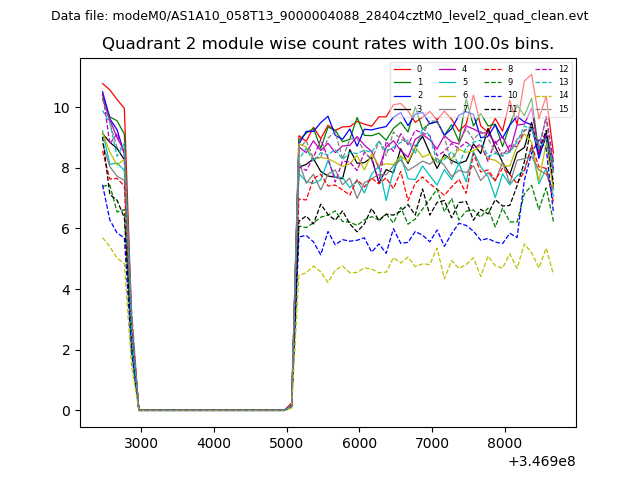
| Module-wise count rates for Quadrant B Data is divided into 100 sec bins |
 |
 |
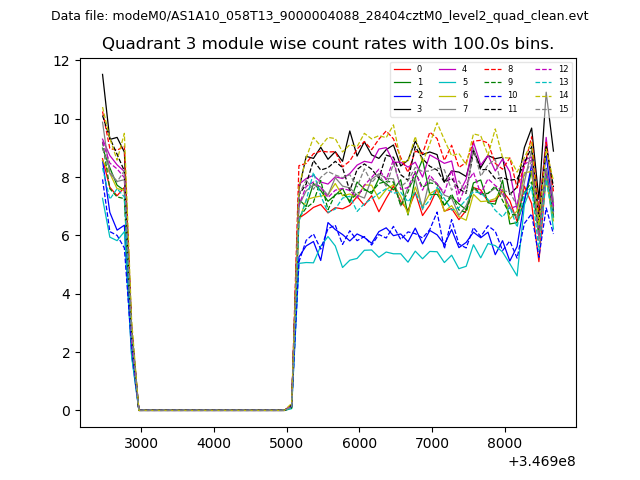
| Module-wise count rates for Quadrant C Data is divided into 100 sec bins |
 |
 |
| Module-wise count rates for Quadrant D Data is divided into 100 sec bins |
 |
 |
| Parameter | Plot |
|---|---|
| CZT HV Monitor | 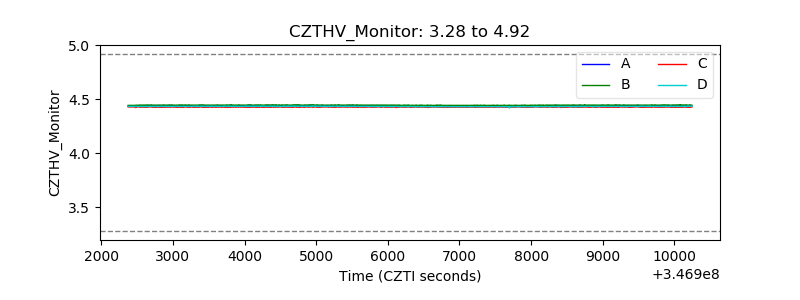 |
| D_VDD | 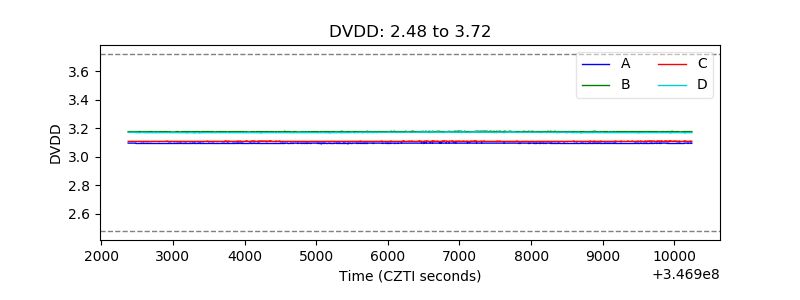 |
| Temperature 1 | 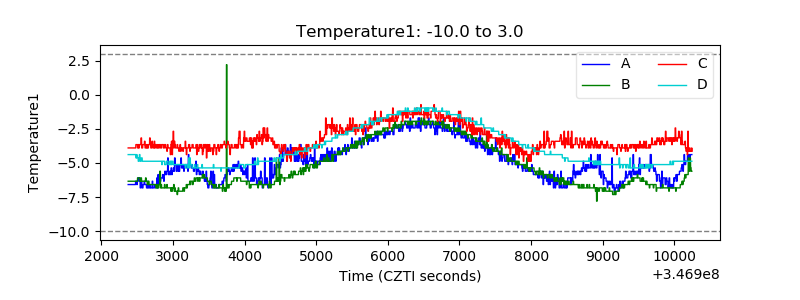 |
| Veto HV Monitor | 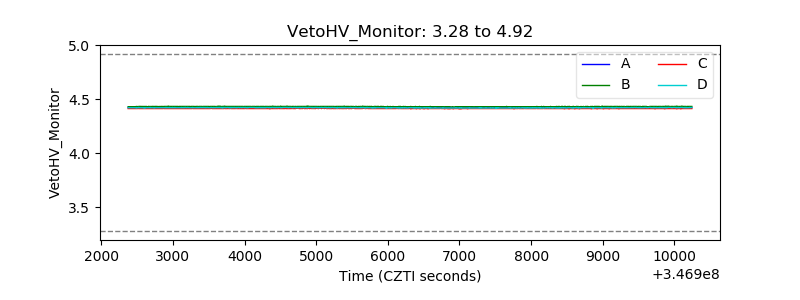 |
| Veto LLD | 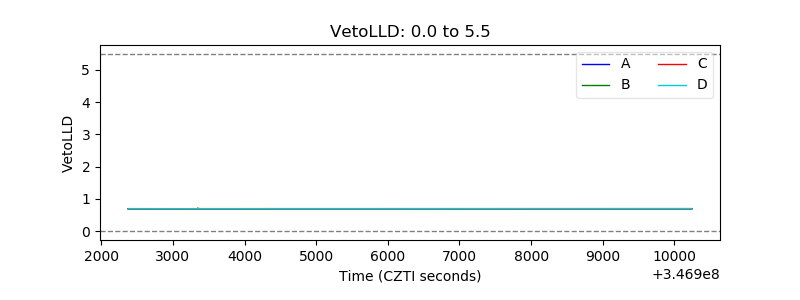 |
| Alpha Counter | 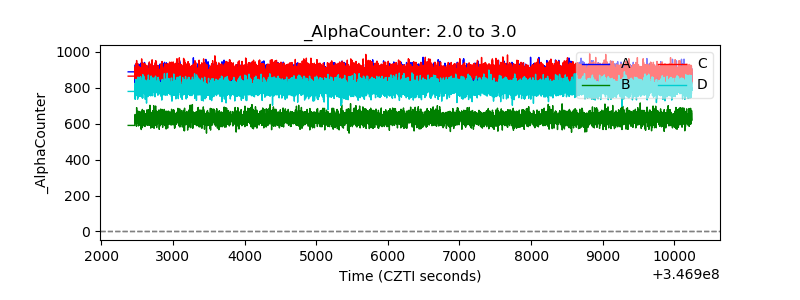 |
| _CPM_Rate | 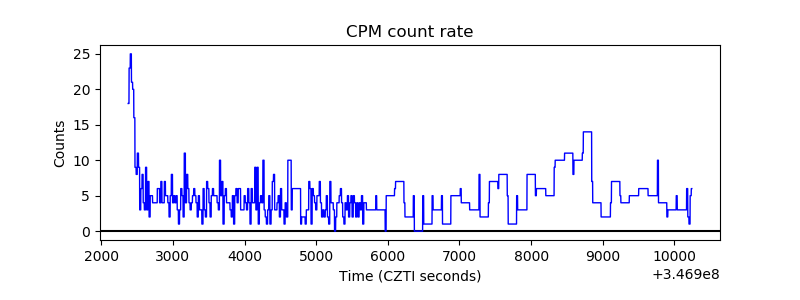 |
| CZT Counter | 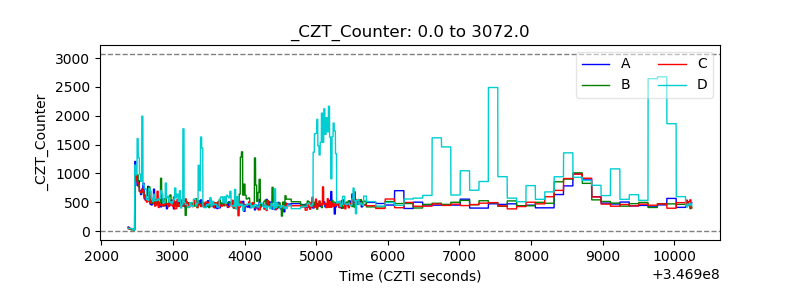 |
| +2.5 Volts monitor | 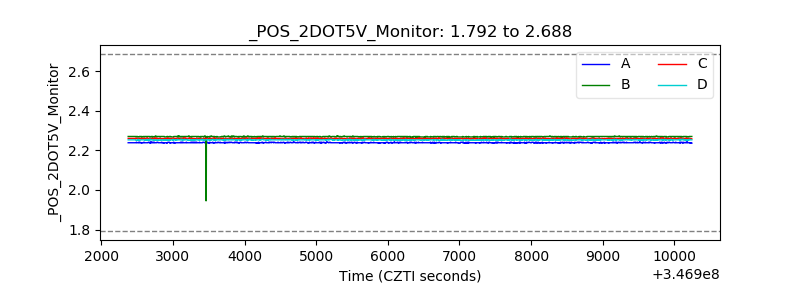 |
| +5 Volts monitor |  |
| _ROLL_ROT | 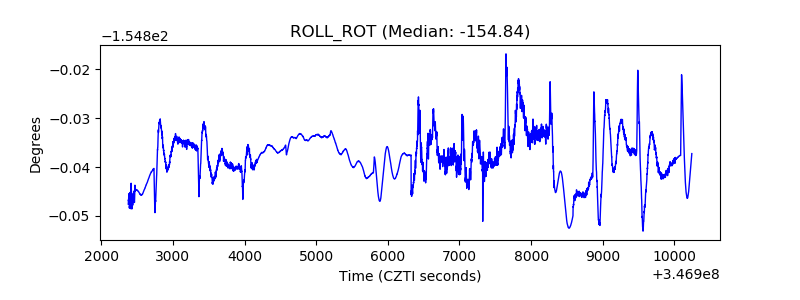 |
| _Roll_DEC | 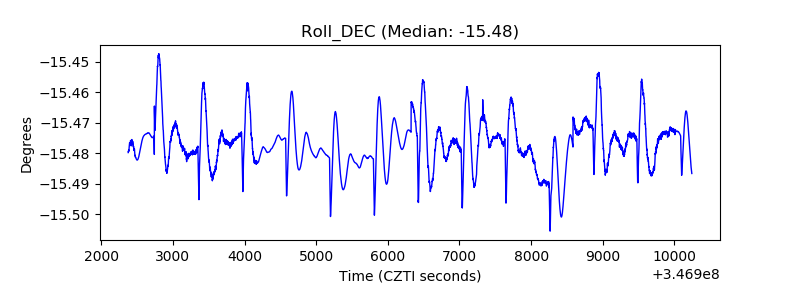 |
| _Roll_RA | 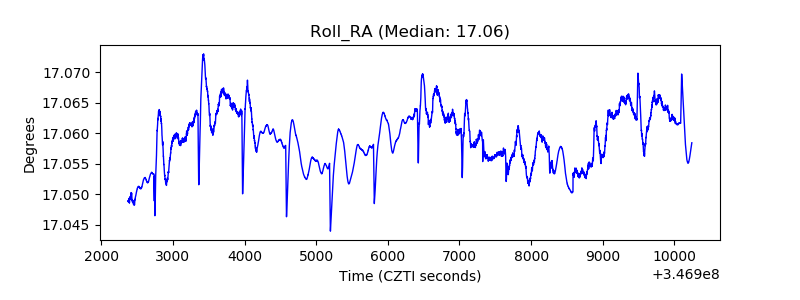 |
| Veto Counter | 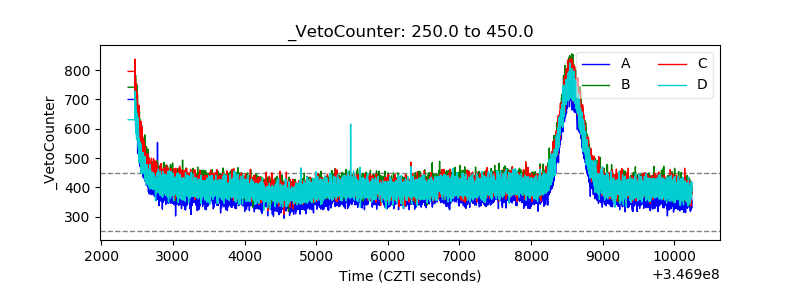 |