| Param | Original file | Final file |
|---|---|---|
| Filename | modeM0/AS1A10_058T13_9000004088_28405cztM0_level2.evt | modeM0/AS1A10_058T13_9000004088_28405cztM0_level2_quad_clean.evt |
| Size (bytes) | 155,782,080 | 26,078,400 |
| Size | 148.6 MB | 24.9 MB |
| Events in quadrant A | 928,232 | 162,711 |
| Events in quadrant B | 1,033,840 | 166,021 |
| Events in quadrant C | 935,600 | 161,044 |
| Events in quadrant D | 1,679,258 | 151,244 |
| Mode M0 | |||
|---|---|---|---|
| Quadrant | BADHDUFLAG | Total packets | Discarded packets |
| A | 0 | 4083 | 0 |
| B | 0 | 4331 | 0 |
| C | 0 | 4090 | 0 |
| D | 0 | 6288 | 0 |
| Mode M9 | |||
|---|---|---|---|
| Quadrant | BADHDUFLAG | Total packets | Discarded packets |
| A | 0 | 1 | 1 |
| B | 1 | 1 | 1 |
| C | 1 | -1 | -1 |
| D | 1 | -1 | -1 |
| Quadrant | Total seconds | Saturated seconds | Saturation percentage |
|---|---|---|---|
| A | 2023 | 5 | 0.247158% |
| B | 2029 | 6 | 0.295712% |
| C | 2034 | 8 | 0.393314% |
| D | 2013 | 109 | 5.414804% |
Noise dominated data is calculated using 1-second bins in cleaned event files. If a bin has >2000 counts, and if more than 50% of those come from <1% of pixels, then it is considered to be noise-dominated and hence unusable.
| Quadrant | # 1 sec bins | Bins with >0 counts | Bins with >2000 counts | High rate bins dominated by noise | Noise dominated (total time) | Noise dominated (detector-on time) | Marked lightcurve |
|---|---|---|---|---|---|---|---|
| A | 2885 | 2036 | 1 | 1 | 0.03% | 0.05% | 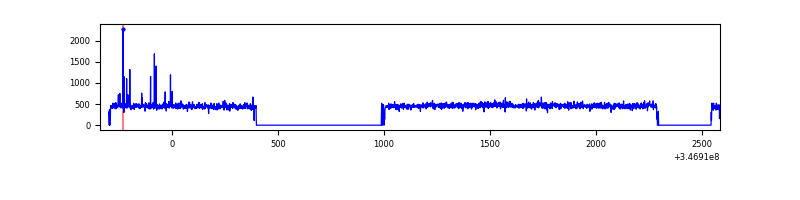 |
| B | 2925 | 2052 | 4 | 4 | 0.14% | 0.19% | 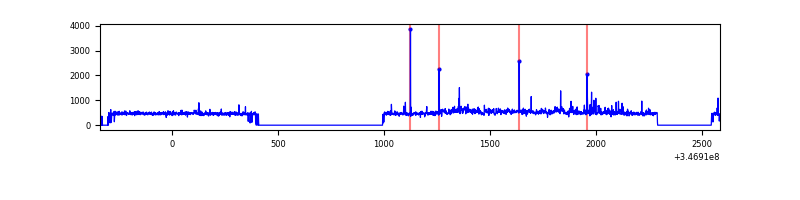 |
| C | 2927 | 2055 | 0 | 0 | 0.00% | 0.00% | 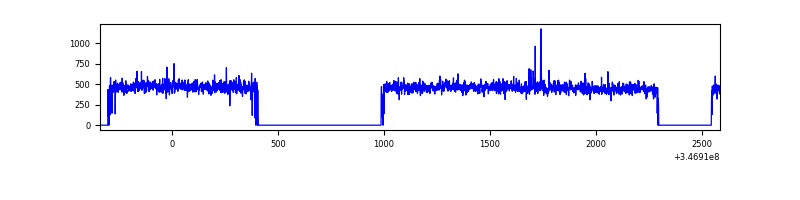 |
| D | 2885 | 2029 | 91 | 91 | 3.15% | 4.48% | 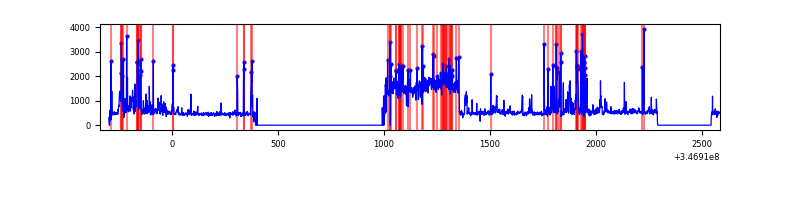 |
Top three noisy pixels from each quadrant. If the there are fewer than three noisy pixels in the level2.evt file, extra rows are filled as -1
| Pixel properties | Quadrant properties | ||||||
|---|---|---|---|---|---|---|---|
| Quadrant | DetID | PixID | Counts | Sigma | Mean | Median | Sigma |
| A | 15 | 47 | 11160 | 221.59 | 237 | 232 | 49.3 |
| A | 13 | 254 | 3170 | 59.57 | 237 | 232 | 49.3 |
| A | 3 | 137 | 2401 | 43.98 | 237 | 232 | 49.3 |
| B | 0 | 230 | 53223 | 1110.19 | 235 | 229 | 47.7 |
| B | 10 | 245 | 45019 | 938.32 | 235 | 229 | 47.7 |
| B | 12 | 111 | 5819 | 117.11 | 235 | 229 | 47.7 |
| C | 14 | 238 | 37825 | 672.17 | 229 | 230 | 55.9 |
| C | 7 | 220 | 3637 | 60.91 | 229 | 230 | 55.9 |
| C | 13 | 61 | 1617 | 24.8 | 229 | 230 | 55.9 |
| D | 8 | 195 | 476228 | 8562.48 | 224 | 217 | 55.6 |
| D | 1 | 52 | 316709 | 5693.06 | 224 | 217 | 55.6 |
| D | 2 | 250 | 20759 | 369.51 | 224 | 217 | 55.6 |
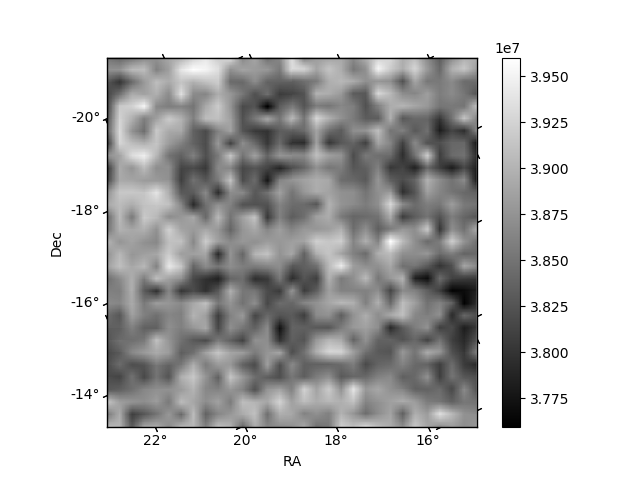
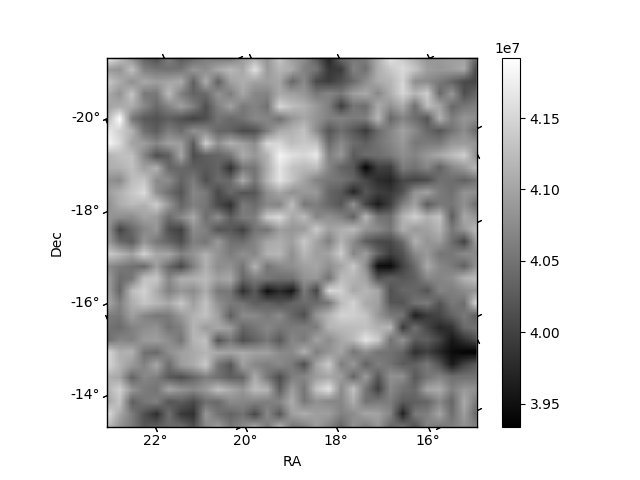
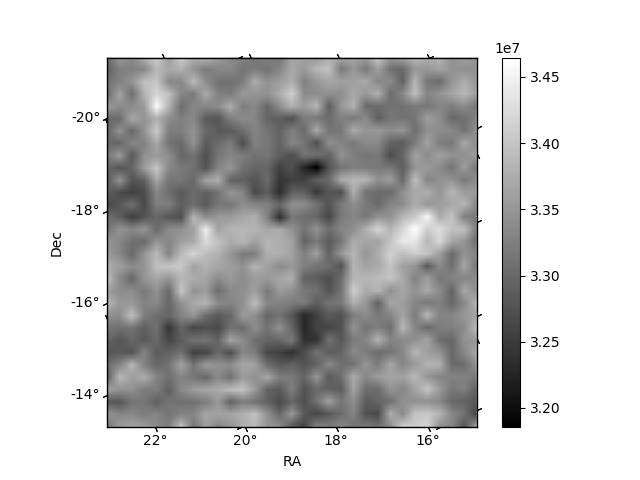
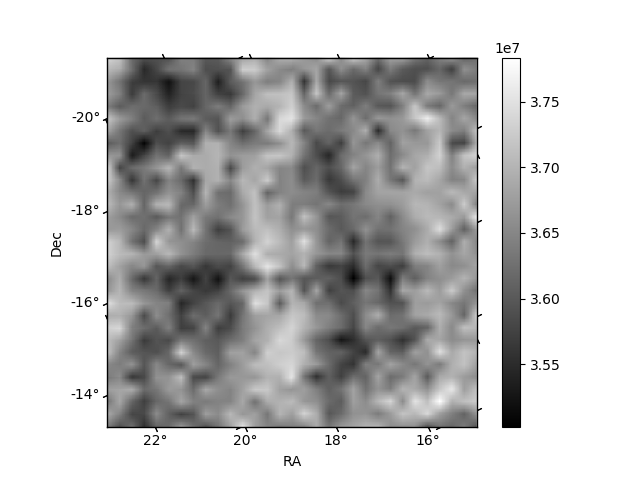
Histogram calculated using DETX and DETY for each event in the final _common_clean file
| Quadrant A | 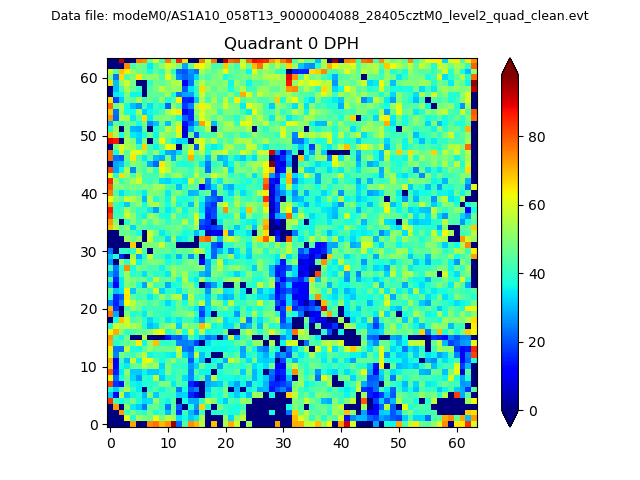 |
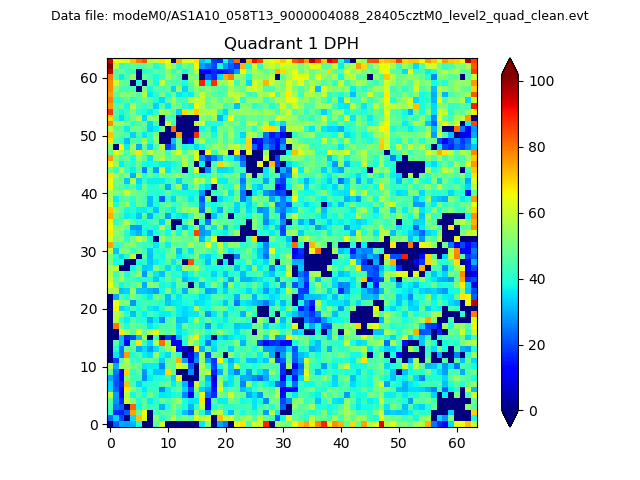 |
Quadrant B |
|---|---|---|---|
| Quadrant D | 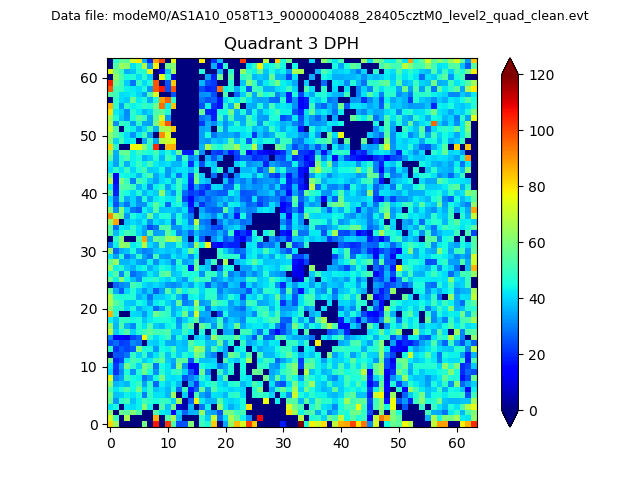 |
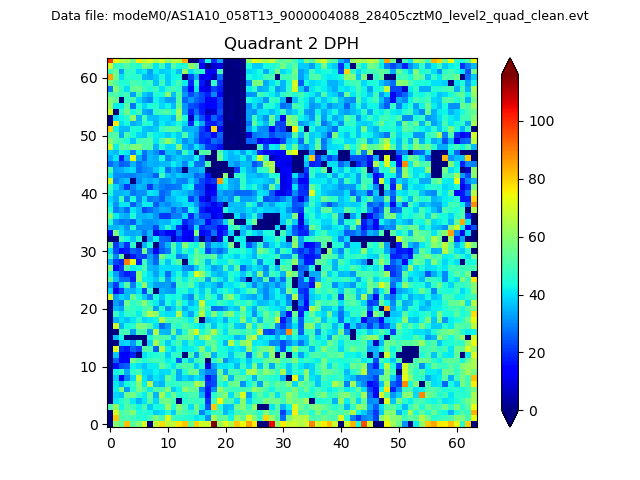 |
Quadrant C |
| Plot type | Count rate plots | Images |
|---|---|---|
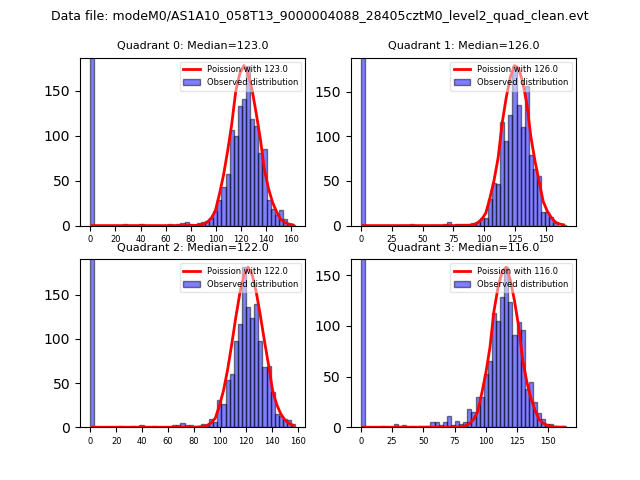
| Comparison with Poisson distribution Blue bars denote a histogram of data divided into 1 sec bins. Red curve is a Poisson curve with rate = median count rate of data. |
 |
 |
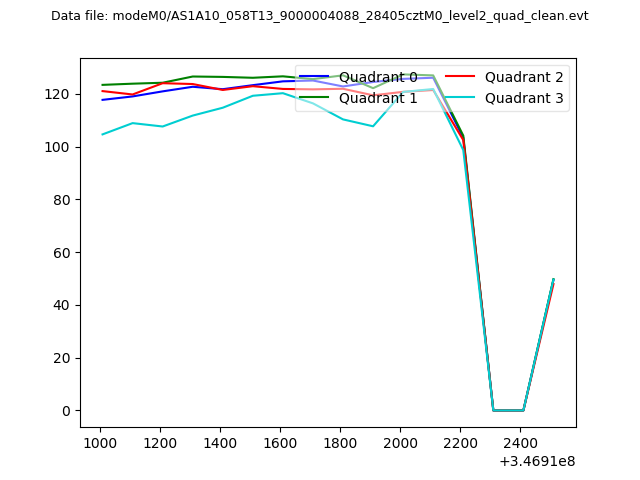
| Quadrant-wise count rates Data is divided into 100 sec bins |
 |
|
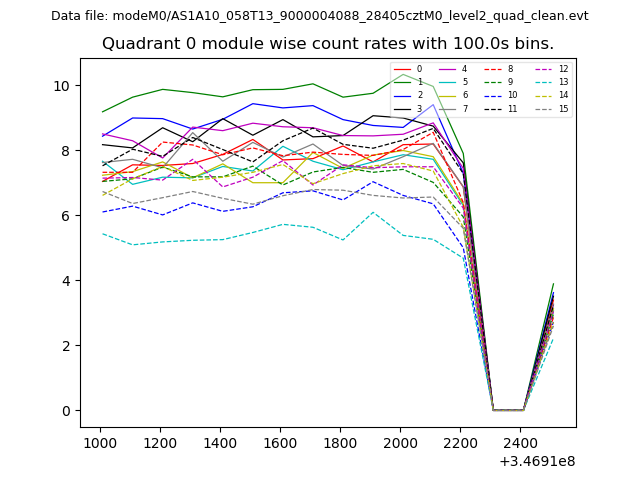
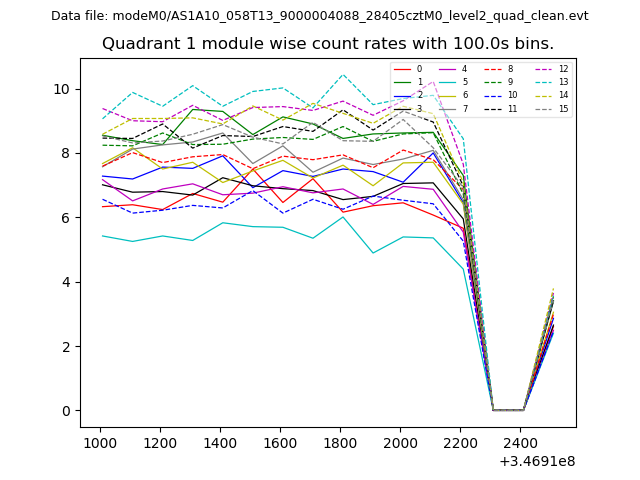
| Module-wise count rates for Quadrant A Data is divided into 100 sec bins |
 |
 |
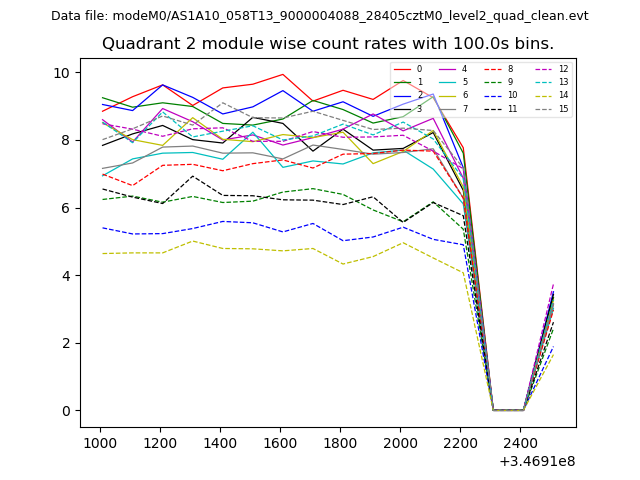
| Module-wise count rates for Quadrant B Data is divided into 100 sec bins |
 |
 |
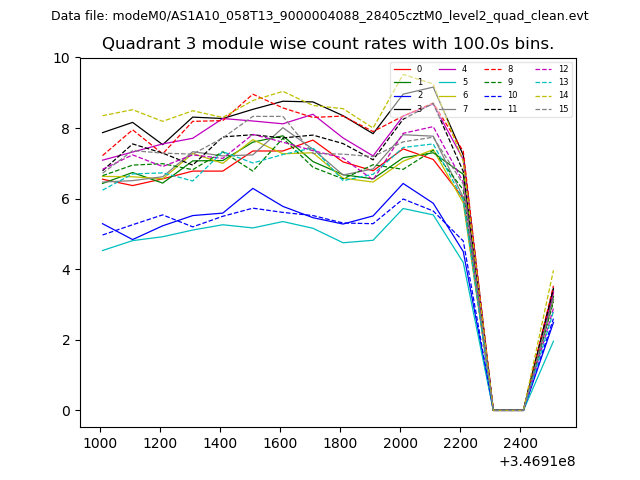
| Module-wise count rates for Quadrant C Data is divided into 100 sec bins |
 |
 |
| Module-wise count rates for Quadrant D Data is divided into 100 sec bins |
 |
 |
| Parameter | Plot |
|---|---|
| CZT HV Monitor | 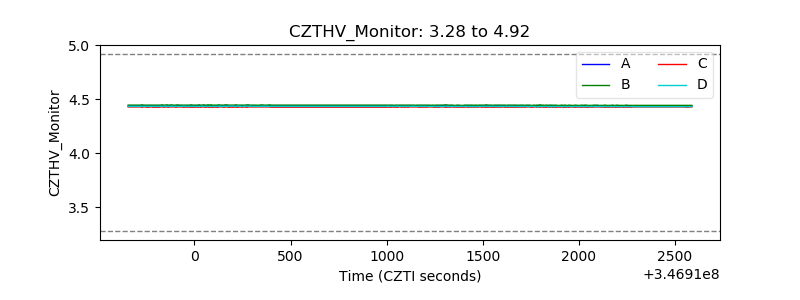 |
| D_VDD | 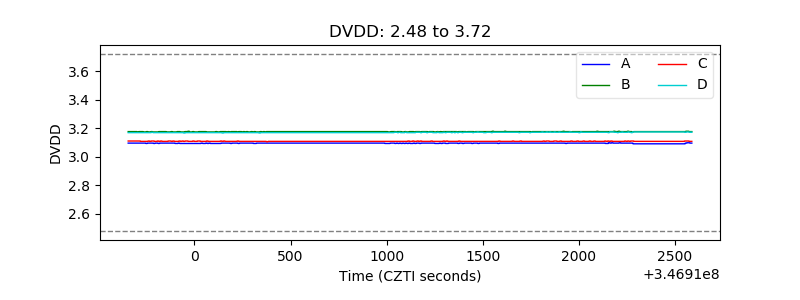 |
| Temperature 1 | 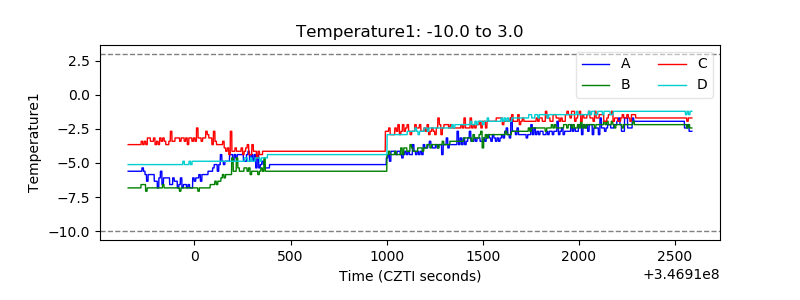 |
| Veto HV Monitor | 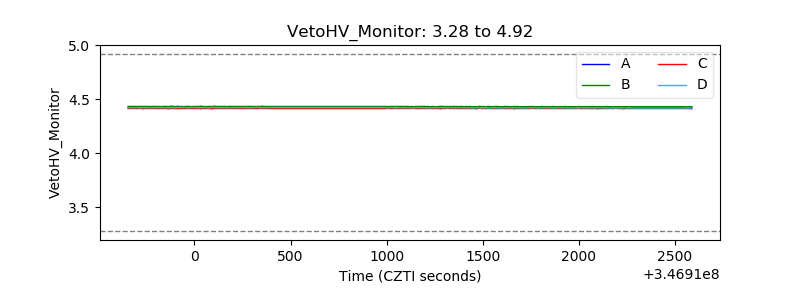 |
| Veto LLD | 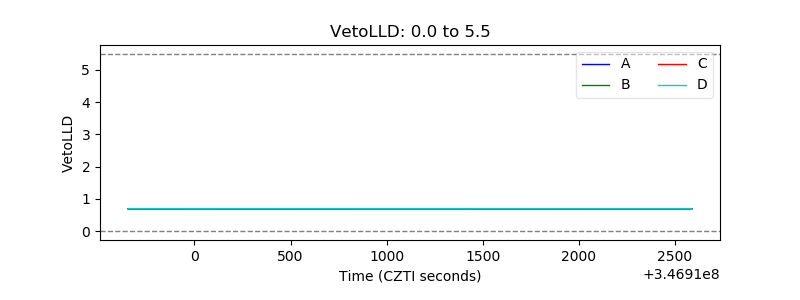 |
| Alpha Counter | 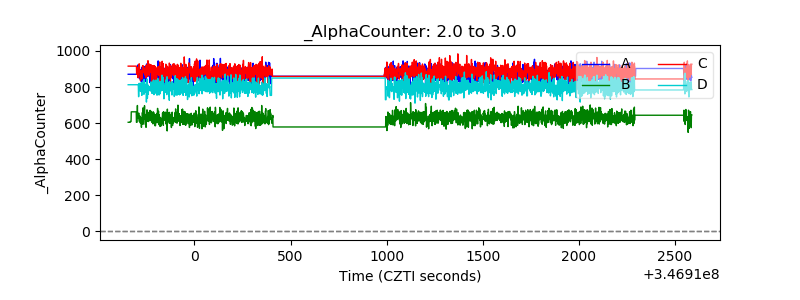 |
| _CPM_Rate | 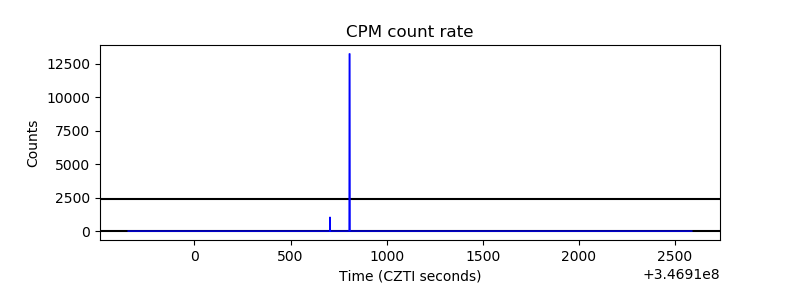 |
| CZT Counter | 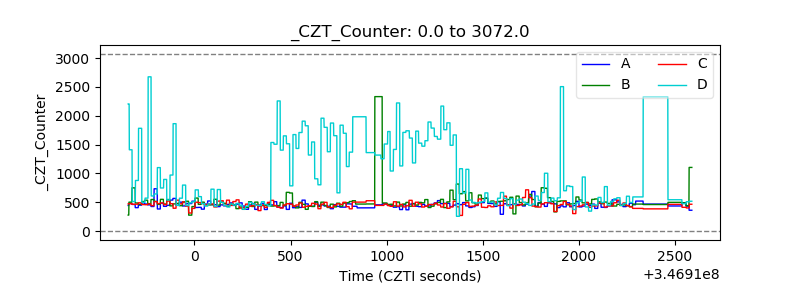 |
| +2.5 Volts monitor |  |
| +5 Volts monitor |  |
| _ROLL_ROT | 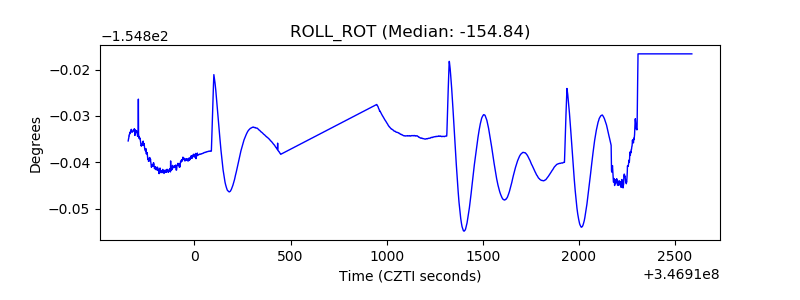 |
| _Roll_DEC | 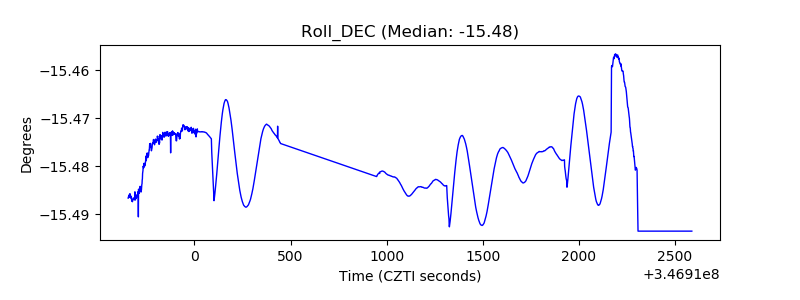 |
| _Roll_RA | 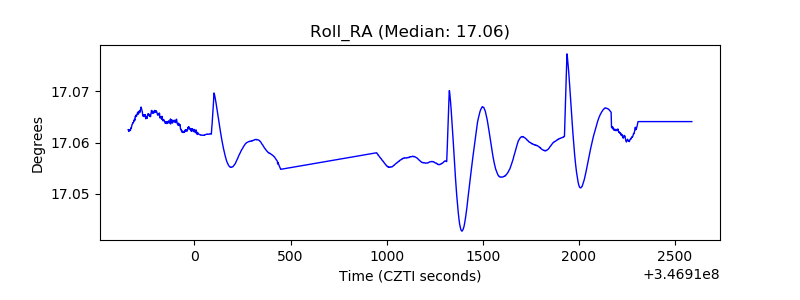 |
| Veto Counter | 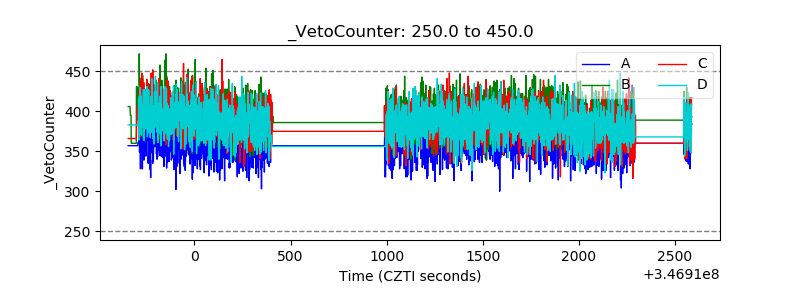 |