| Param | Original file | Final file |
|---|---|---|
| Filename | modeM0/AS1A10_058T13_9000004088_28408cztM0_level2.evt | modeM0/AS1A10_058T13_9000004088_28408cztM0_level2_quad_clean.evt |
| Size (bytes) | 1,517,126,400 | 232,021,440 |
| Size | 1.4 GB | 221.3 MB |
| Events in quadrant A | 8,716,720 | 1,477,802 |
| Events in quadrant B | 9,686,920 | 1,494,883 |
| Events in quadrant C | 8,745,658 | 1,433,471 |
| Events in quadrant D | 17,560,349 | 1,357,589 |
| Mode M0 | |||
|---|---|---|---|
| Quadrant | BADHDUFLAG | Total packets | Discarded packets |
| A | 0 | 37489 | 0 |
| B | 0 | 40161 | 0 |
| C | 0 | 37612 | 0 |
| D | 0 | 64025 | 0 |
| Mode M9 | |||
|---|---|---|---|
| Quadrant | BADHDUFLAG | Total packets | Discarded packets |
| A | 0 | 16 | 0 |
| B | 0 | 16 | 0 |
| C | 0 | 16 | 0 |
| D | 0 | 16 | 0 |
| Quadrant | Total seconds | Saturated seconds | Saturation percentage |
|---|---|---|---|
| A | 18323 | 222 | 1.211592% |
| B | 18324 | 330 | 1.800917% |
| C | 18324 | 326 | 1.779088% |
| D | 18324 | 1854 | 10.117878% |
Noise dominated data is calculated using 1-second bins in cleaned event files. If a bin has >2000 counts, and if more than 50% of those come from <1% of pixels, then it is considered to be noise-dominated and hence unusable.
| Quadrant | # 1 sec bins | Bins with >0 counts | Bins with >2000 counts | High rate bins dominated by noise | Noise dominated (total time) | Noise dominated (detector-on time) | Marked lightcurve |
|---|---|---|---|---|---|---|---|
| A | 20028 | 18323 | 3 | 3 | 0.01% | 0.02% | 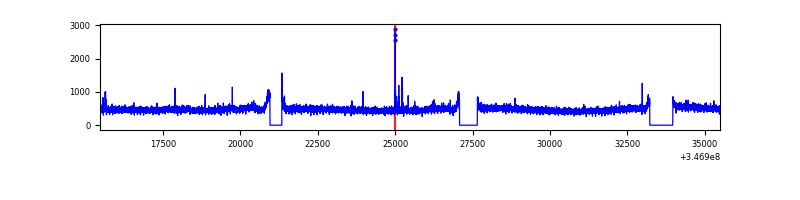 |
| B | 20029 | 18324 | 50 | 50 | 0.25% | 0.27% | 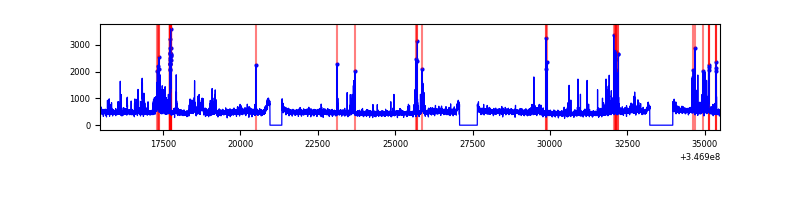 |
| C | 20029 | 18324 | 1 | 1 | 0.00% | 0.01% | 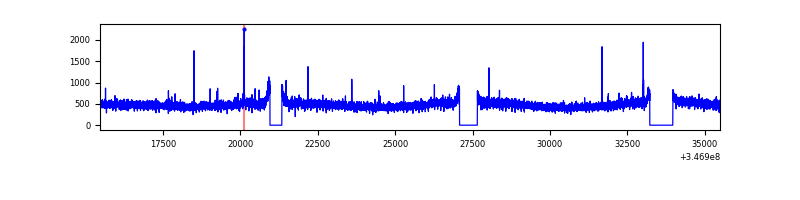 |
| D | 20029 | 18324 | 1665 | 1665 | 8.31% | 9.09% | 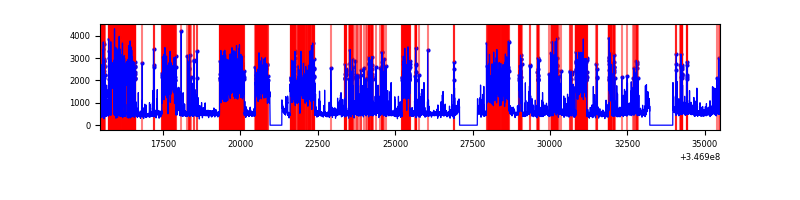 |
Top three noisy pixels from each quadrant. If the there are fewer than three noisy pixels in the level2.evt file, extra rows are filled as -1
| Pixel properties | Quadrant properties | ||||||
|---|---|---|---|---|---|---|---|
| Quadrant | DetID | PixID | Counts | Sigma | Mean | Median | Sigma |
| A | 15 | 174 | 70336 | 151.86 | 2231 | 2182 | 448.8 |
| A | 13 | 254 | 27497 | 56.41 | 2231 | 2182 | 448.8 |
| A | 12 | 96 | 24856 | 50.52 | 2231 | 2182 | 448.8 |
| B | 10 | 245 | 884685 | 2075.73 | 2210 | 2152 | 425.2 |
| B | 0 | 230 | 66093 | 150.39 | 2210 | 2152 | 425.2 |
| B | 12 | 111 | 54235 | 122.5 | 2210 | 2152 | 425.2 |
| C | 14 | 238 | 345435 | 680.11 | 2137 | 2150 | 504.8 |
| C | 7 | 220 | 50502 | 95.79 | 2137 | 2150 | 504.8 |
| C | 13 | 61 | 14547 | 24.56 | 2137 | 2150 | 504.8 |
| D | 8 | 195 | 5687706 | 11269.54 | 2096 | 2037 | 504.5 |
| D | 1 | 52 | 3487133 | 6907.79 | 2096 | 2037 | 504.5 |
| D | 2 | 250 | 247567 | 486.66 | 2096 | 2037 | 504.5 |
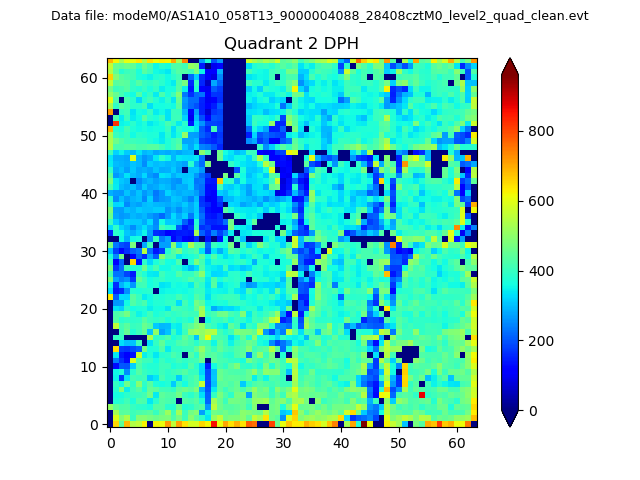
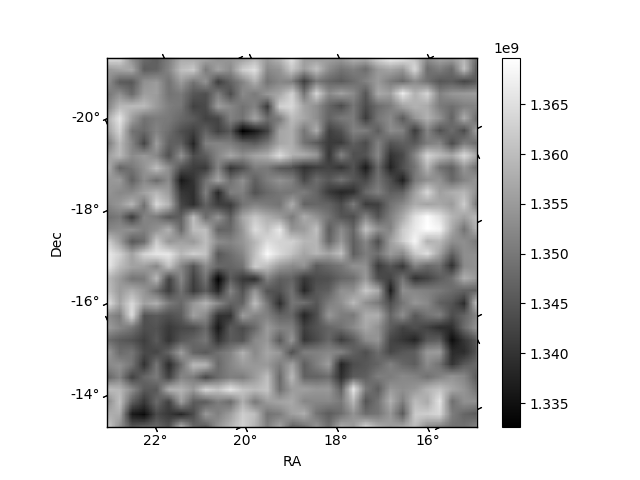
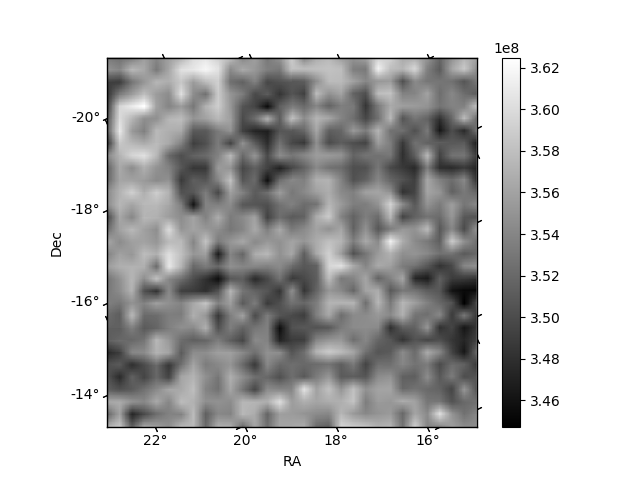
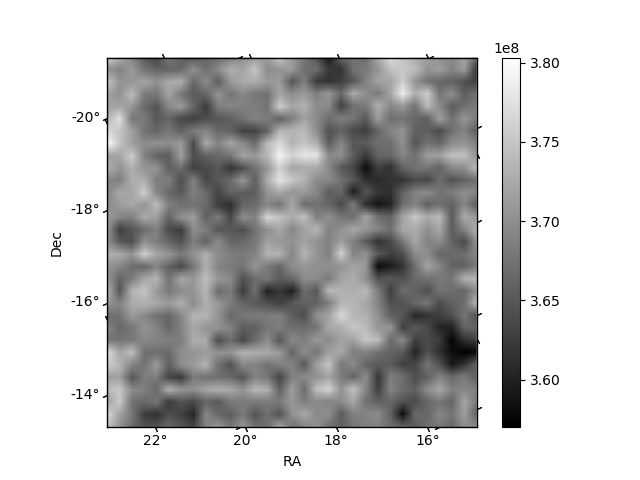
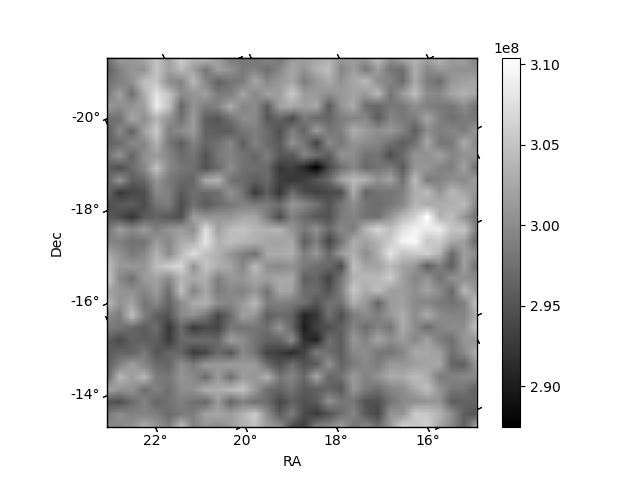
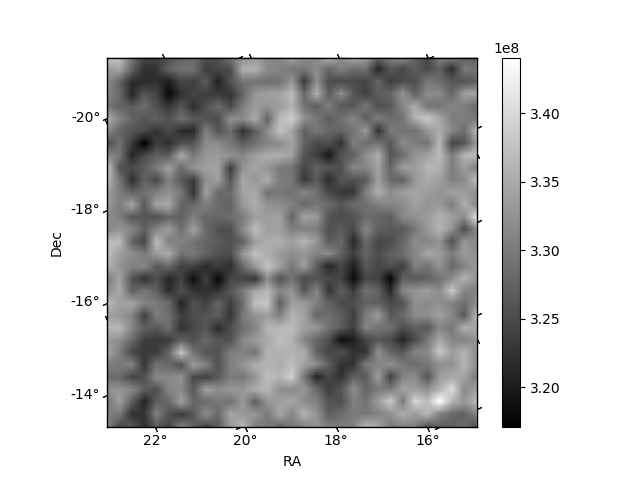
Histogram calculated using DETX and DETY for each event in the final _common_clean file
| Quadrant A | 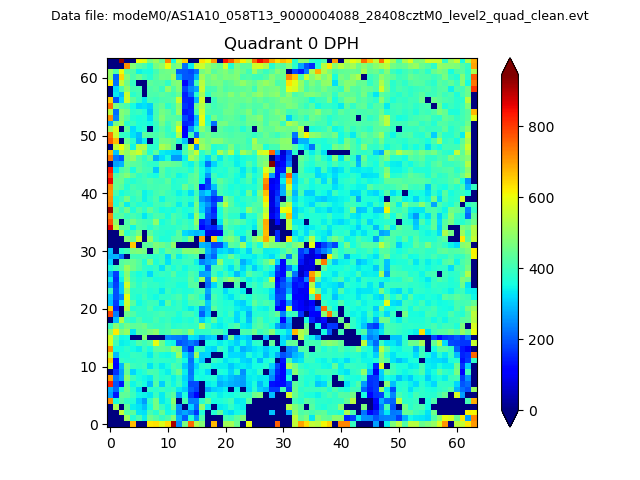 |
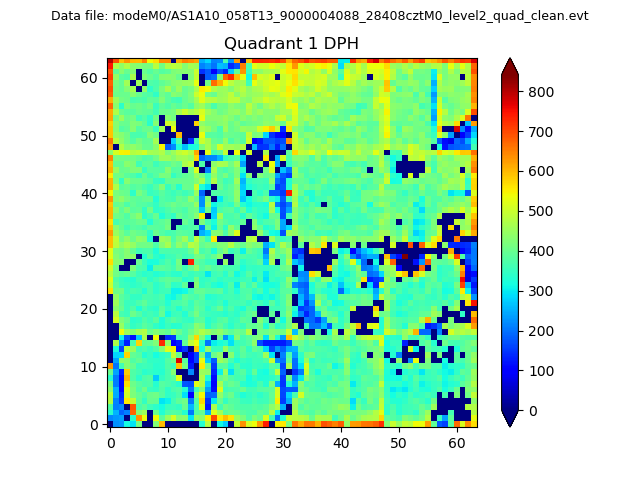 |
Quadrant B |
|---|---|---|---|
| Quadrant D | 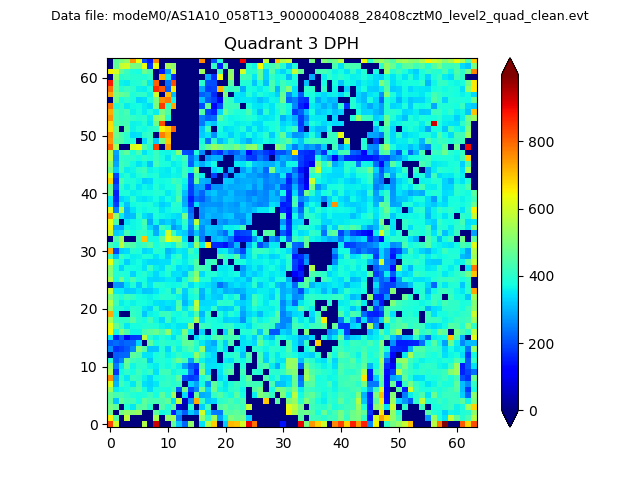 |
 |
Quadrant C |
| Plot type | Count rate plots | Images |
|---|---|---|
| Comparison with Poisson distribution Blue bars denote a histogram of data divided into 1 sec bins. Red curve is a Poisson curve with rate = median count rate of data. |
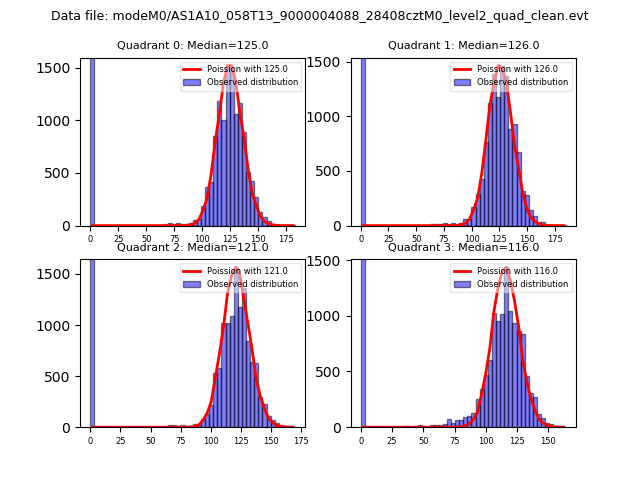 |
 |
| Quadrant-wise count rates Data is divided into 100 sec bins |
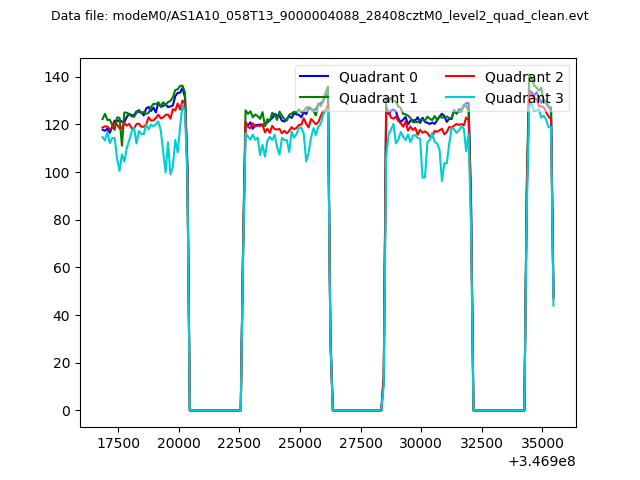 |
|
| Module-wise count rates for Quadrant A Data is divided into 100 sec bins |
 |
 |
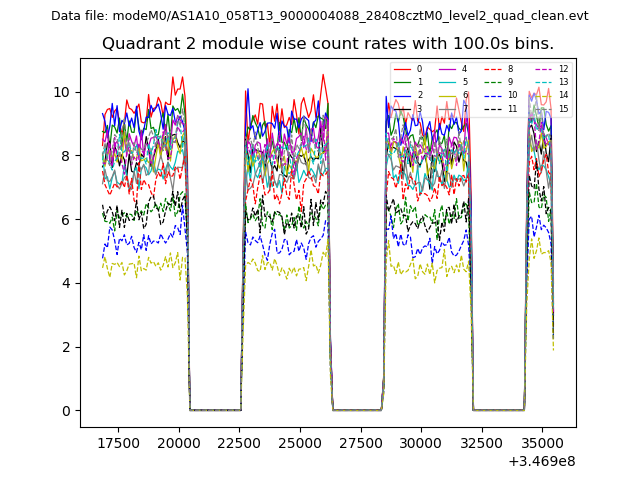
| Module-wise count rates for Quadrant B Data is divided into 100 sec bins |
 |
 |
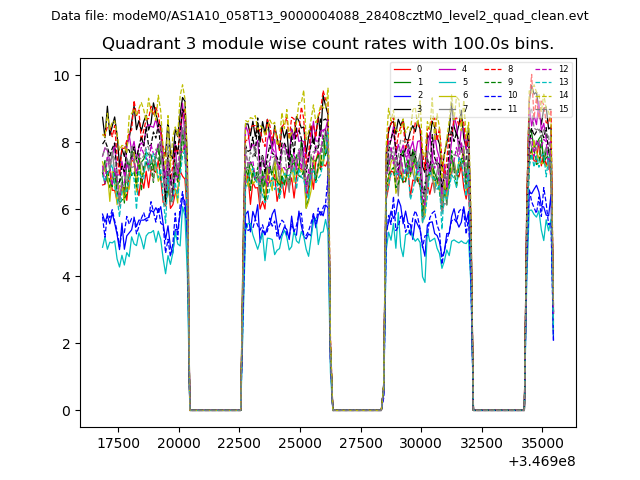
| Module-wise count rates for Quadrant C Data is divided into 100 sec bins |
 |
 |
| Module-wise count rates for Quadrant D Data is divided into 100 sec bins |
 |
 |
| Parameter | Plot |
|---|---|
| CZT HV Monitor |  |
| D_VDD | 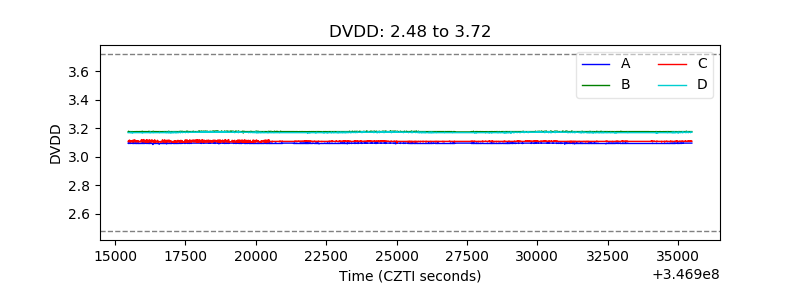 |
| Temperature 1 | 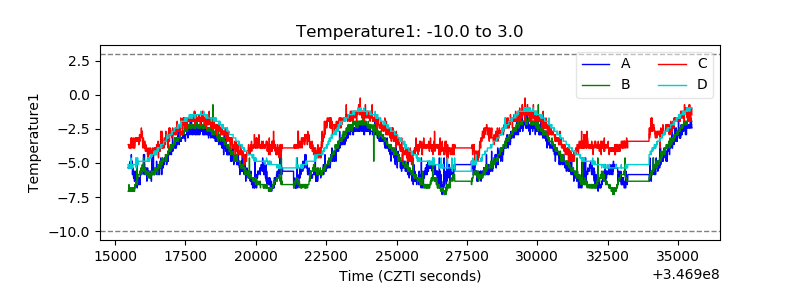 |
| Veto HV Monitor |  |
| Veto LLD | 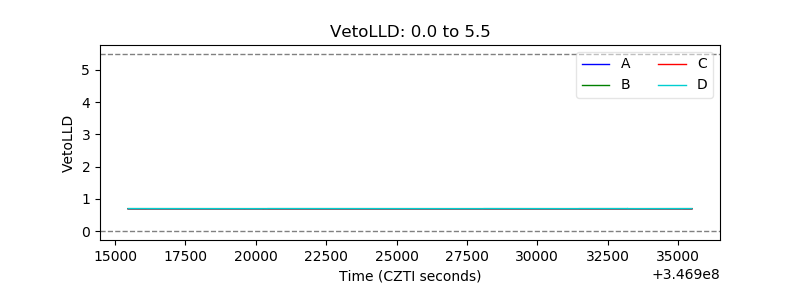 |
| Alpha Counter | 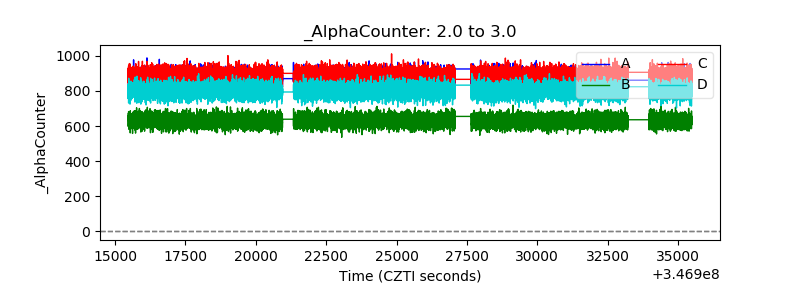 |
| _CPM_Rate | 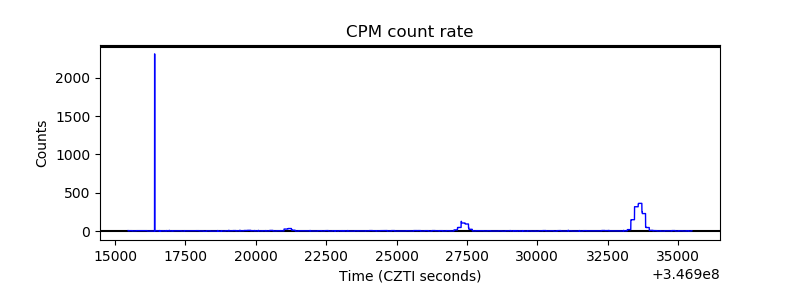 |
| CZT Counter | 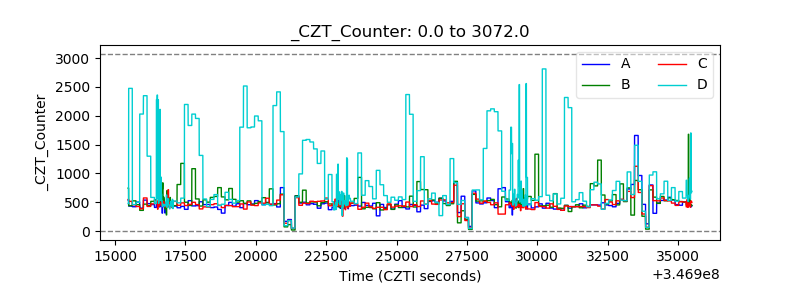 |
| +2.5 Volts monitor | 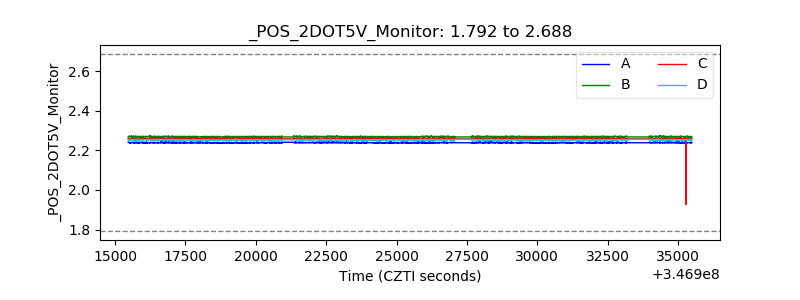 |
| +5 Volts monitor | 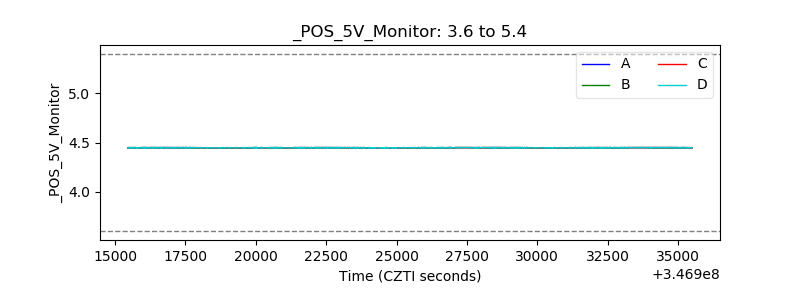 |
| _ROLL_ROT | 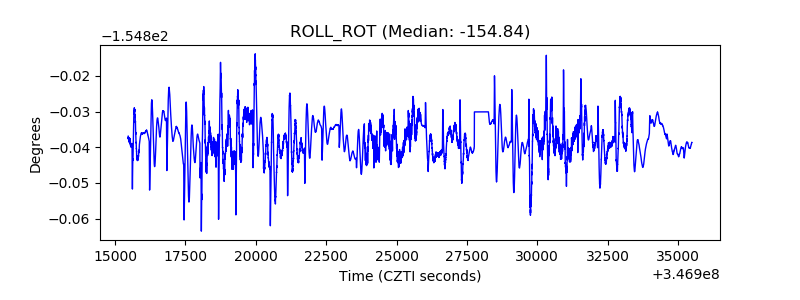 |
| _Roll_DEC | 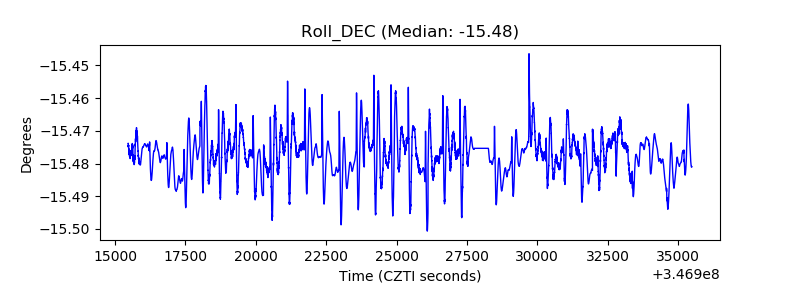 |
| _Roll_RA | 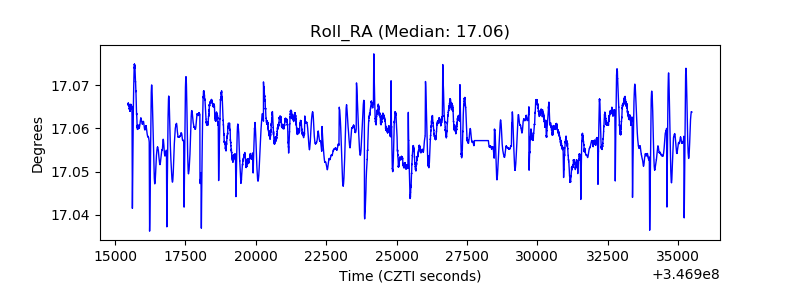 |
| Veto Counter | 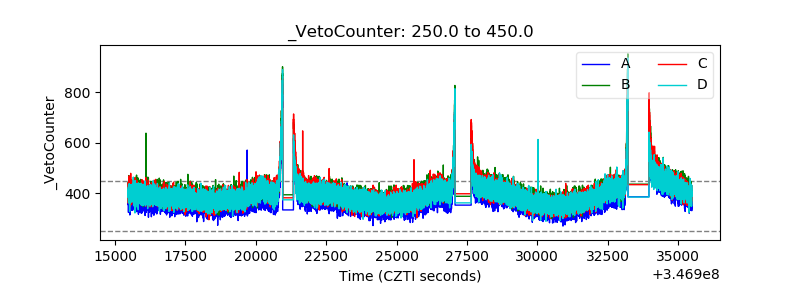 |