| Param | Original file | Final file |
|---|---|---|
| Filename | modeM0/AS1A10_058T13_9000004088_28409cztM0_level2.evt | modeM0/AS1A10_058T13_9000004088_28409cztM0_level2_quad_clean.evt |
| Size (bytes) | 2,466,915,840 | 379,765,440 |
| Size | 2.3 GB | 362.2 MB |
| Events in quadrant A | 13,999,537 | 2,443,398 |
| Events in quadrant B | 15,790,480 | 2,463,094 |
| Events in quadrant C | 14,080,202 | 2,362,720 |
| Events in quadrant D | 28,863,167 | 2,215,410 |
| Mode M0 | |||
|---|---|---|---|
| Quadrant | BADHDUFLAG | Total packets | Discarded packets |
| A | 0 | 60486 | 0 |
| B | 0 | 65394 | 0 |
| C | 0 | 60633 | 0 |
| D | 0 | 104834 | 0 |
| Mode M9 | |||
|---|---|---|---|
| Quadrant | BADHDUFLAG | Total packets | Discarded packets |
| A | 0 | 27 | 0 |
| B | 0 | 27 | 0 |
| C | 0 | 27 | 0 |
| D | 0 | 27 | 0 |
| Quadrant | Total seconds | Saturated seconds | Saturation percentage |
|---|---|---|---|
| A | 29347 | 422 | 1.437966% |
| B | 29347 | 653 | 2.225100% |
| C | 29347 | 594 | 2.024057% |
| D | 29347 | 3410 | 11.619586% |
Noise dominated data is calculated using 1-second bins in cleaned event files. If a bin has >2000 counts, and if more than 50% of those come from <1% of pixels, then it is considered to be noise-dominated and hence unusable.
| Quadrant | # 1 sec bins | Bins with >0 counts | Bins with >2000 counts | High rate bins dominated by noise | Noise dominated (total time) | Noise dominated (detector-on time) | Marked lightcurve |
|---|---|---|---|---|---|---|---|
| A | 32147 | 29347 | 4 | 4 | 0.01% | 0.01% | 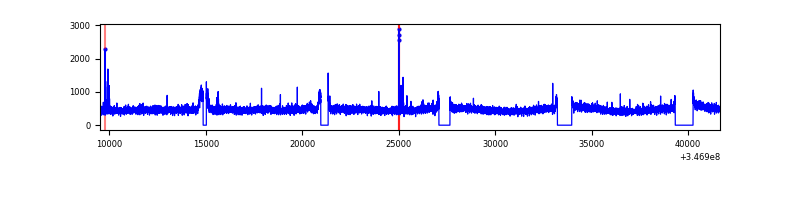 |
| B | 32147 | 29347 | 110 | 110 | 0.34% | 0.37% | 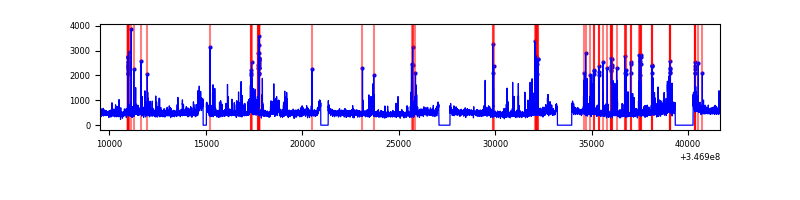 |
| C | 32147 | 29348 | 3 | 3 | 0.01% | 0.01% | 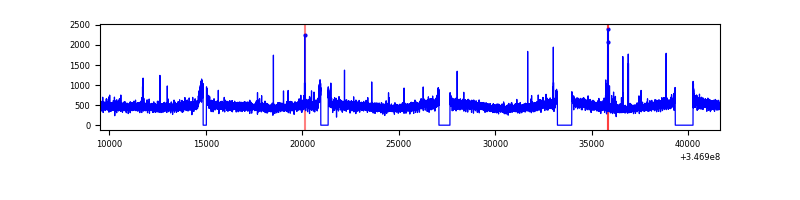 |
| D | 32147 | 29348 | 3001 | 3001 | 9.34% | 10.23% | 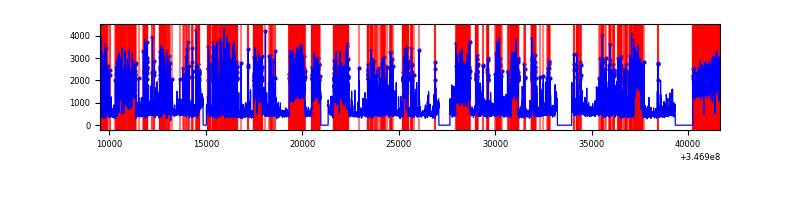 |
Top three noisy pixels from each quadrant. If the there are fewer than three noisy pixels in the level2.evt file, extra rows are filled as -1
| Pixel properties | Quadrant properties | ||||||
|---|---|---|---|---|---|---|---|
| Quadrant | DetID | PixID | Counts | Sigma | Mean | Median | Sigma |
| A | 15 | 174 | 73369 | 96.88 | 3595 | 3512 | 721.1 |
| A | 13 | 254 | 44894 | 57.39 | 3595 | 3512 | 721.1 |
| A | 3 | 137 | 36575 | 45.85 | 3595 | 3512 | 721.1 |
| B | 10 | 245 | 1579951 | 2311.39 | 3556 | 3465 | 682.0 |
| B | 0 | 230 | 155965 | 223.59 | 3556 | 3465 | 682.0 |
| B | 12 | 111 | 87153 | 122.7 | 3556 | 3465 | 682.0 |
| C | 14 | 238 | 553057 | 678.05 | 3435 | 3456 | 810.6 |
| C | 7 | 220 | 115362 | 138.06 | 3435 | 3456 | 810.6 |
| C | 13 | 61 | 23578 | 24.82 | 3435 | 3456 | 810.6 |
| D | 8 | 195 | 9553370 | 11801.62 | 3367 | 3276 | 809.2 |
| D | 1 | 52 | 5595320 | 6910.42 | 3367 | 3276 | 809.2 |
| D | 2 | 250 | 558239 | 685.8 | 3367 | 3276 | 809.2 |
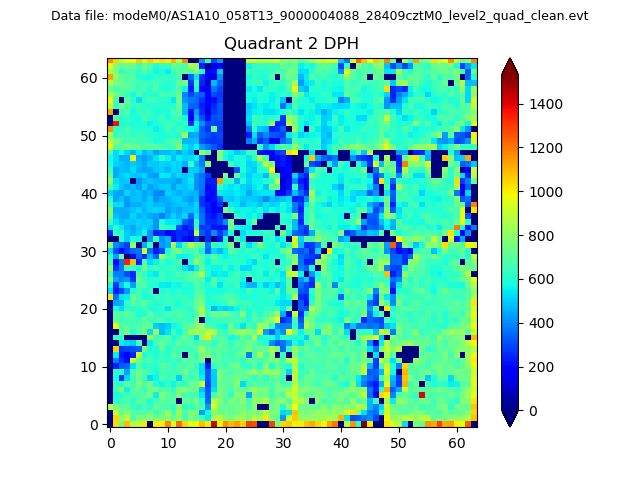
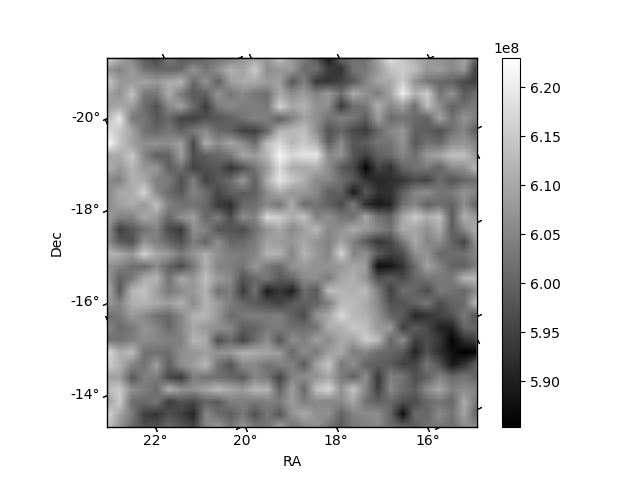
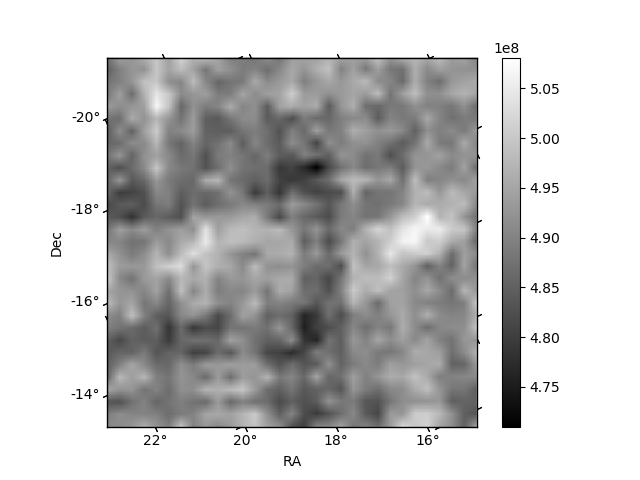
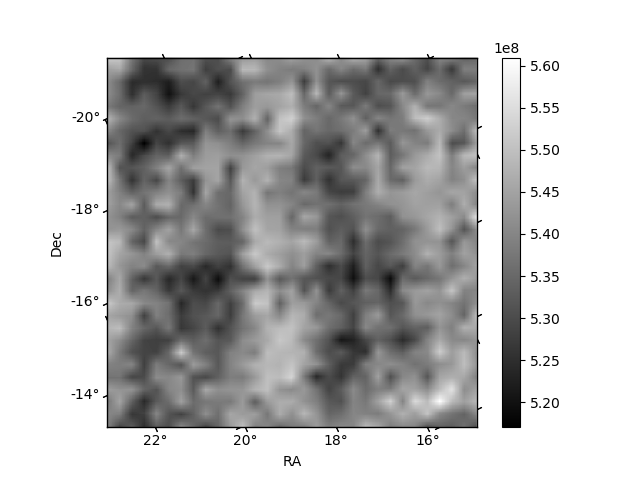
Histogram calculated using DETX and DETY for each event in the final _common_clean file
| Quadrant A | 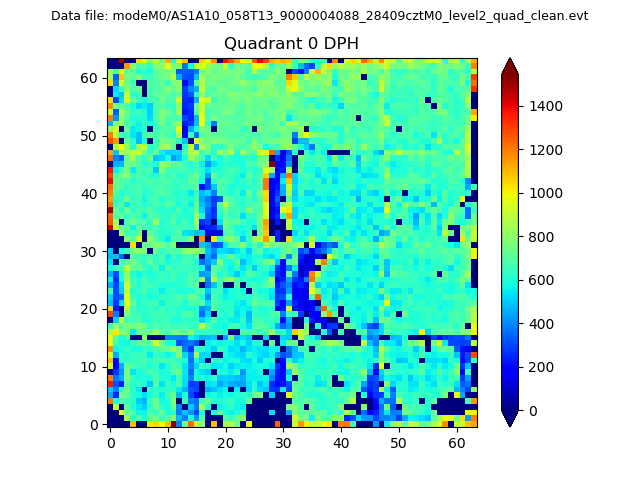 |
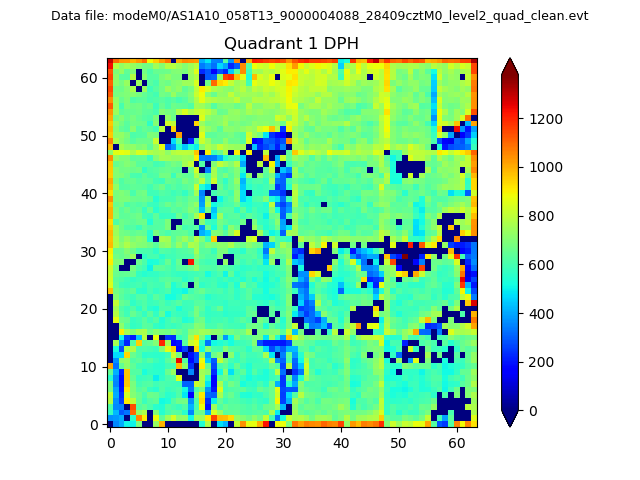 |
Quadrant B |
|---|---|---|---|
| Quadrant D | 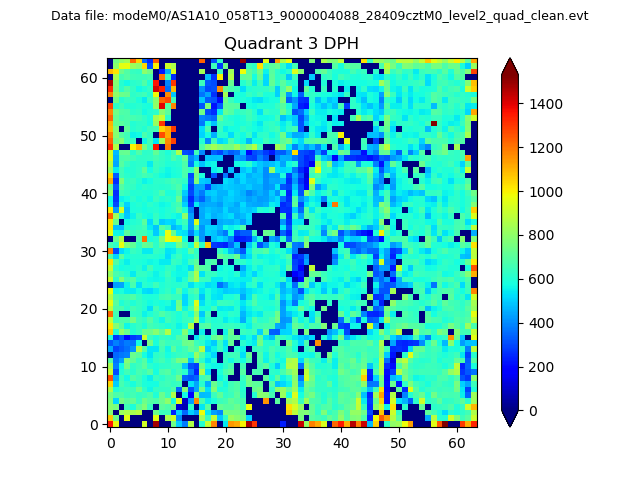 |
 |
Quadrant C |
| Plot type | Count rate plots | Images |
|---|---|---|
| Comparison with Poisson distribution Blue bars denote a histogram of data divided into 1 sec bins. Red curve is a Poisson curve with rate = median count rate of data. |
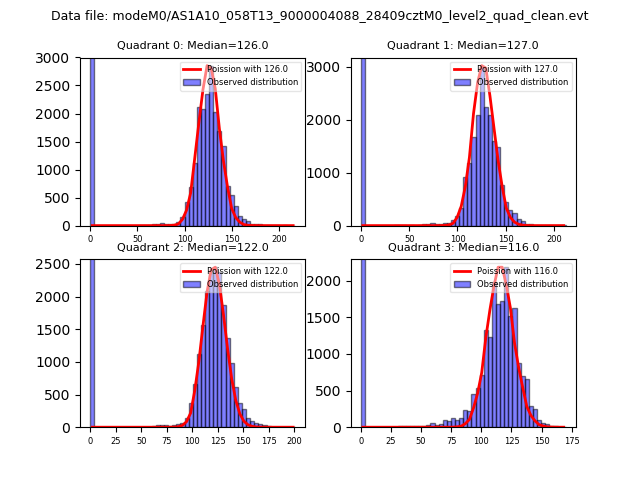 |
 |
| Quadrant-wise count rates Data is divided into 100 sec bins |
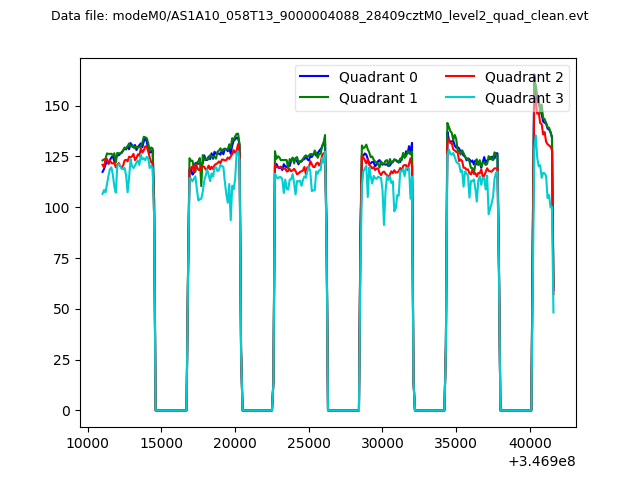 |
|
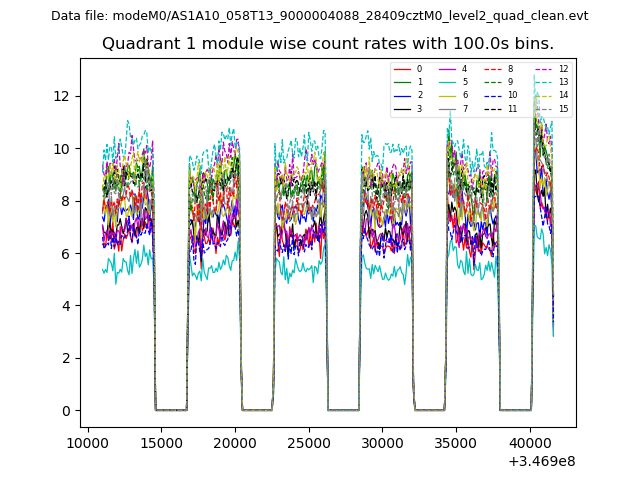
| Module-wise count rates for Quadrant A Data is divided into 100 sec bins |
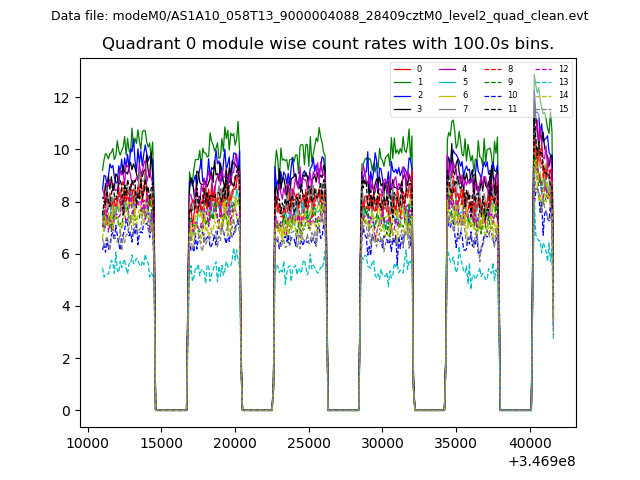 |
 |
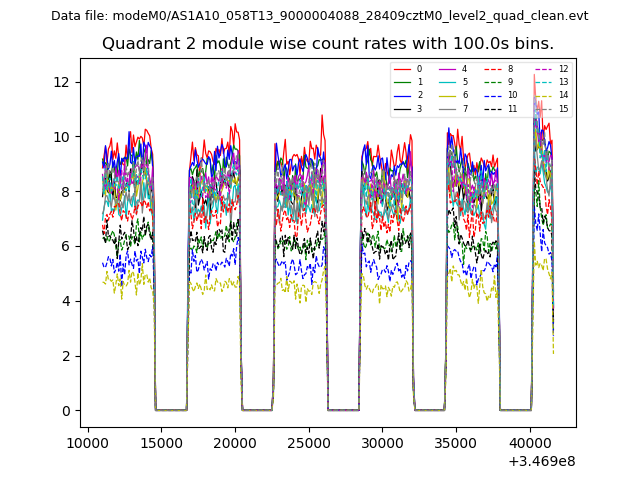
| Module-wise count rates for Quadrant B Data is divided into 100 sec bins |
 |
 |
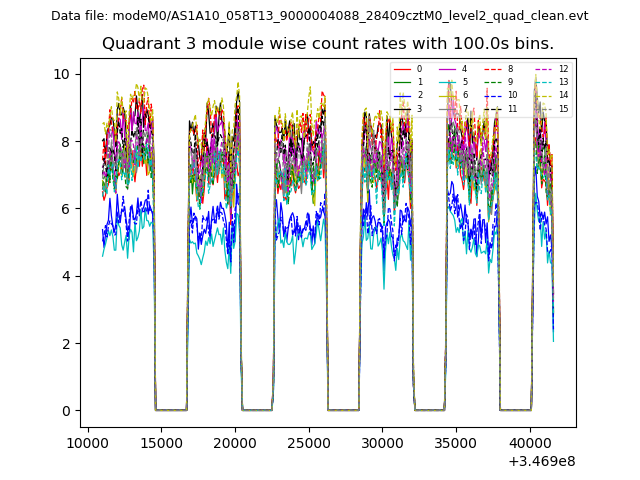
| Module-wise count rates for Quadrant C Data is divided into 100 sec bins |
 |
 |
| Module-wise count rates for Quadrant D Data is divided into 100 sec bins |
 |
 |
| Parameter | Plot |
|---|---|
| CZT HV Monitor | 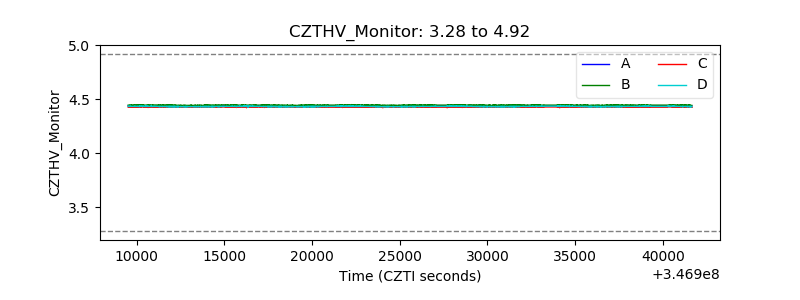 |
| D_VDD | 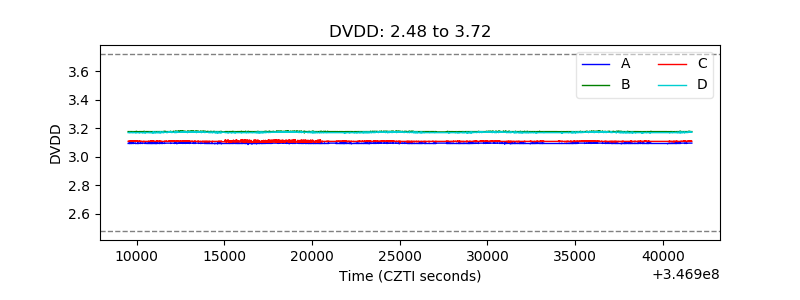 |
| Temperature 1 | 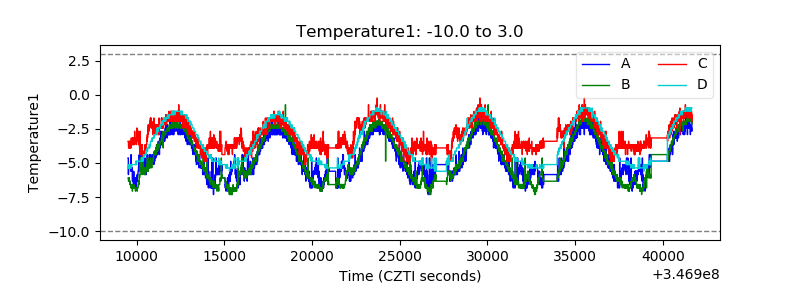 |
| Veto HV Monitor | 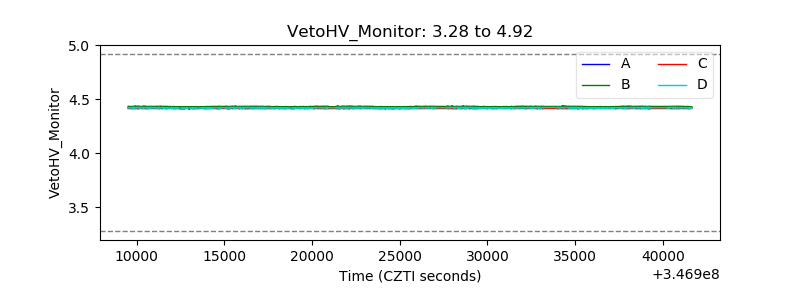 |
| Veto LLD | 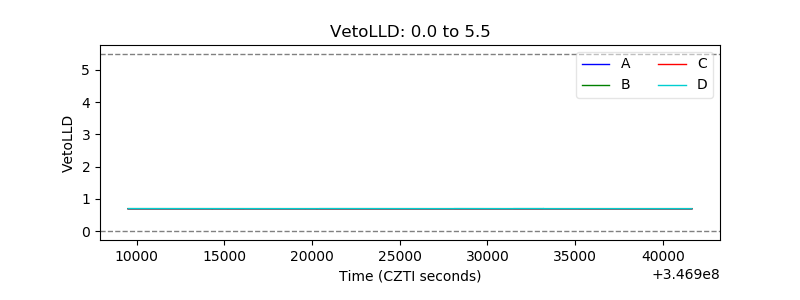 |
| Alpha Counter | 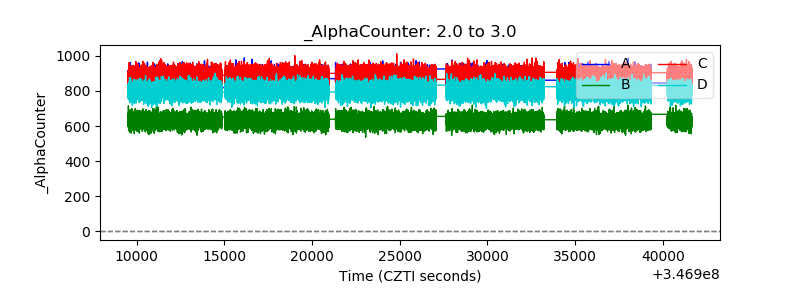 |
| _CPM_Rate | 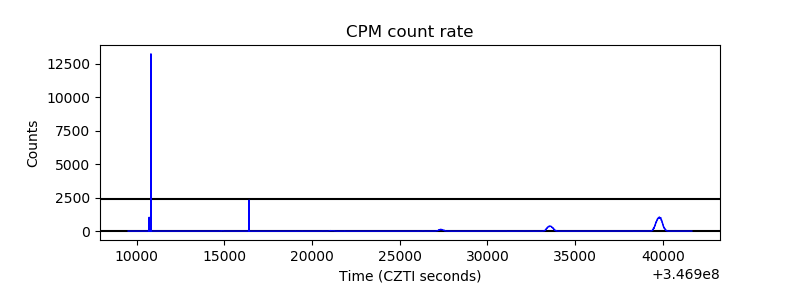 |
| CZT Counter | 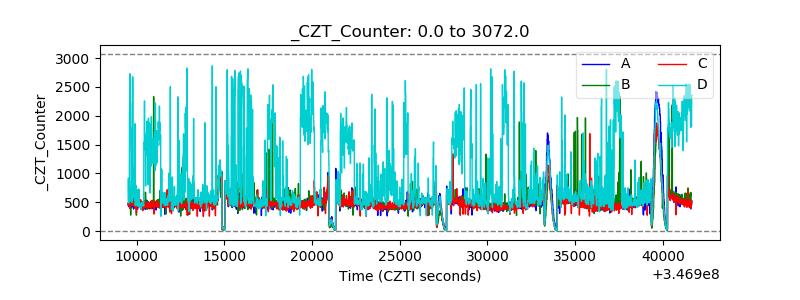 |
| +2.5 Volts monitor |  |
| +5 Volts monitor |  |
| _ROLL_ROT | 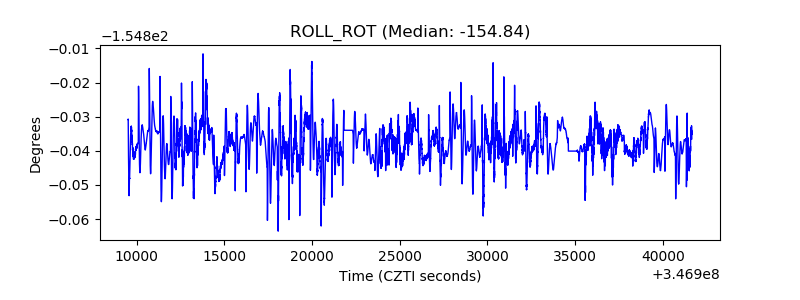 |
| _Roll_DEC | 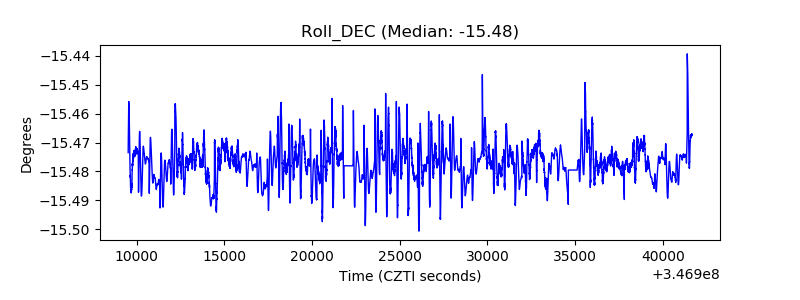 |
| _Roll_RA |  |
| Veto Counter | 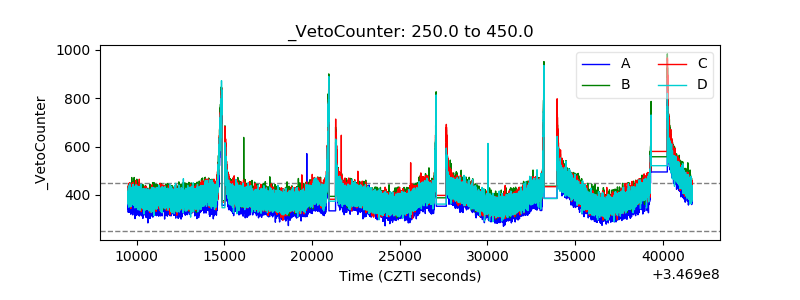 |