| Param | Original file | Final file |
|---|---|---|
| Filename | modeM0/AS1A10_058T13_9000004088_28411cztM0_level2.evt | modeM0/AS1A10_058T13_9000004088_28411cztM0_level2_quad_clean.evt |
| Size (bytes) | 539,657,280 | 86,477,760 |
| Size | 514.7 MB | 82.5 MB |
| Events in quadrant A | 2,838,597 | 581,620 |
| Events in quadrant B | 4,008,997 | 577,132 |
| Events in quadrant C | 2,844,417 | 550,740 |
| Events in quadrant D | 6,254,696 | 499,784 |
| Mode M0 | |||
|---|---|---|---|
| Quadrant | BADHDUFLAG | Total packets | Discarded packets |
| A | 0 | 12282 | 0 |
| B | 0 | 15731 | 0 |
| C | 0 | 12262 | 0 |
| D | 0 | 22522 | 0 |
| Mode M9 | |||
|---|---|---|---|
| Quadrant | BADHDUFLAG | Total packets | Discarded packets |
| A | 0 | 10 | 0 |
| B | 0 | 10 | 0 |
| C | 0 | 10 | 0 |
| D | 0 | 10 | 0 |
| Quadrant | Total seconds | Saturated seconds | Saturation percentage |
|---|---|---|---|
| A | 5852 | 43 | 0.734792% |
| B | 5852 | 195 | 3.332194% |
| C | 5853 | 75 | 1.281394% |
| D | 5852 | 850 | 14.524949% |
Noise dominated data is calculated using 1-second bins in cleaned event files. If a bin has >2000 counts, and if more than 50% of those come from <1% of pixels, then it is considered to be noise-dominated and hence unusable.
| Quadrant | # 1 sec bins | Bins with >0 counts | Bins with >2000 counts | High rate bins dominated by noise | Noise dominated (total time) | Noise dominated (detector-on time) | Marked lightcurve |
|---|---|---|---|---|---|---|---|
| A | 6932 | 5852 | 0 | 0 | 0.00% | 0.00% | 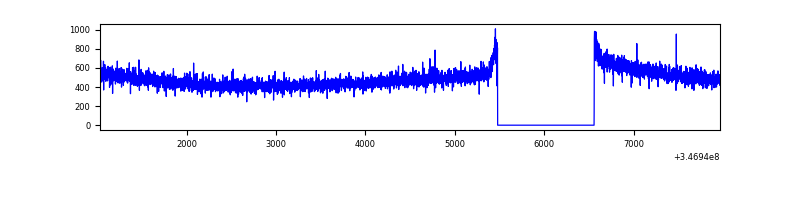 |
| B | 6932 | 5852 | 129 | 129 | 1.86% | 2.20% | 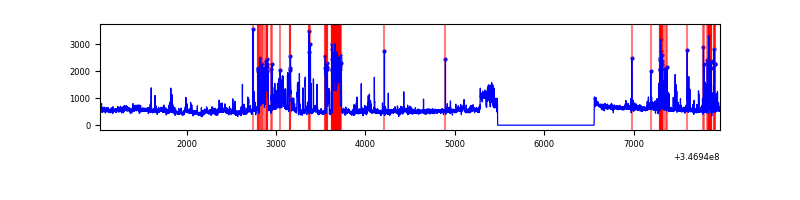 |
| C | 6933 | 5853 | 3 | 3 | 0.04% | 0.05% | 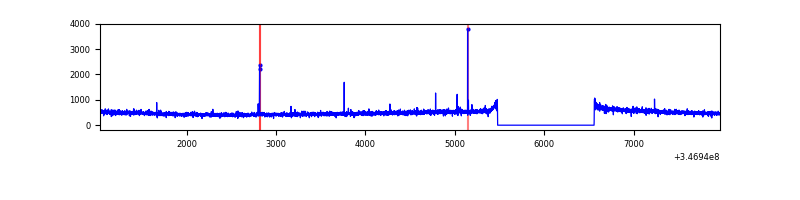 |
| D | 6931 | 5851 | 894 | 894 | 12.90% | 15.28% | 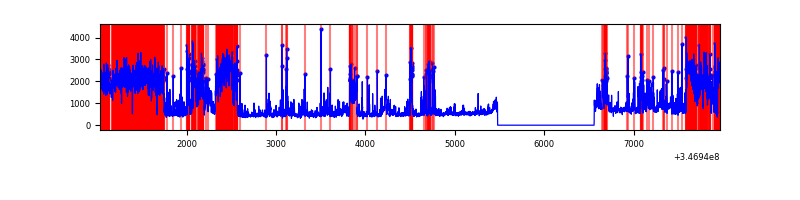 |
Top three noisy pixels from each quadrant. If the there are fewer than three noisy pixels in the level2.evt file, extra rows are filled as -1
| Pixel properties | Quadrant properties | ||||||
|---|---|---|---|---|---|---|---|
| Quadrant | DetID | PixID | Counts | Sigma | Mean | Median | Sigma |
| A | 13 | 254 | 8644 | 53.29 | 736 | 722 | 148.6 |
| A | 3 | 137 | 7091 | 42.85 | 736 | 722 | 148.6 |
| A | 0 | 226 | 6313 | 37.61 | 736 | 722 | 148.6 |
| B | 10 | 245 | 1117898 | 8028.65 | 724 | 709 | 139.2 |
| B | 0 | 230 | 30969 | 217.46 | 724 | 709 | 139.2 |
| B | 12 | 111 | 16863 | 116.09 | 724 | 709 | 139.2 |
| C | 14 | 238 | 114486 | 695.6 | 693 | 697 | 163.6 |
| C | 7 | 220 | 30516 | 182.28 | 693 | 697 | 163.6 |
| C | 13 | 61 | 4864 | 25.47 | 693 | 697 | 163.6 |
| D | 1 | 52 | 1530156 | 9481.35 | 676 | 658 | 161.3 |
| D | 8 | 195 | 1293033 | 8011.42 | 676 | 658 | 161.3 |
| D | 2 | 250 | 777924 | 4818.27 | 676 | 658 | 161.3 |
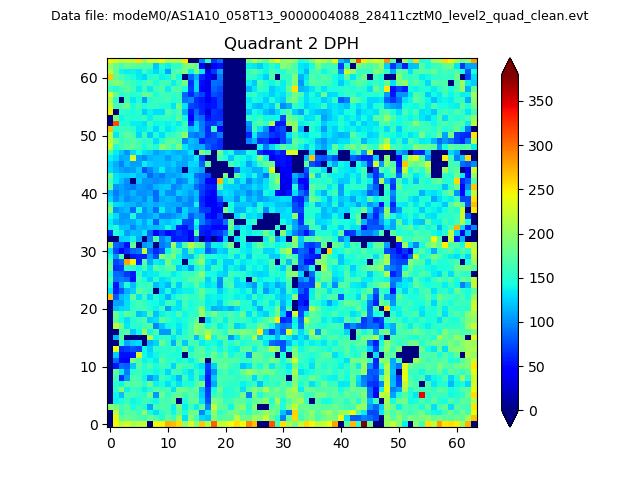
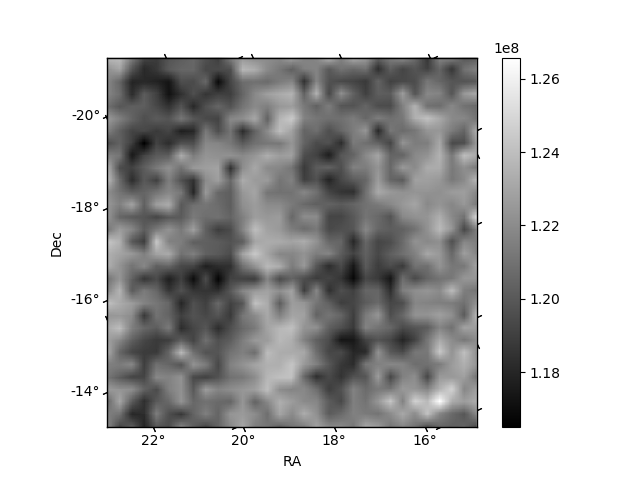
Histogram calculated using DETX and DETY for each event in the final _common_clean file
| Quadrant A | 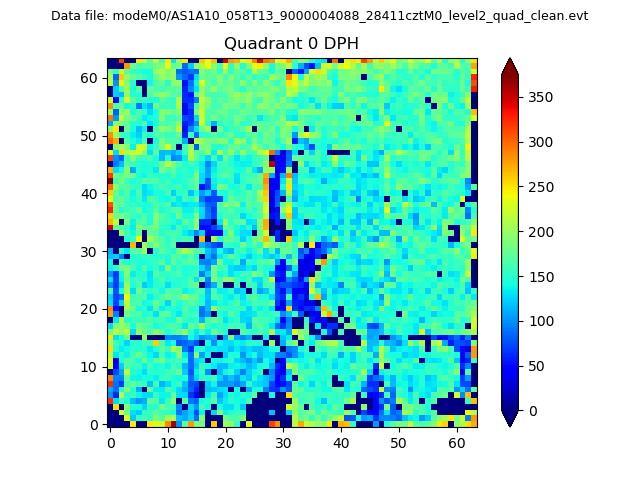 |
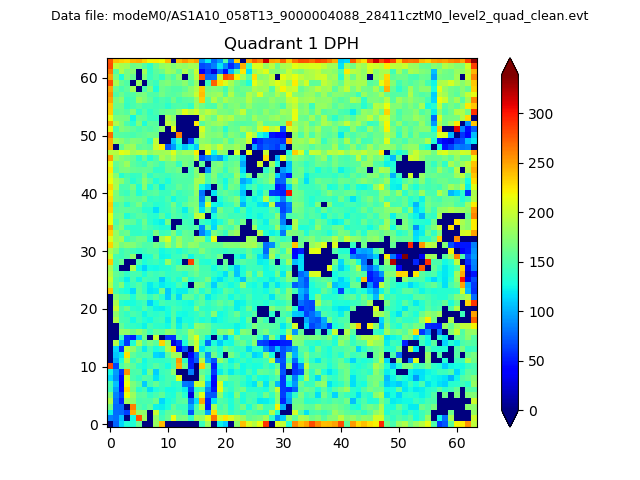 |
Quadrant B |
|---|---|---|---|
| Quadrant D | 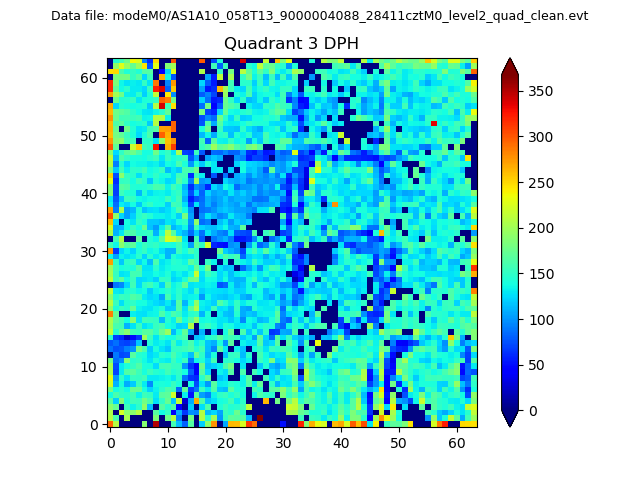 |
 |
Quadrant C |
| Plot type | Count rate plots | Images |
|---|---|---|
| Comparison with Poisson distribution Blue bars denote a histogram of data divided into 1 sec bins. Red curve is a Poisson curve with rate = median count rate of data. |
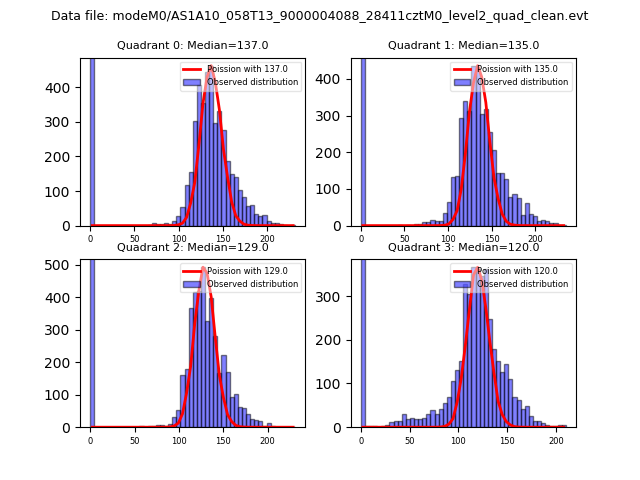 |
 |
| Quadrant-wise count rates Data is divided into 100 sec bins |
 |
|
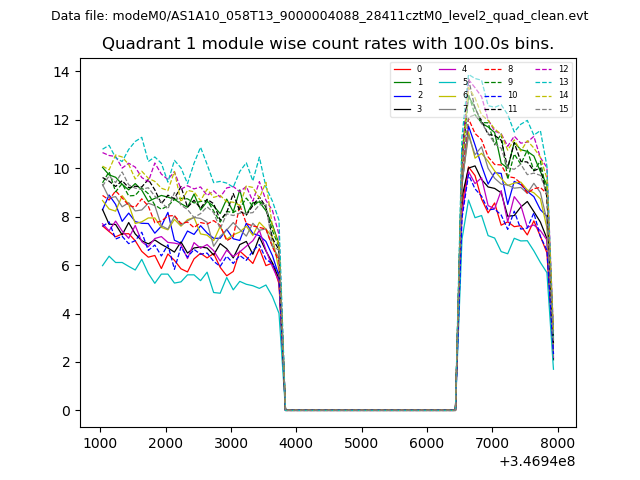
| Module-wise count rates for Quadrant A Data is divided into 100 sec bins |
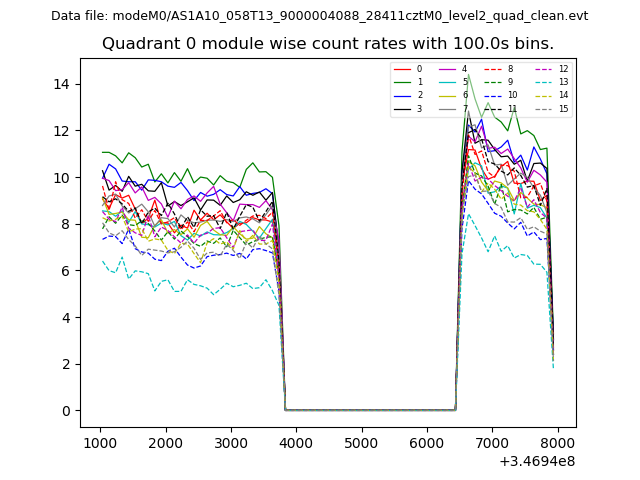 |
 |
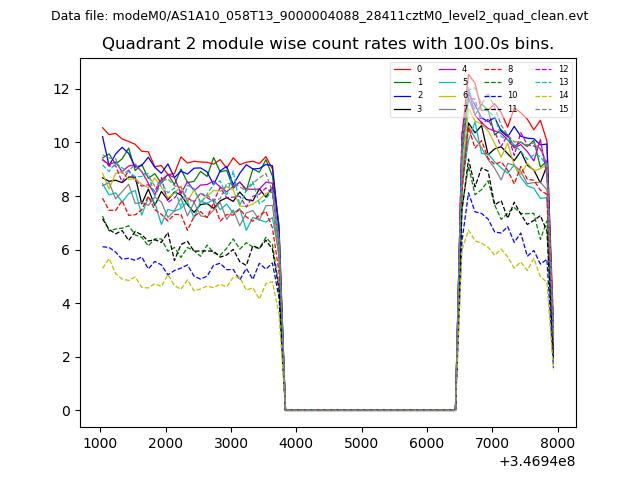
| Module-wise count rates for Quadrant B Data is divided into 100 sec bins |
 |
 |
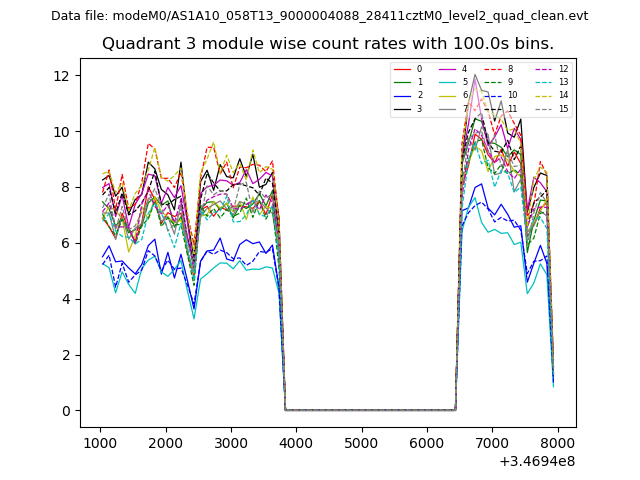
| Module-wise count rates for Quadrant C Data is divided into 100 sec bins |
 |
 |
| Module-wise count rates for Quadrant D Data is divided into 100 sec bins |
 |
 |
| Parameter | Plot |
|---|---|
| CZT HV Monitor | 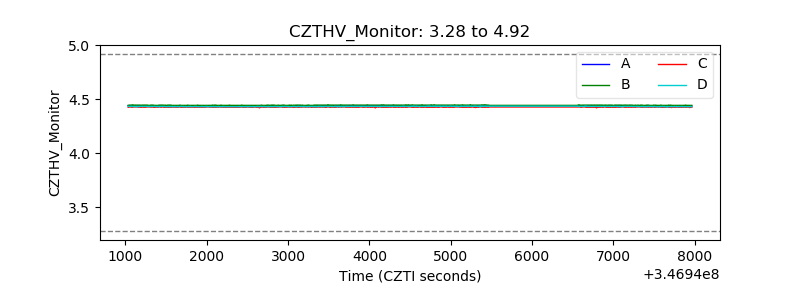 |
| D_VDD | 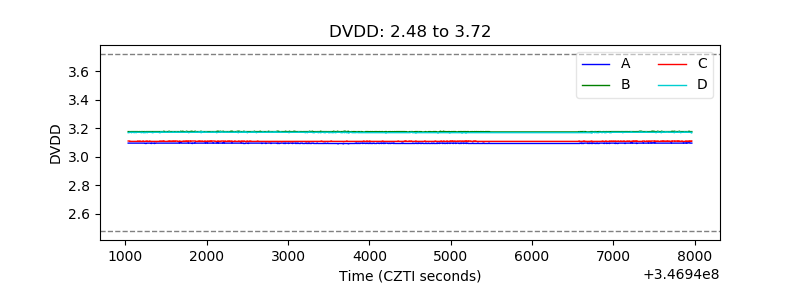 |
| Temperature 1 | 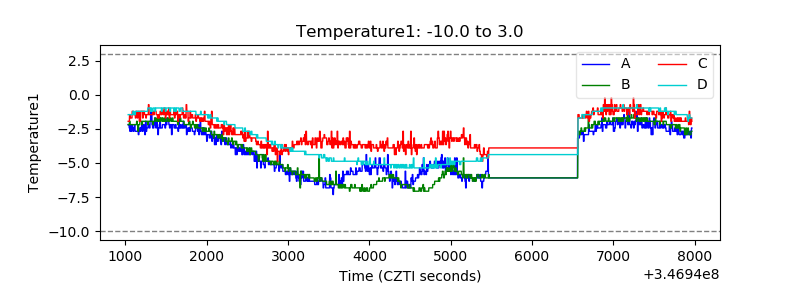 |
| Veto HV Monitor |  |
| Veto LLD | 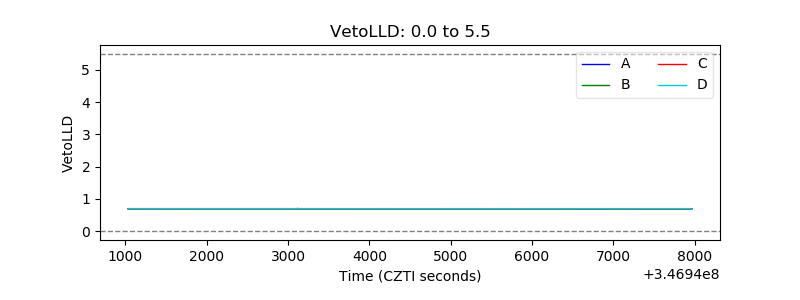 |
| Alpha Counter | 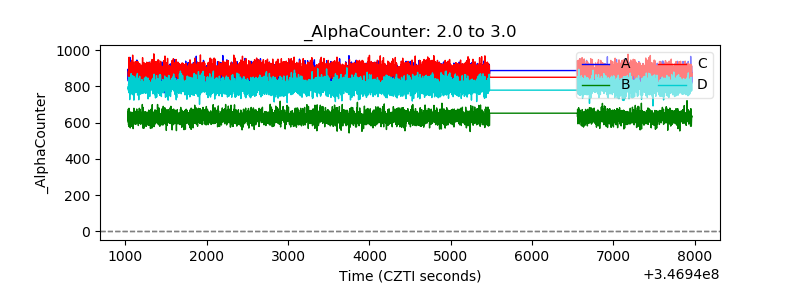 |
| _CPM_Rate | 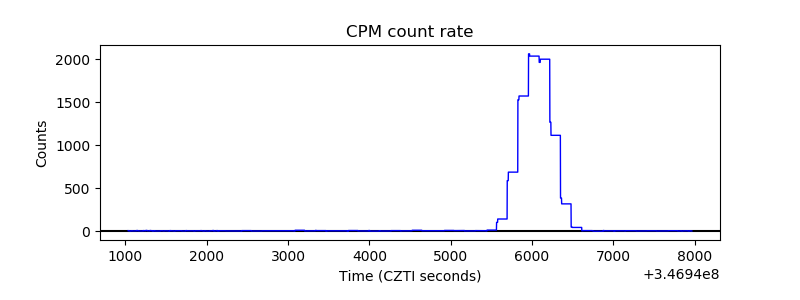 |
| CZT Counter | 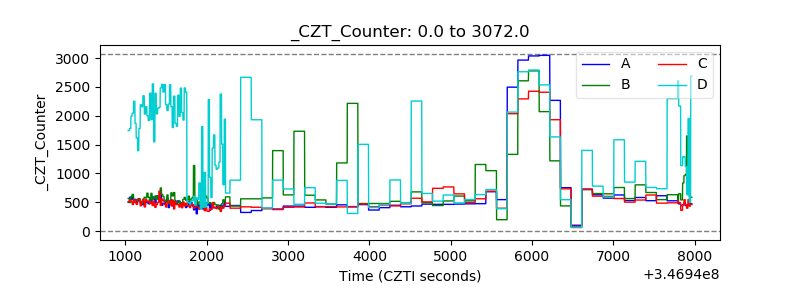 |
| +2.5 Volts monitor |  |
| +5 Volts monitor |  |
| _ROLL_ROT | 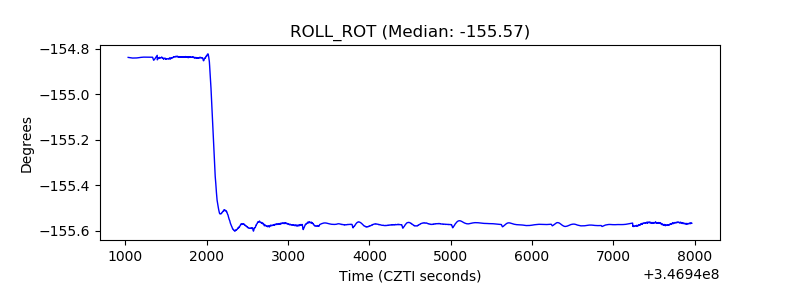 |
| _Roll_DEC | 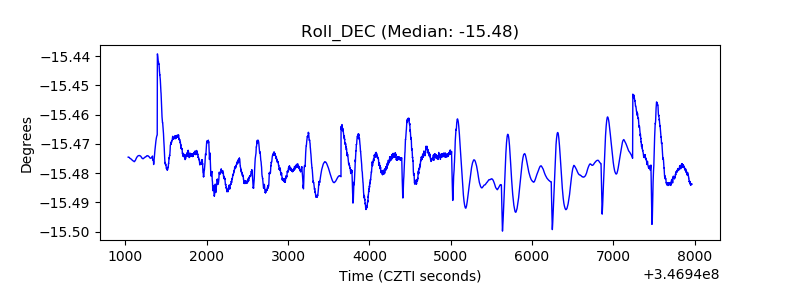 |
| _Roll_RA | 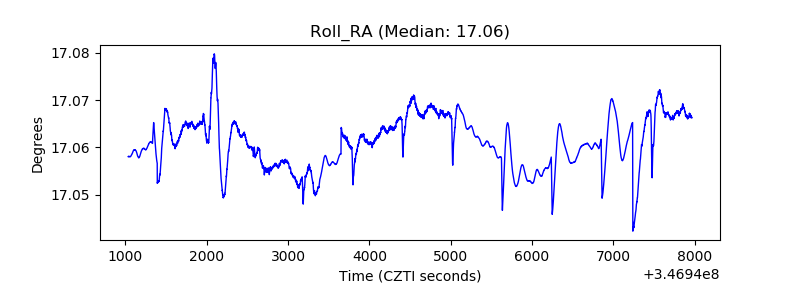 |
| Veto Counter | 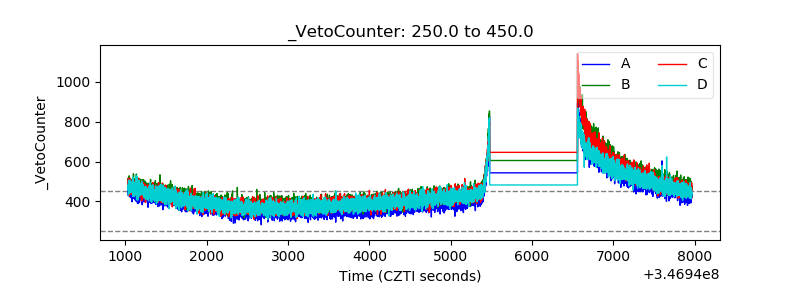 |