| Param | Original file | Final file |
|---|---|---|
| Filename | modeM0/AS1A10_058T13_9000004088_28412cztM0_level2.evt | modeM0/AS1A10_058T13_9000004088_28412cztM0_level2_quad_clean.evt |
| Size (bytes) | 529,485,120 | 97,885,440 |
| Size | 505.0 MB | 93.4 MB |
| Events in quadrant A | 3,212,733 | 657,330 |
| Events in quadrant B | 4,038,181 | 661,035 |
| Events in quadrant C | 3,238,405 | 619,452 |
| Events in quadrant D | 5,116,702 | 584,449 |
| Mode M0 | |||
|---|---|---|---|
| Quadrant | BADHDUFLAG | Total packets | Discarded packets |
| A | 0 | 13620 | 0 |
| B | 0 | 16181 | 0 |
| C | 0 | 13672 | 0 |
| D | 0 | 19493 | 0 |
| Mode M9 | |||
|---|---|---|---|
| Quadrant | BADHDUFLAG | Total packets | Discarded packets |
| A | 0 | 12 | 0 |
| B | 0 | 12 | 0 |
| C | 0 | 12 | 0 |
| D | 0 | 12 | 0 |
| Quadrant | Total seconds | Saturated seconds | Saturation percentage |
|---|---|---|---|
| A | 6339 | 55 | 0.867645% |
| B | 6340 | 136 | 2.145110% |
| C | 6340 | 82 | 1.293375% |
| D | 6339 | 393 | 6.199716% |
Noise dominated data is calculated using 1-second bins in cleaned event files. If a bin has >2000 counts, and if more than 50% of those come from <1% of pixels, then it is considered to be noise-dominated and hence unusable.
| Quadrant | # 1 sec bins | Bins with >0 counts | Bins with >2000 counts | High rate bins dominated by noise | Noise dominated (total time) | Noise dominated (detector-on time) | Marked lightcurve |
|---|---|---|---|---|---|---|---|
| A | 7534 | 6339 | 0 | 0 | 0.00% | 0.00% | 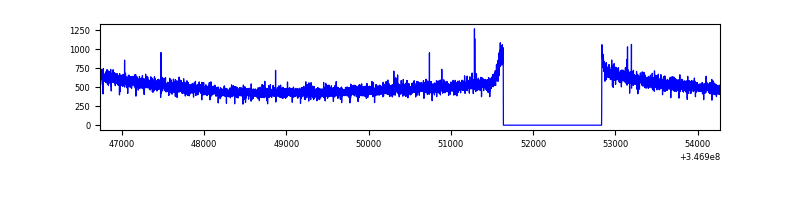 |
| B | 7535 | 6340 | 55 | 55 | 0.73% | 0.87% | 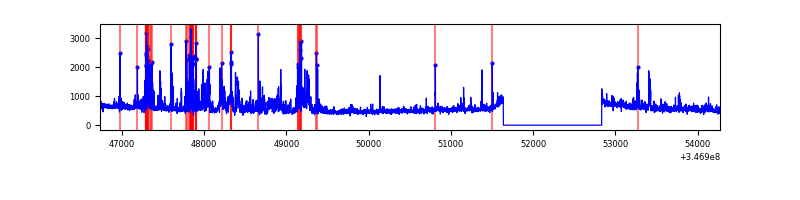 |
| C | 7535 | 6340 | 0 | 0 | 0.00% | 0.00% | 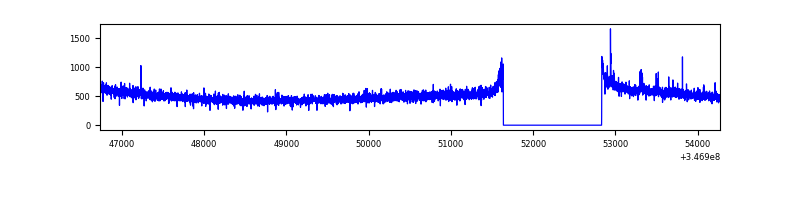 |
| D | 7534 | 6339 | 312 | 312 | 4.14% | 4.92% | 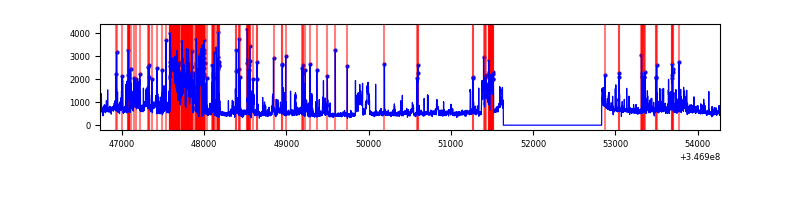 |
Top three noisy pixels from each quadrant. If the there are fewer than three noisy pixels in the level2.evt file, extra rows are filled as -1
| Pixel properties | Quadrant properties | ||||||
|---|---|---|---|---|---|---|---|
| Quadrant | DetID | PixID | Counts | Sigma | Mean | Median | Sigma |
| A | 13 | 254 | 9484 | 52.59 | 831 | 816 | 164.8 |
| A | 3 | 137 | 7751 | 42.07 | 831 | 816 | 164.8 |
| A | 0 | 226 | 7111 | 38.19 | 831 | 816 | 164.8 |
| B | 10 | 245 | 767502 | 4958.52 | 821 | 801 | 154.6 |
| B | 0 | 230 | 22248 | 138.71 | 821 | 801 | 154.6 |
| B | 0 | 190 | 22002 | 137.11 | 821 | 801 | 154.6 |
| C | 14 | 238 | 128049 | 700.03 | 781 | 787 | 181.8 |
| C | 1 | 16 | 36006 | 193.73 | 781 | 787 | 181.8 |
| C | 7 | 220 | 28355 | 151.64 | 781 | 787 | 181.8 |
| D | 1 | 52 | 1523314 | 8137.23 | 776 | 755 | 187.1 |
| D | 8 | 195 | 490058 | 2615.05 | 776 | 755 | 187.1 |
| D | 2 | 250 | 82548 | 437.14 | 776 | 755 | 187.1 |
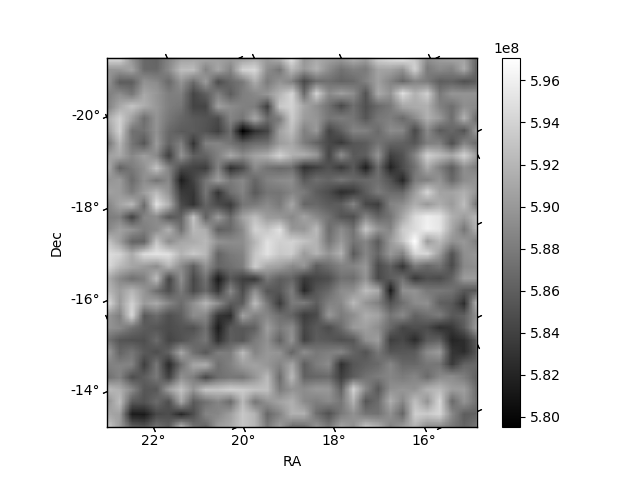
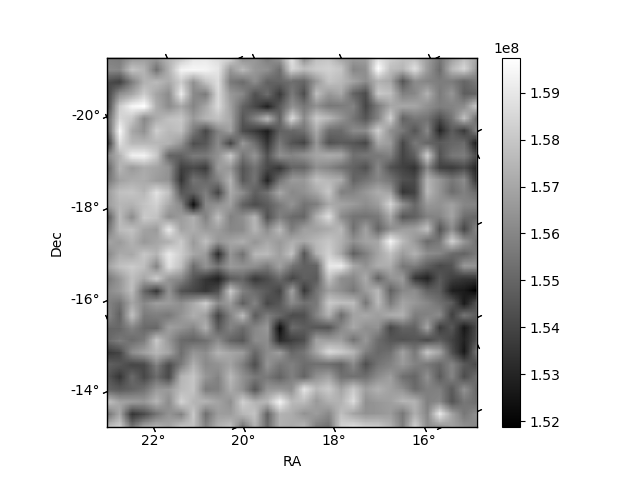
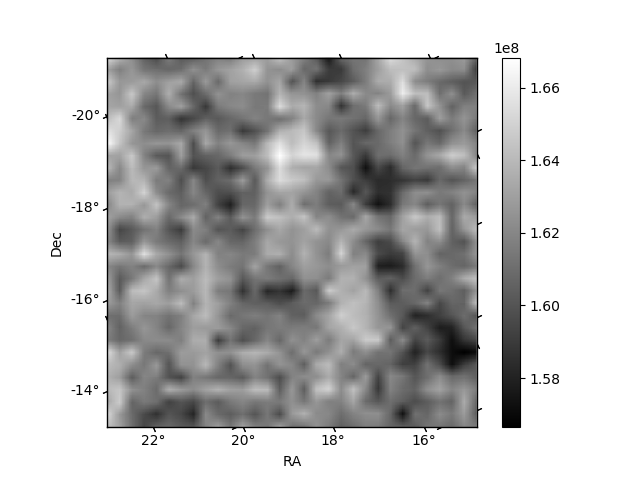
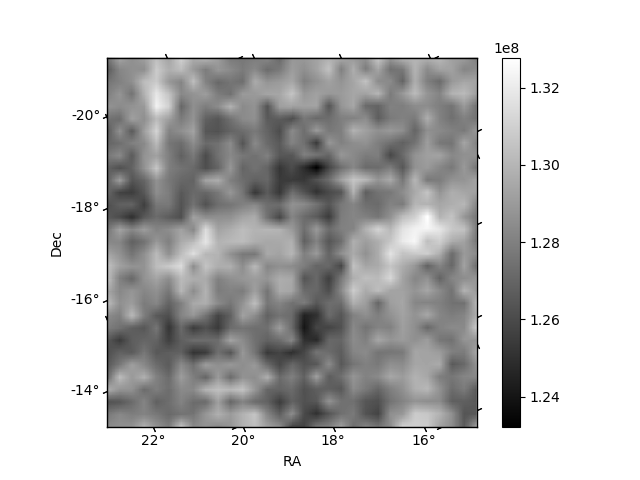
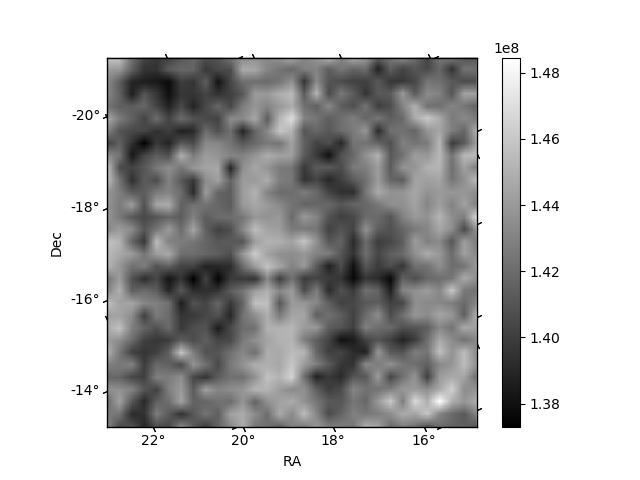
Histogram calculated using DETX and DETY for each event in the final _common_clean file
| Quadrant A | 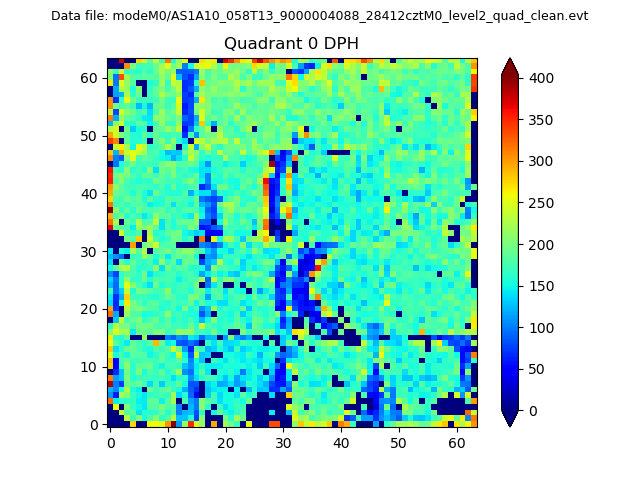 |
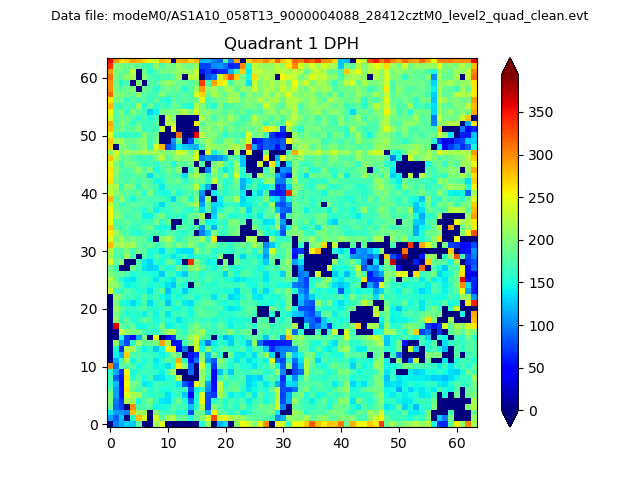 |
Quadrant B |
|---|---|---|---|
| Quadrant D | 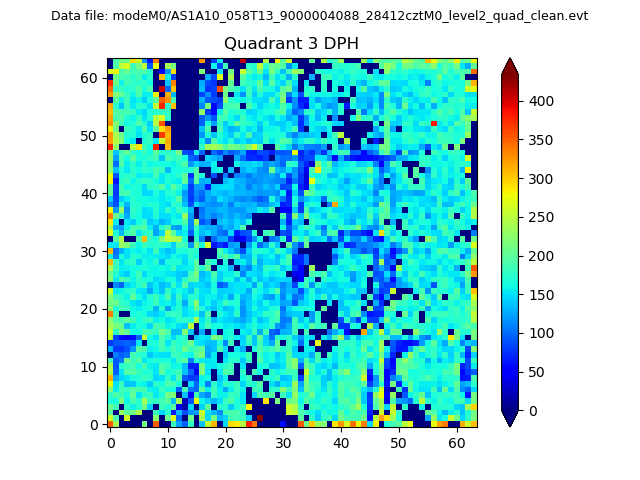 |
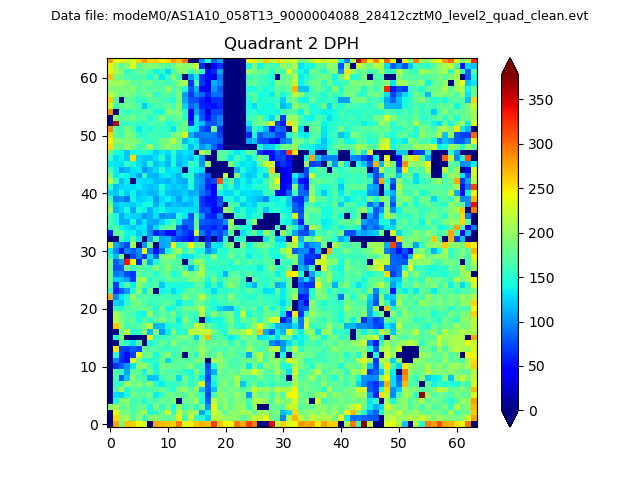 |
Quadrant C |
| Plot type | Count rate plots | Images |
|---|---|---|
| Comparison with Poisson distribution Blue bars denote a histogram of data divided into 1 sec bins. Red curve is a Poisson curve with rate = median count rate of data. |
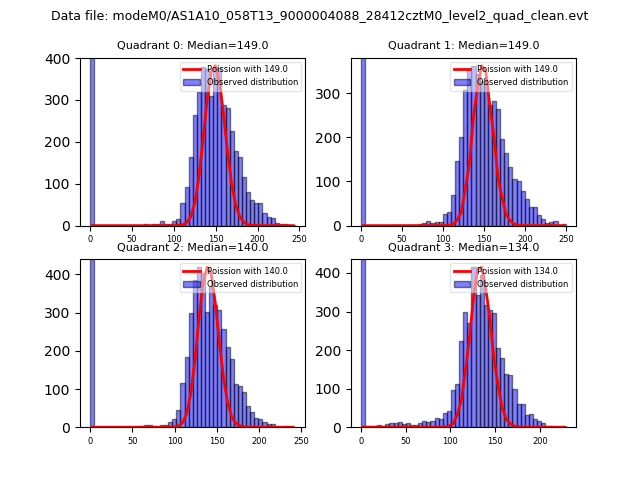 |
 |
| Quadrant-wise count rates Data is divided into 100 sec bins |
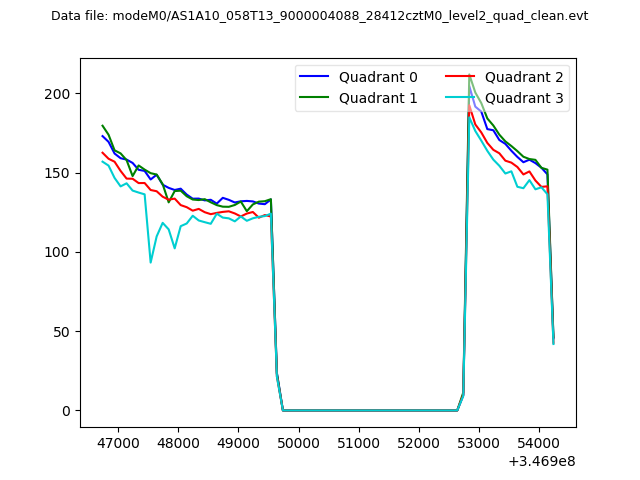 |
|
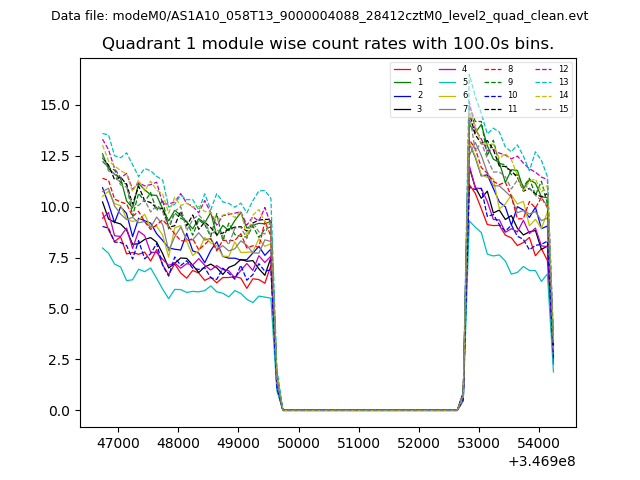
| Module-wise count rates for Quadrant A Data is divided into 100 sec bins |
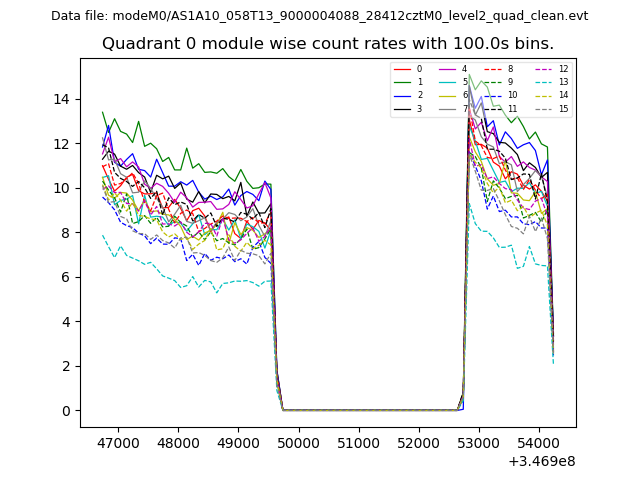 |
 |
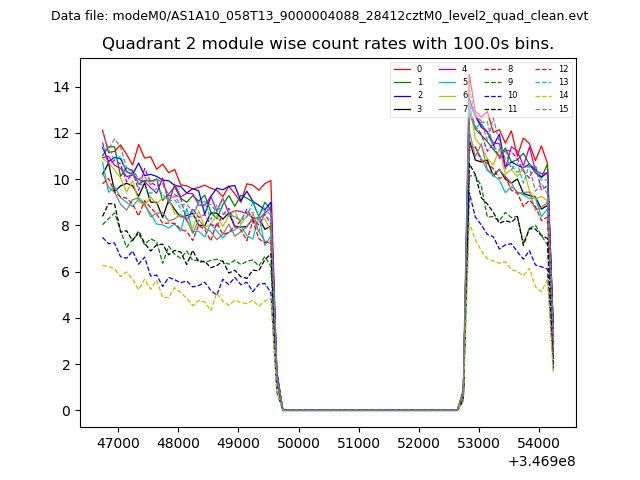
| Module-wise count rates for Quadrant B Data is divided into 100 sec bins |
 |
 |
| Module-wise count rates for Quadrant C Data is divided into 100 sec bins |
 |
 |
| Module-wise count rates for Quadrant D Data is divided into 100 sec bins |
 |
 |
| Parameter | Plot |
|---|---|
| CZT HV Monitor | 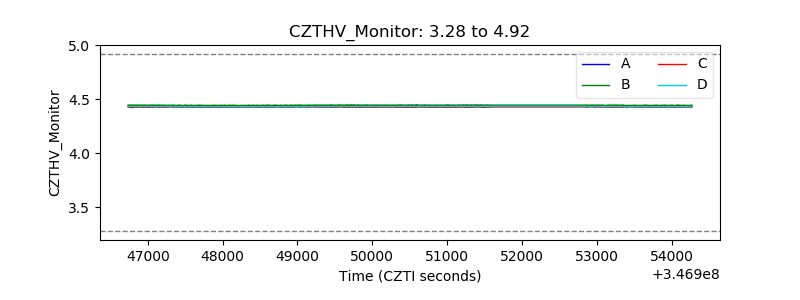 |
| D_VDD | 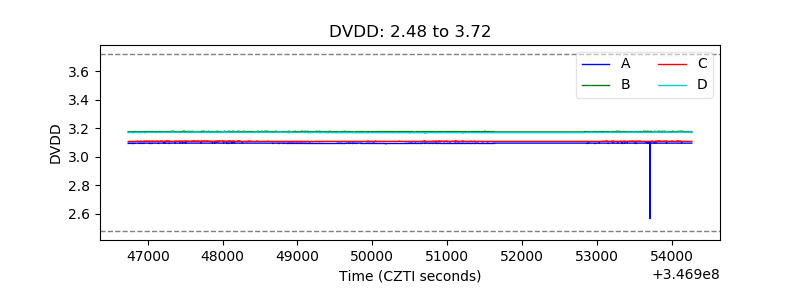 |
| Temperature 1 | 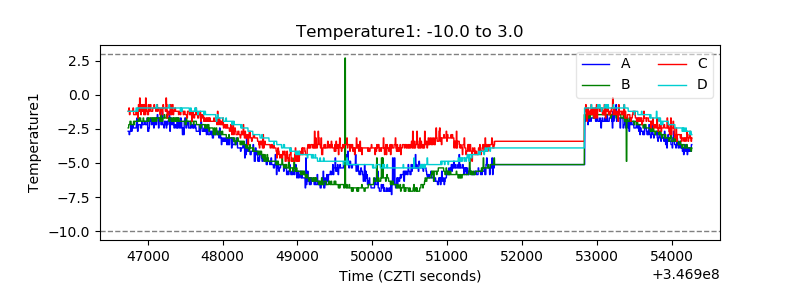 |
| Veto HV Monitor | 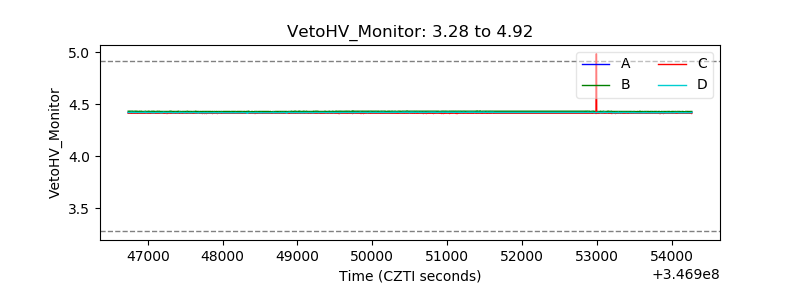 |
| Veto LLD | 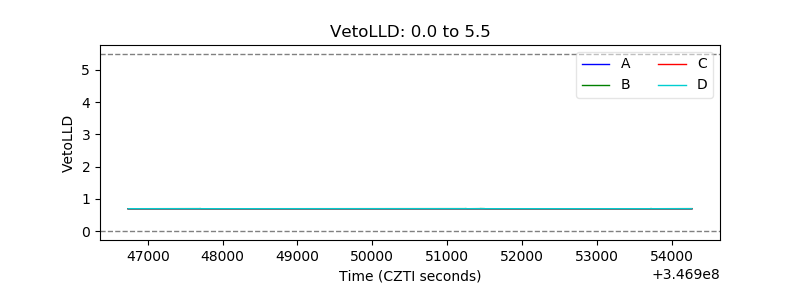 |
| Alpha Counter | 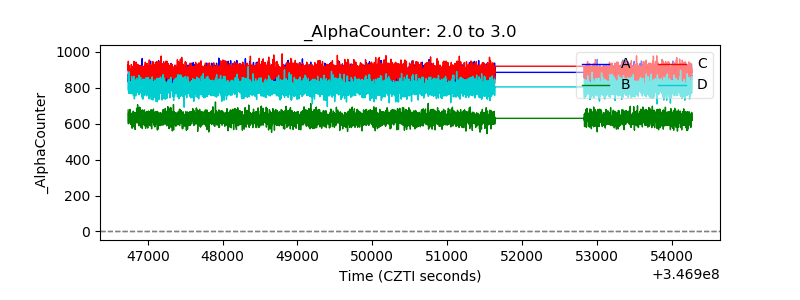 |
| _CPM_Rate | 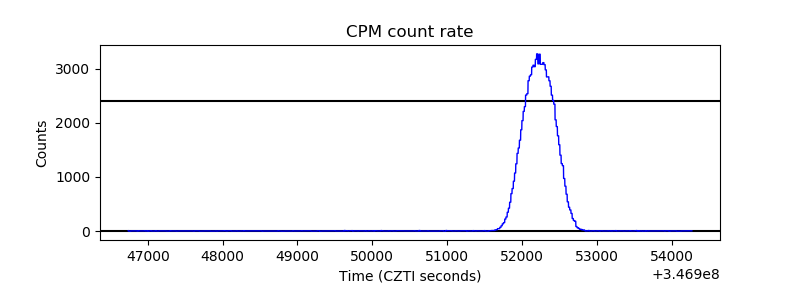 |
| CZT Counter | 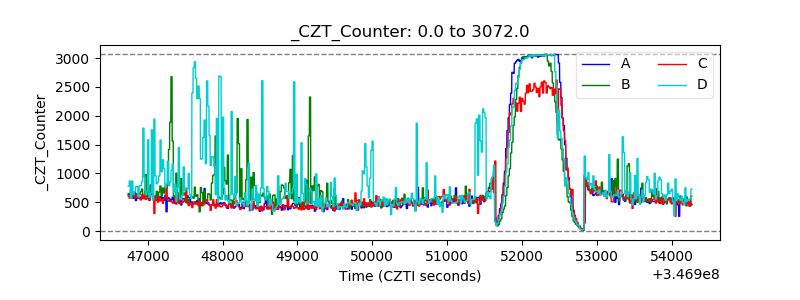 |
| +2.5 Volts monitor | 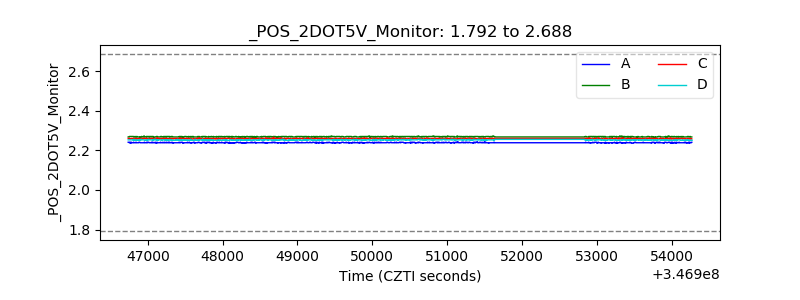 |
| +5 Volts monitor | 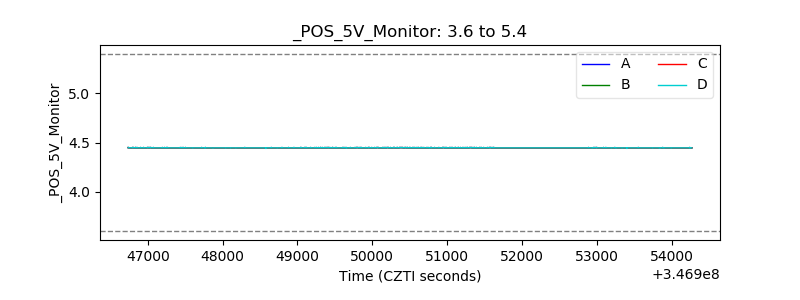 |
| _ROLL_ROT | 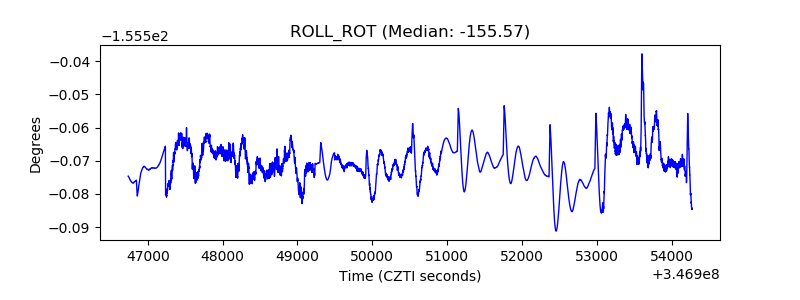 |
| _Roll_DEC | 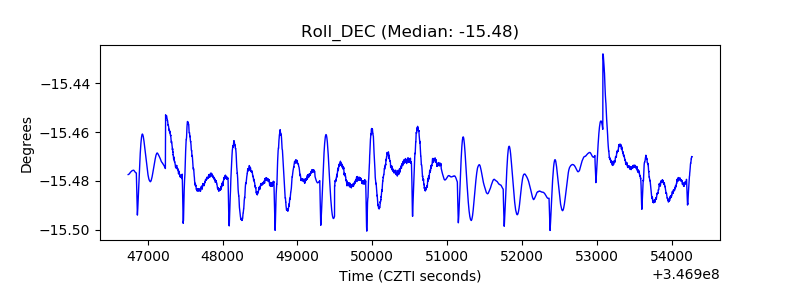 |
| _Roll_RA | 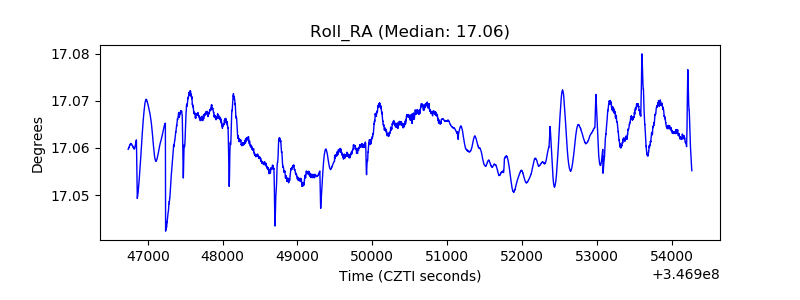 |
| Veto Counter | 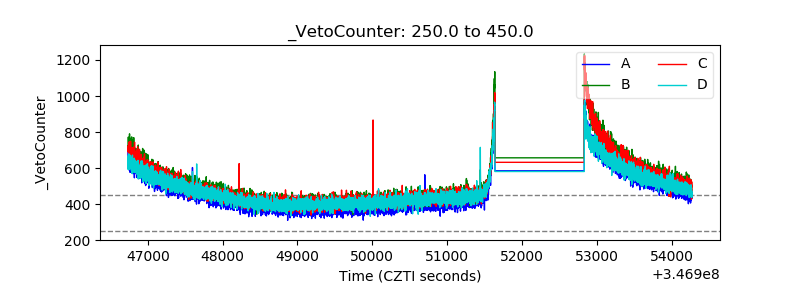 |