| Param | Original file | Final file |
|---|---|---|
| Filename | modeM0/AS1A10_058T13_9000004088_28413cztM0_level2.evt | modeM0/AS1A10_058T13_9000004088_28413cztM0_level2_quad_clean.evt |
| Size (bytes) | 515,517,120 | 98,110,080 |
| Size | 491.6 MB | 93.6 MB |
| Events in quadrant A | 3,312,701 | 652,381 |
| Events in quadrant B | 3,642,360 | 669,354 |
| Events in quadrant C | 3,365,461 | 618,555 |
| Events in quadrant D | 4,864,035 | 590,497 |
| Mode M0 | |||
|---|---|---|---|
| Quadrant | BADHDUFLAG | Total packets | Discarded packets |
| A | 0 | 13823 | 0 |
| B | 0 | 14763 | 0 |
| C | 0 | 13874 | 0 |
| D | 0 | 18684 | 0 |
| Mode M9 | |||
|---|---|---|---|
| Quadrant | BADHDUFLAG | Total packets | Discarded packets |
| A | 0 | 17 | 0 |
| B | 0 | 18 | 0 |
| C | 0 | 18 | 0 |
| D | 0 | 18 | 0 |
| Quadrant | Total seconds | Saturated seconds | Saturation percentage |
|---|---|---|---|
| A | 6312 | 77 | 1.219899% |
| B | 6312 | 135 | 2.138783% |
| C | 6312 | 95 | 1.505070% |
| D | 6312 | 188 | 2.978454% |
Noise dominated data is calculated using 1-second bins in cleaned event files. If a bin has >2000 counts, and if more than 50% of those come from <1% of pixels, then it is considered to be noise-dominated and hence unusable.
| Quadrant | # 1 sec bins | Bins with >0 counts | Bins with >2000 counts | High rate bins dominated by noise | Noise dominated (total time) | Noise dominated (detector-on time) | Marked lightcurve |
|---|---|---|---|---|---|---|---|
| A | 7592 | 6312 | 0 | 0 | 0.00% | 0.00% | 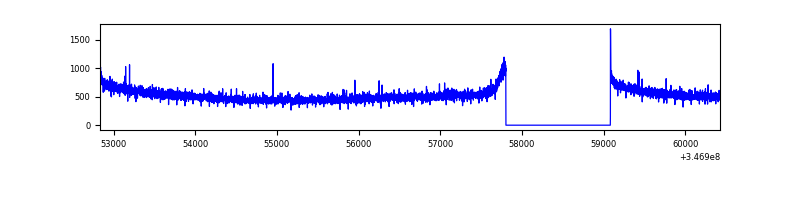 |
| B | 7592 | 6312 | 8 | 8 | 0.11% | 0.13% | 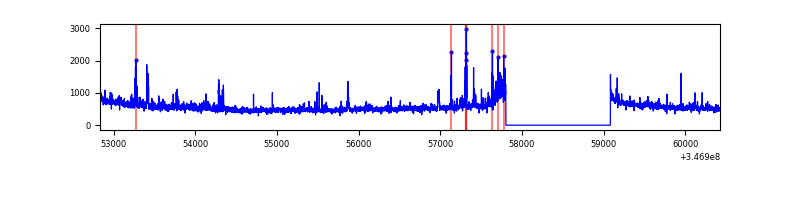 |
| C | 7592 | 6312 | 2 | 2 | 0.03% | 0.03% | 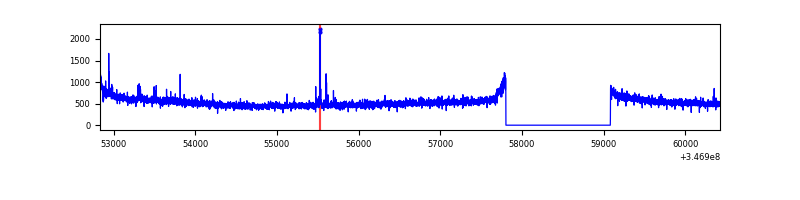 |
| D | 7592 | 6313 | 169 | 169 | 2.23% | 2.68% | 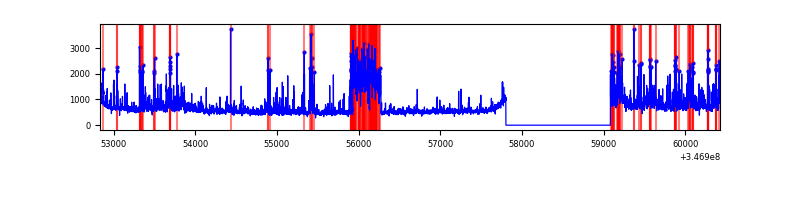 |
Top three noisy pixels from each quadrant. If the there are fewer than three noisy pixels in the level2.evt file, extra rows are filled as -1
| Pixel properties | Quadrant properties | ||||||
|---|---|---|---|---|---|---|---|
| Quadrant | DetID | PixID | Counts | Sigma | Mean | Median | Sigma |
| A | 13 | 254 | 9605 | 51.53 | 856 | 841 | 170.1 |
| A | 3 | 137 | 7937 | 41.72 | 856 | 841 | 170.1 |
| A | 0 | 226 | 7383 | 38.46 | 856 | 841 | 170.1 |
| B | 10 | 245 | 254599 | 1589.98 | 850 | 831 | 159.6 |
| B | 0 | 190 | 32248 | 196.84 | 850 | 831 | 159.6 |
| B | 0 | 230 | 18840 | 112.83 | 850 | 831 | 159.6 |
| C | 14 | 238 | 133636 | 703.94 | 809 | 815 | 188.7 |
| C | 7 | 220 | 41198 | 214.02 | 809 | 815 | 188.7 |
| C | 1 | 16 | 36771 | 190.56 | 809 | 815 | 188.7 |
| D | 1 | 52 | 912768 | 4761.57 | 806 | 784 | 191.5 |
| D | 8 | 195 | 720514 | 3757.79 | 806 | 784 | 191.5 |
| D | 2 | 250 | 86292 | 446.45 | 806 | 784 | 191.5 |
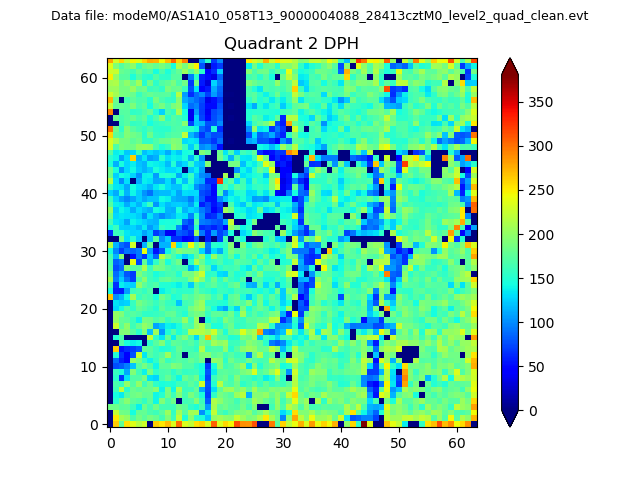
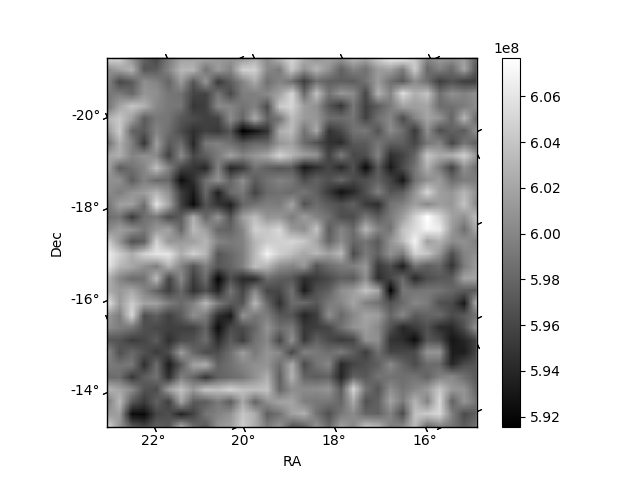
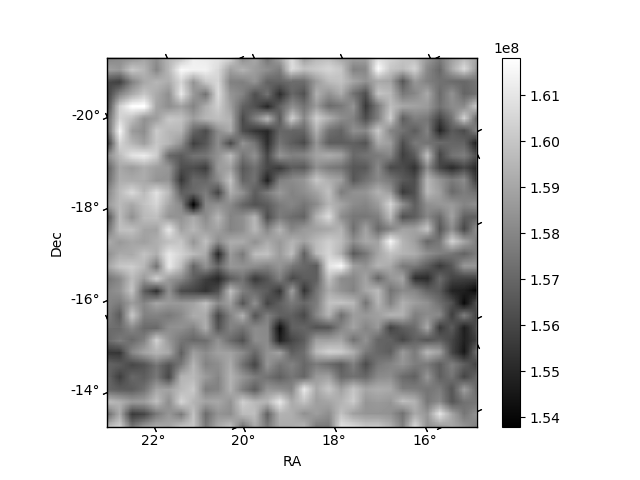
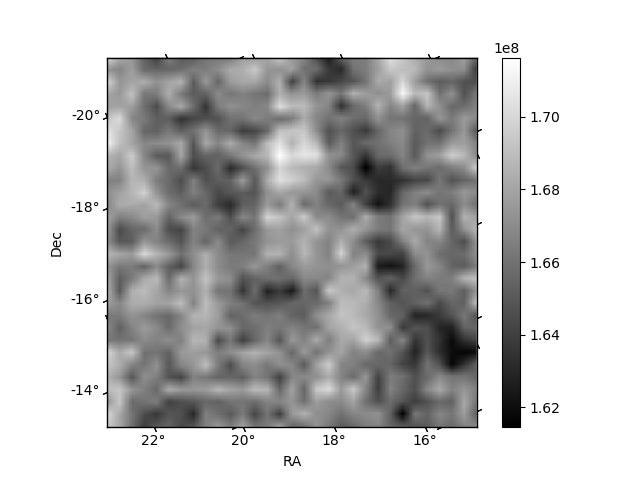
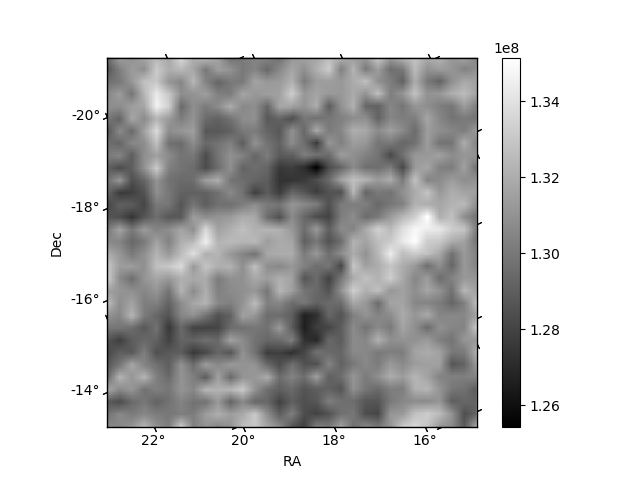
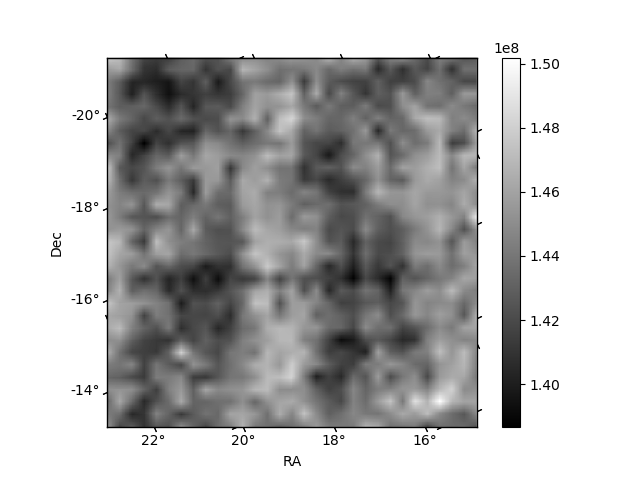
Histogram calculated using DETX and DETY for each event in the final _common_clean file
| Quadrant A | 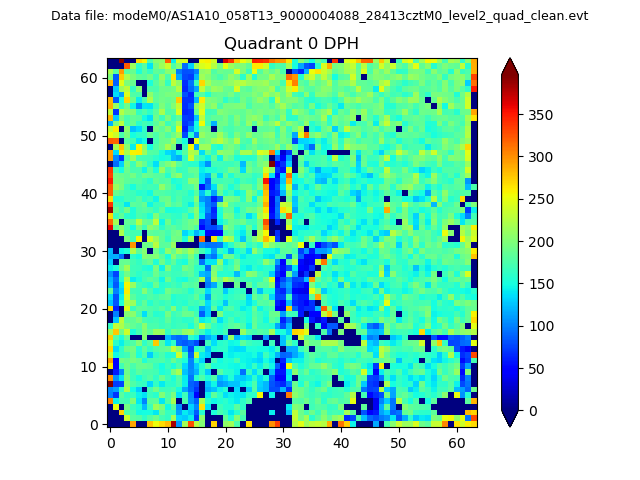 |
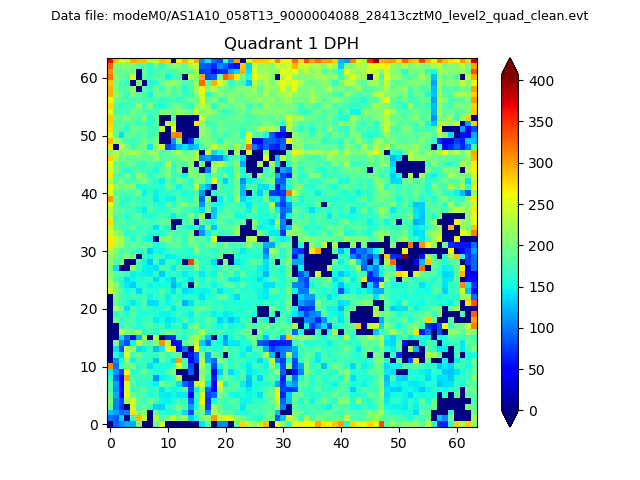 |
Quadrant B |
|---|---|---|---|
| Quadrant D | 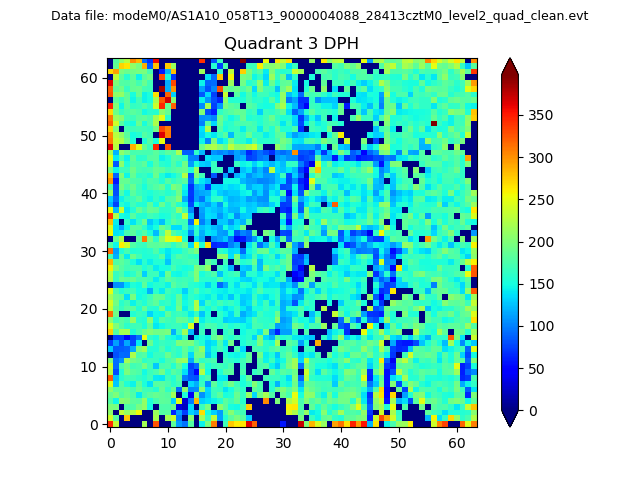 |
 |
Quadrant C |
| Plot type | Count rate plots | Images |
|---|---|---|
| Comparison with Poisson distribution Blue bars denote a histogram of data divided into 1 sec bins. Red curve is a Poisson curve with rate = median count rate of data. |
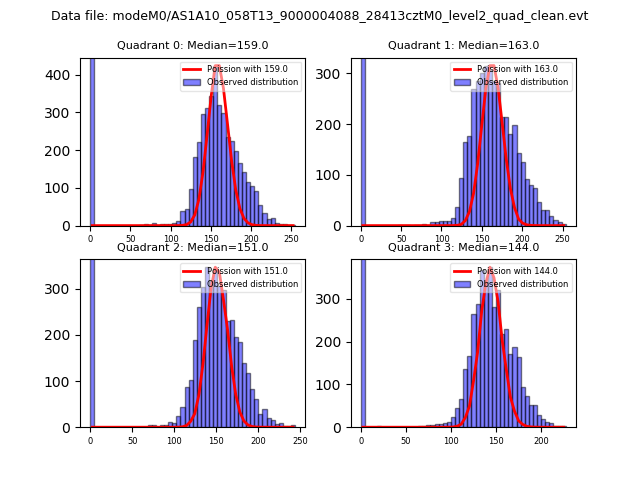 |
 |
| Quadrant-wise count rates Data is divided into 100 sec bins |
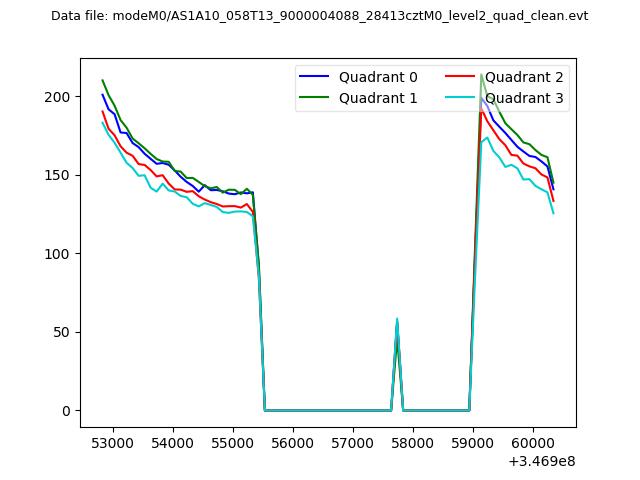 |
|
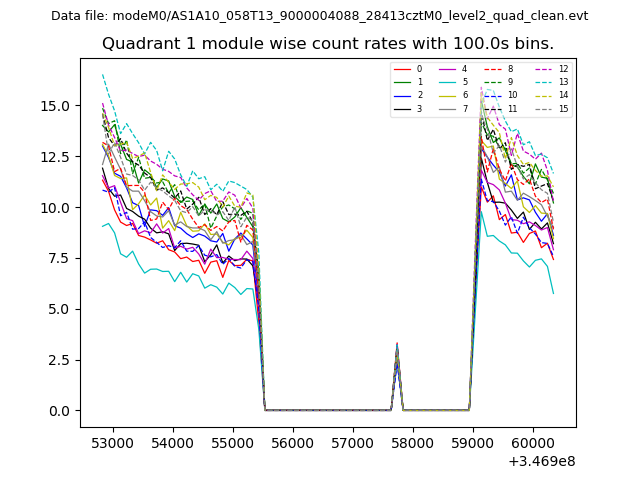
| Module-wise count rates for Quadrant A Data is divided into 100 sec bins |
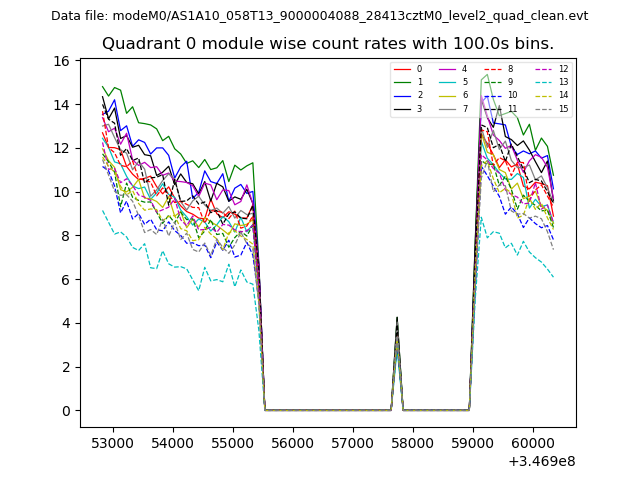 |
 |
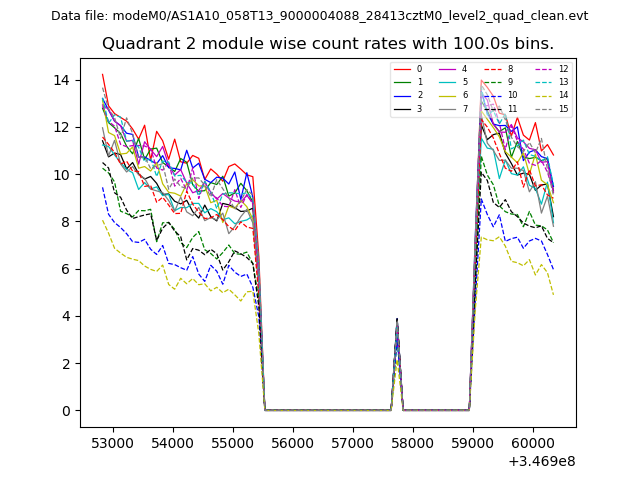
| Module-wise count rates for Quadrant B Data is divided into 100 sec bins |
 |
 |
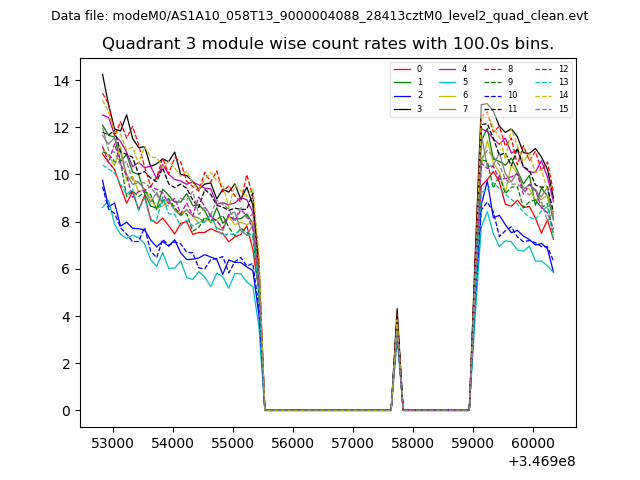
| Module-wise count rates for Quadrant C Data is divided into 100 sec bins |
 |
 |
| Module-wise count rates for Quadrant D Data is divided into 100 sec bins |
 |
 |
| Parameter | Plot |
|---|---|
| CZT HV Monitor | 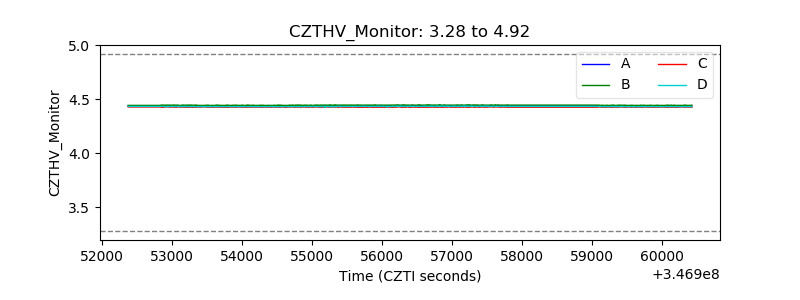 |
| D_VDD | 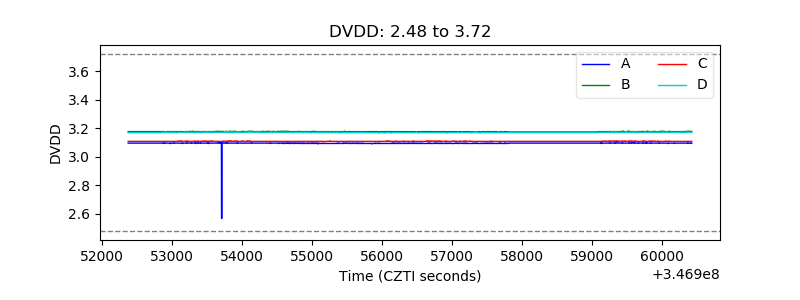 |
| Temperature 1 | 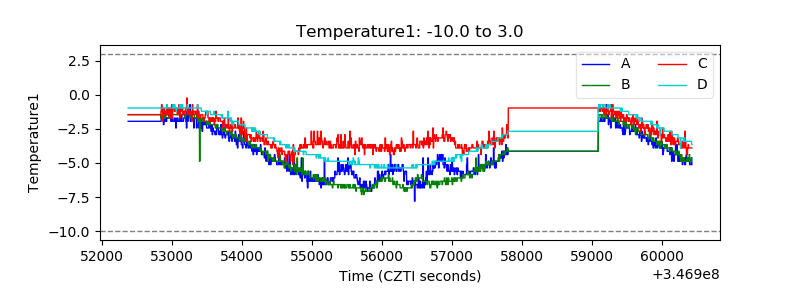 |
| Veto HV Monitor | 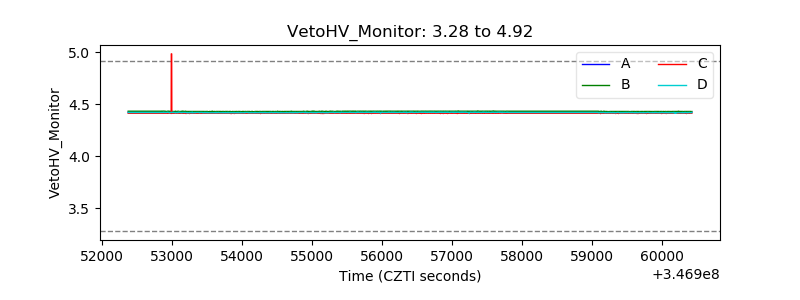 |
| Veto LLD | 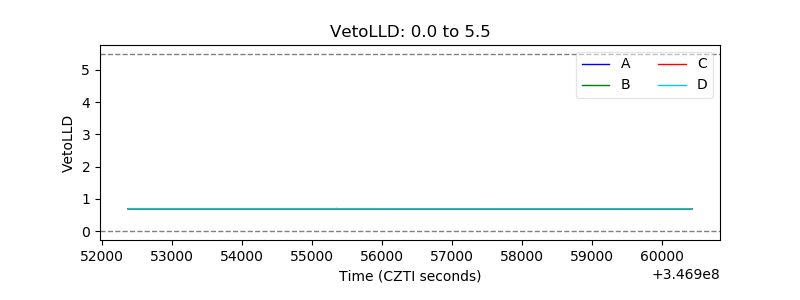 |
| Alpha Counter | 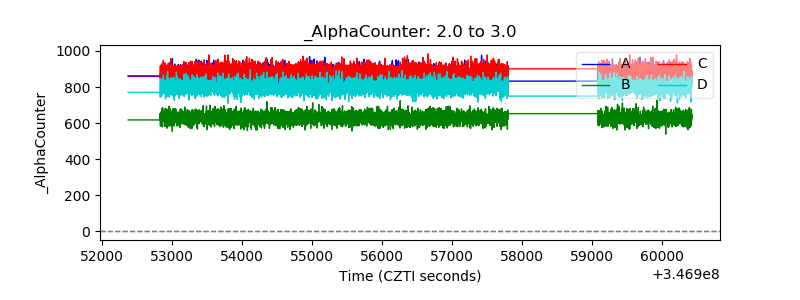 |
| _CPM_Rate | 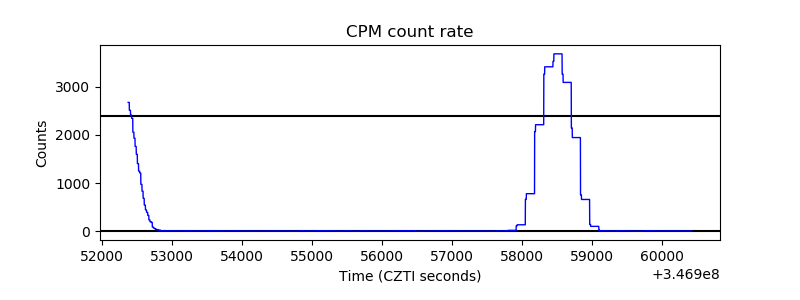 |
| CZT Counter | 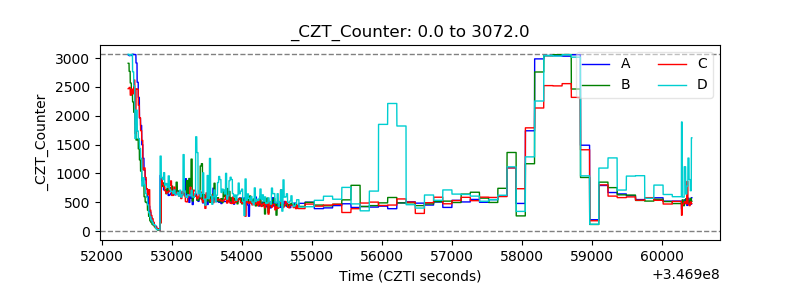 |
| +2.5 Volts monitor | 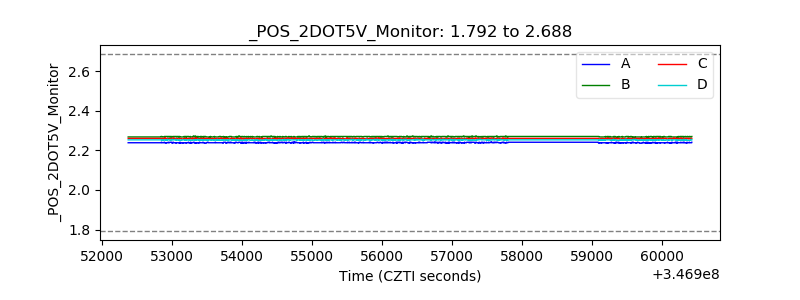 |
| +5 Volts monitor |  |
| _ROLL_ROT | 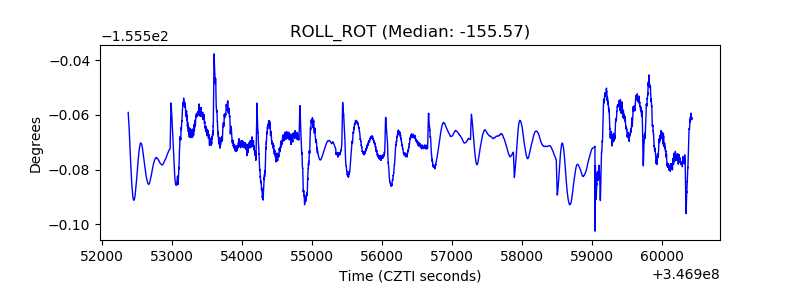 |
| _Roll_DEC | 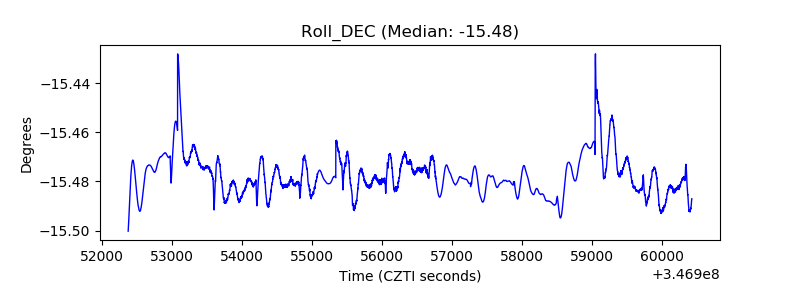 |
| _Roll_RA | 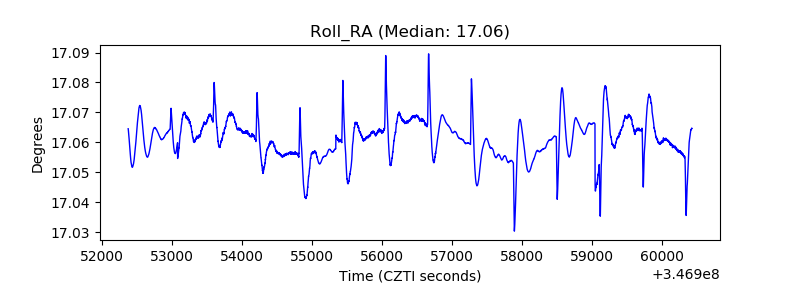 |
| Veto Counter | 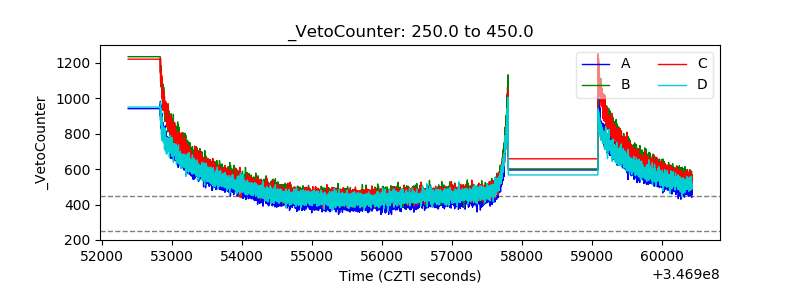 |