| Param | Original file | Final file |
|---|---|---|
| Filename | modeM0/AS1A10_058T13_9000004088_28414cztM0_level2.evt | modeM0/AS1A10_058T13_9000004088_28414cztM0_level2_quad_clean.evt |
| Size (bytes) | 499,593,600 | 95,613,120 |
| Size | 476.4 MB | 91.2 MB |
| Events in quadrant A | 3,248,244 | 632,726 |
| Events in quadrant B | 3,549,770 | 654,553 |
| Events in quadrant C | 3,243,627 | 607,469 |
| Events in quadrant D | 4,672,228 | 572,106 |
| Mode M0 | |||
|---|---|---|---|
| Quadrant | BADHDUFLAG | Total packets | Discarded packets |
| A | 0 | 13418 | 0 |
| B | 0 | 14367 | 0 |
| C | 0 | 13288 | 0 |
| D | 0 | 18036 | 0 |
| Mode M9 | |||
|---|---|---|---|
| Quadrant | BADHDUFLAG | Total packets | Discarded packets |
| A | 0 | 14 | 0 |
| B | 0 | 15 | 0 |
| C | 0 | 15 | 0 |
| D | 0 | 15 | 0 |
| Quadrant | Total seconds | Saturated seconds | Saturation percentage |
|---|---|---|---|
| A | 6143 | 87 | 1.416246% |
| B | 6143 | 134 | 2.181345% |
| C | 6143 | 110 | 1.790656% |
| D | 6143 | 189 | 3.076673% |
Noise dominated data is calculated using 1-second bins in cleaned event files. If a bin has >2000 counts, and if more than 50% of those come from <1% of pixels, then it is considered to be noise-dominated and hence unusable.
| Quadrant | # 1 sec bins | Bins with >0 counts | Bins with >2000 counts | High rate bins dominated by noise | Noise dominated (total time) | Noise dominated (detector-on time) | Marked lightcurve |
|---|---|---|---|---|---|---|---|
| A | 7483 | 6143 | 1 | 1 | 0.01% | 0.02% | 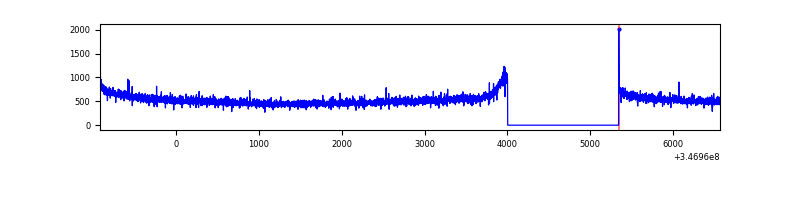 |
| B | 7483 | 6143 | 13 | 13 | 0.17% | 0.21% | 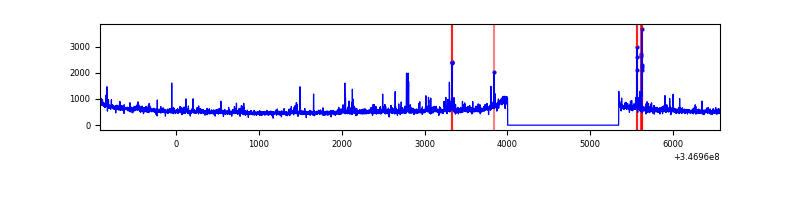 |
| C | 7483 | 6143 | 0 | 0 | 0.00% | 0.00% | 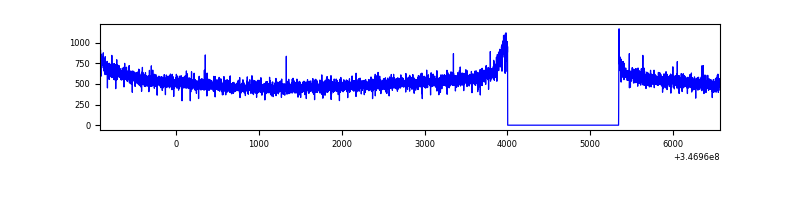 |
| D | 7483 | 6144 | 154 | 154 | 2.06% | 2.51% | 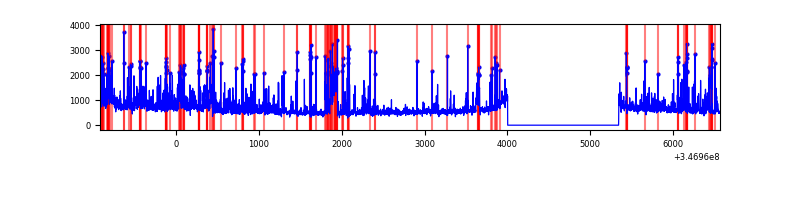 |
Top three noisy pixels from each quadrant. If the there are fewer than three noisy pixels in the level2.evt file, extra rows are filled as -1
| Pixel properties | Quadrant properties | ||||||
|---|---|---|---|---|---|---|---|
| Quadrant | DetID | PixID | Counts | Sigma | Mean | Median | Sigma |
| A | 6 | 16 | 15568 | 88.42 | 835 | 820 | 166.8 |
| A | 13 | 254 | 9876 | 54.29 | 835 | 820 | 166.8 |
| A | 8 | 192 | 8957 | 48.78 | 835 | 820 | 166.8 |
| B | 10 | 245 | 161216 | 1024.39 | 838 | 818 | 156.6 |
| B | 0 | 190 | 38061 | 237.85 | 838 | 818 | 156.6 |
| B | 10 | 246 | 37911 | 236.9 | 838 | 818 | 156.6 |
| C | 14 | 238 | 132058 | 702.73 | 797 | 805 | 186.8 |
| C | 13 | 61 | 5483 | 25.05 | 797 | 805 | 186.8 |
| C | 0 | 10 | 4093 | 17.6 | 797 | 805 | 186.8 |
| D | 1 | 52 | 1146604 | 6053.57 | 789 | 770 | 189.3 |
| D | 8 | 195 | 446517 | 2354.93 | 789 | 770 | 189.3 |
| D | 2 | 250 | 51032 | 265.54 | 789 | 770 | 189.3 |
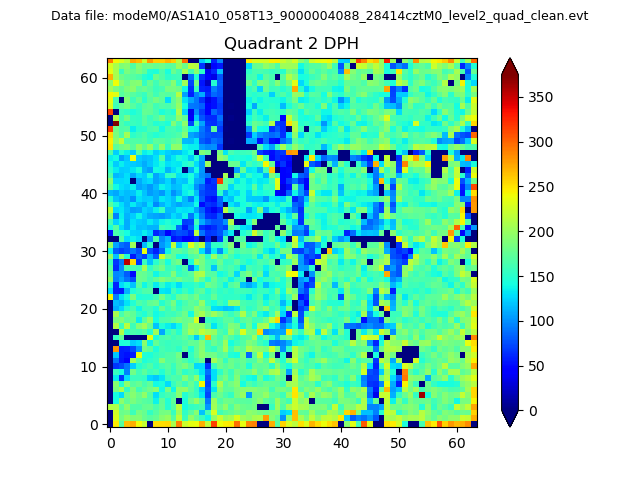
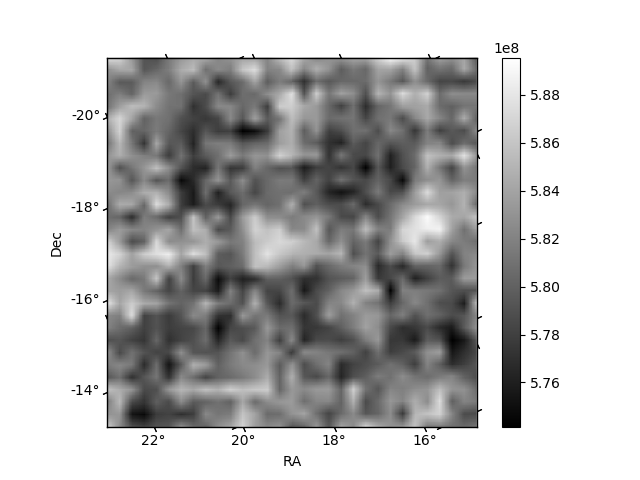
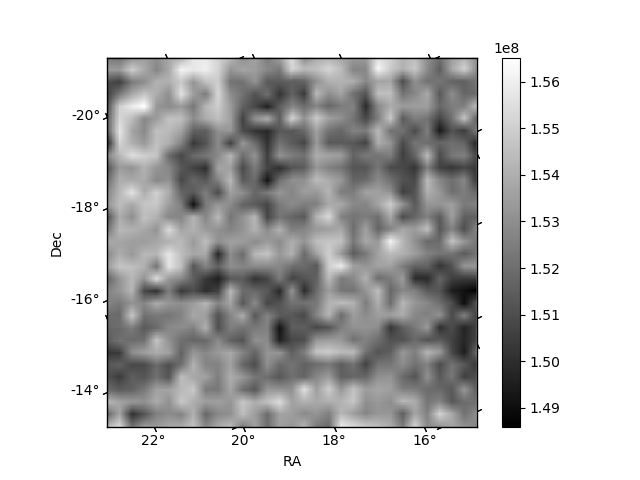
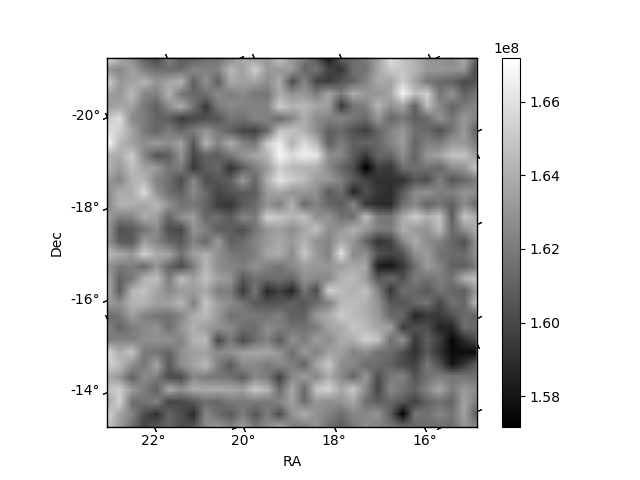
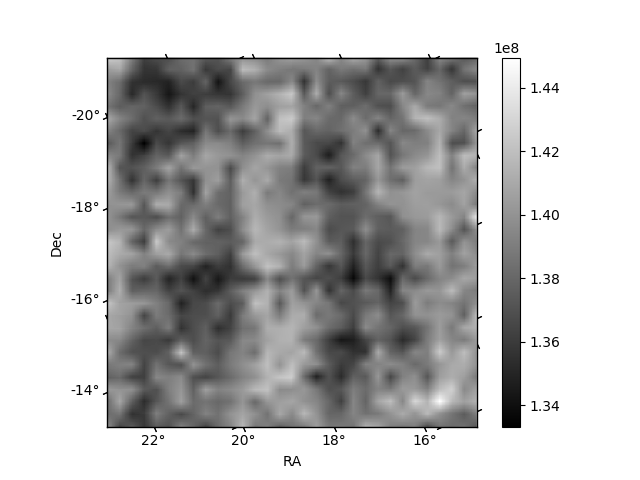
Histogram calculated using DETX and DETY for each event in the final _common_clean file
| Quadrant A | 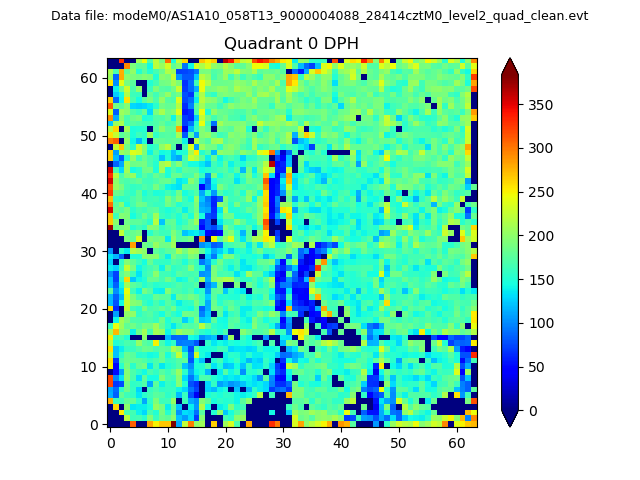 |
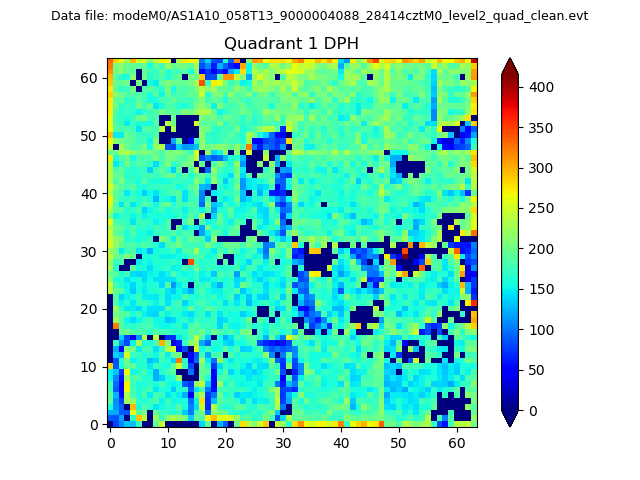 |
Quadrant B |
|---|---|---|---|
| Quadrant D | 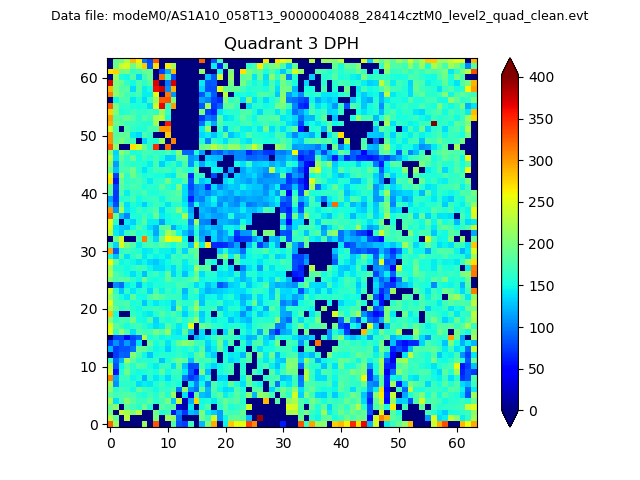 |
 |
Quadrant C |
| Plot type | Count rate plots | Images |
|---|---|---|
| Comparison with Poisson distribution Blue bars denote a histogram of data divided into 1 sec bins. Red curve is a Poisson curve with rate = median count rate of data. |
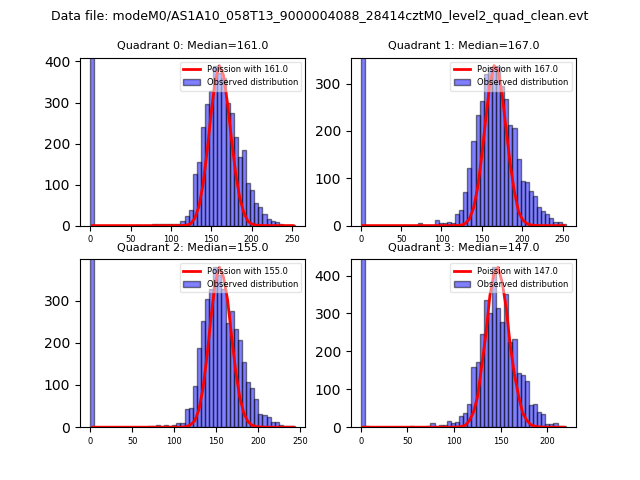 |
 |
| Quadrant-wise count rates Data is divided into 100 sec bins |
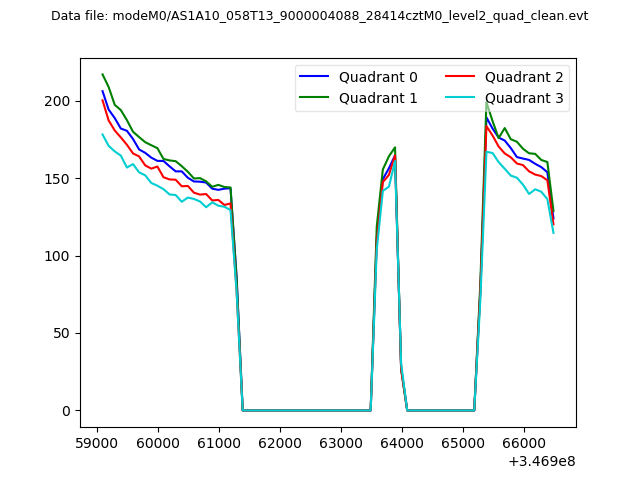 |
|
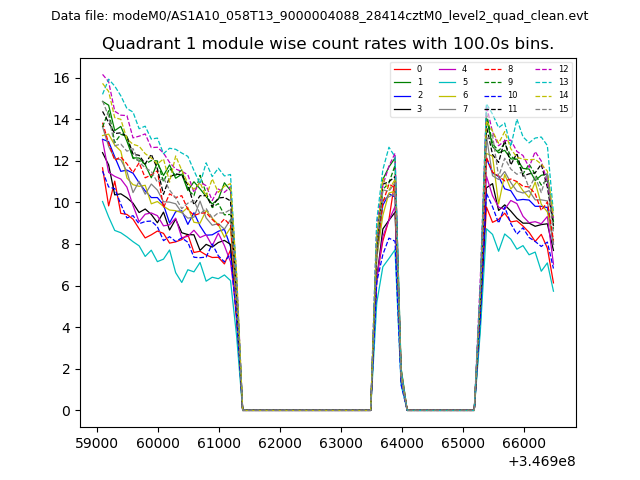
| Module-wise count rates for Quadrant A Data is divided into 100 sec bins |
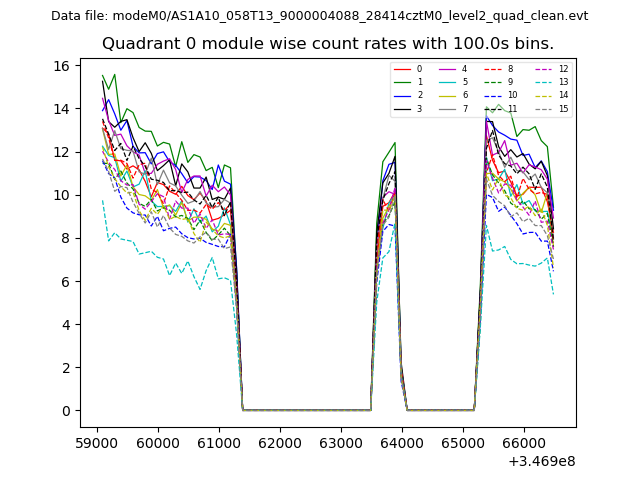 |
 |
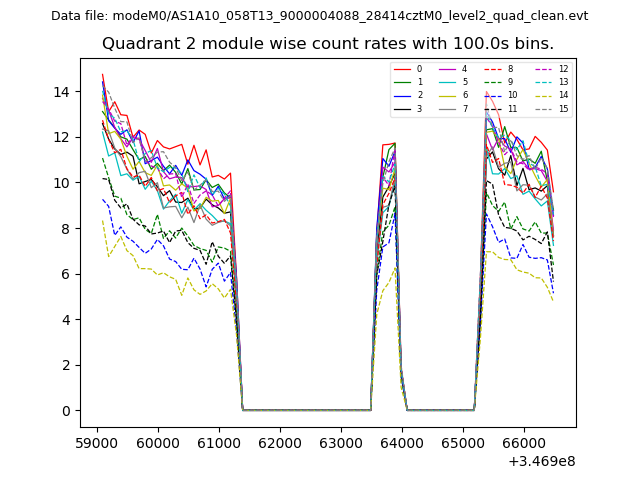
| Module-wise count rates for Quadrant B Data is divided into 100 sec bins |
 |
 |
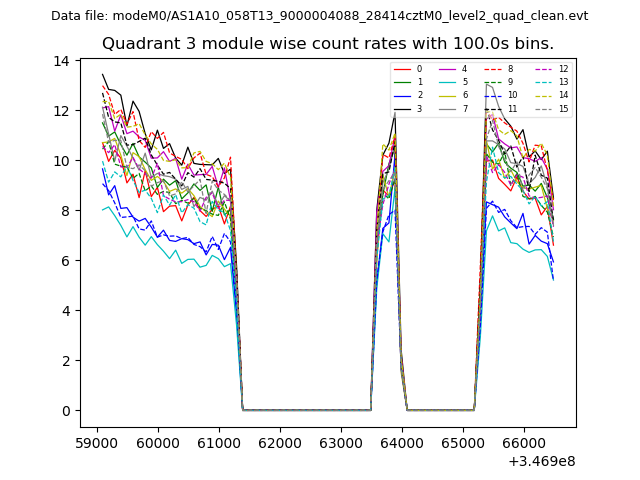
| Module-wise count rates for Quadrant C Data is divided into 100 sec bins |
 |
 |
| Module-wise count rates for Quadrant D Data is divided into 100 sec bins |
 |
 |
| Parameter | Plot |
|---|---|
| CZT HV Monitor | 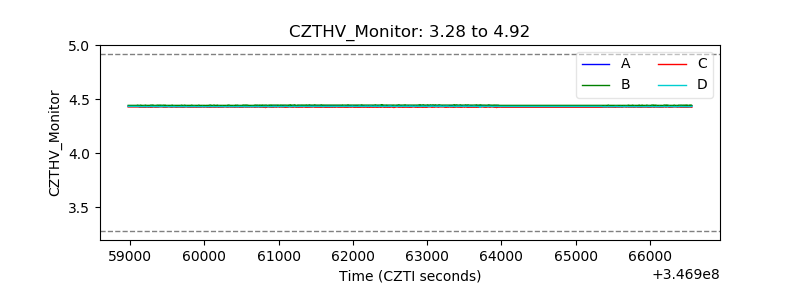 |
| D_VDD | 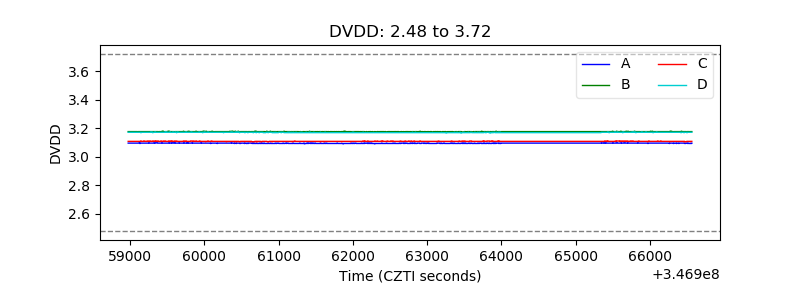 |
| Temperature 1 | 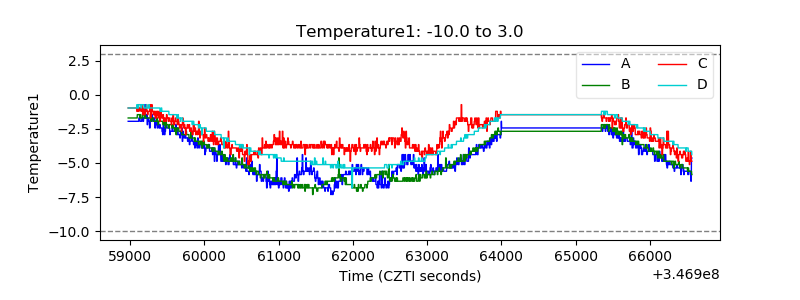 |
| Veto HV Monitor | 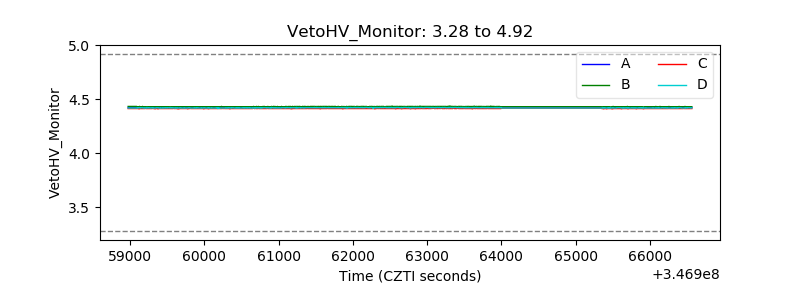 |
| Veto LLD | 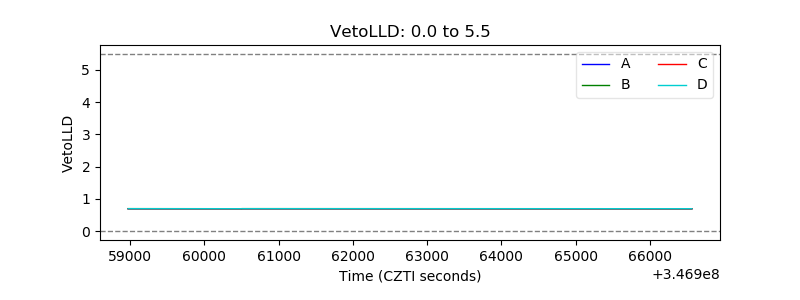 |
| Alpha Counter | 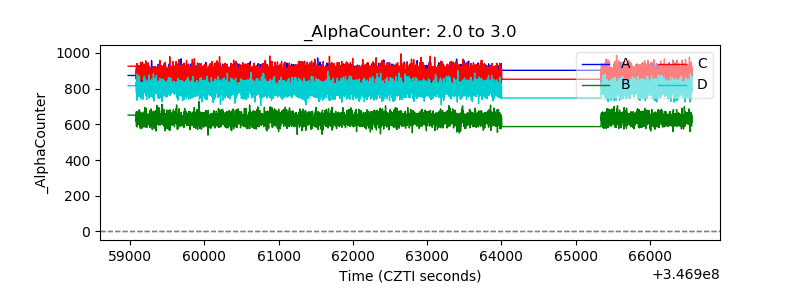 |
| _CPM_Rate | 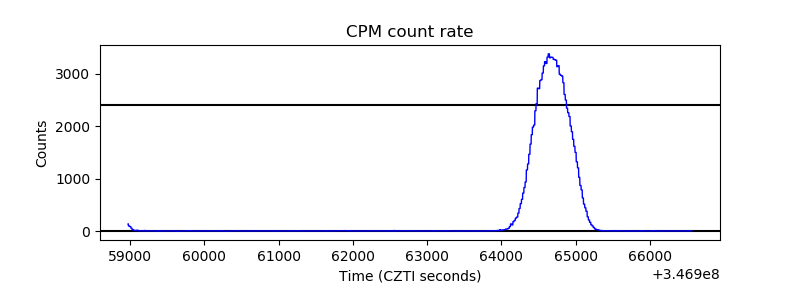 |
| CZT Counter | 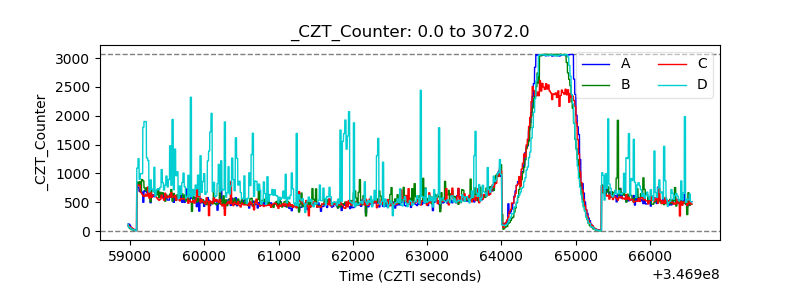 |
| +2.5 Volts monitor |  |
| +5 Volts monitor | 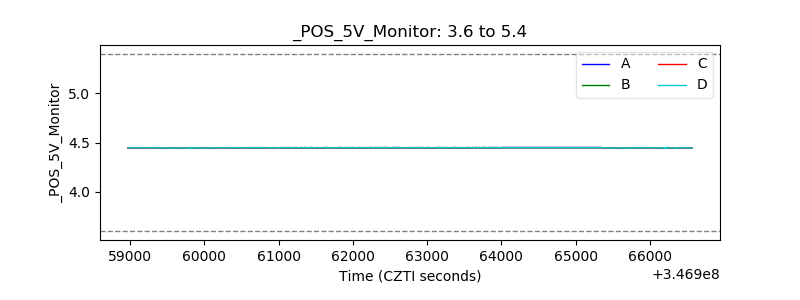 |
| _ROLL_ROT | 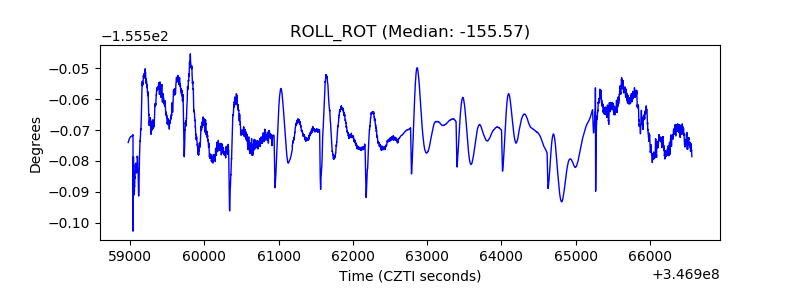 |
| _Roll_DEC | 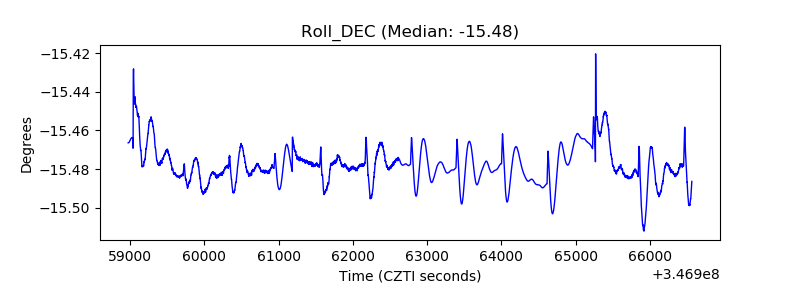 |
| _Roll_RA | 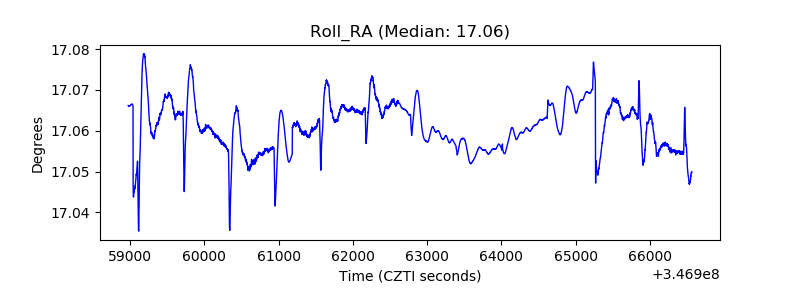 |
| Veto Counter | 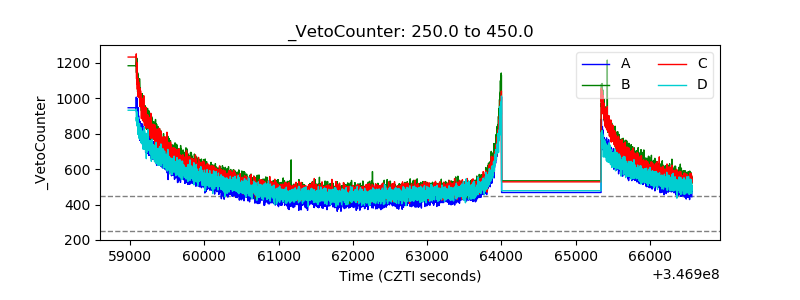 |