| Param | Original file | Final file |
|---|---|---|
| Filename | modeM0/AS1A10_058T13_9000004088_28415cztM0_level2.evt | modeM0/AS1A10_058T13_9000004088_28415cztM0_level2_quad_clean.evt |
| Size (bytes) | 502,816,320 | 94,092,480 |
| Size | 479.5 MB | 89.7 MB |
| Events in quadrant A | 3,272,414 | 616,407 |
| Events in quadrant B | 3,505,043 | 640,078 |
| Events in quadrant C | 3,264,615 | 599,665 |
| Events in quadrant D | 4,763,986 | 559,157 |
| Mode M0 | |||
|---|---|---|---|
| Quadrant | BADHDUFLAG | Total packets | Discarded packets |
| A | 0 | 13458 | 0 |
| B | 0 | 14204 | 0 |
| C | 0 | 13353 | 0 |
| D | 0 | 18326 | 0 |
| Mode M9 | |||
|---|---|---|---|
| Quadrant | BADHDUFLAG | Total packets | Discarded packets |
| A | 0 | 23 | 0 |
| B | 0 | 24 | 0 |
| C | 0 | 24 | 0 |
| D | 0 | 24 | 0 |
| Quadrant | Total seconds | Saturated seconds | Saturation percentage |
|---|---|---|---|
| A | 6222 | 87 | 1.398264% |
| B | 6221 | 112 | 1.800354% |
| C | 6221 | 96 | 1.543160% |
| D | 6221 | 305 | 4.902749% |
Noise dominated data is calculated using 1-second bins in cleaned event files. If a bin has >2000 counts, and if more than 50% of those come from <1% of pixels, then it is considered to be noise-dominated and hence unusable.
| Quadrant | # 1 sec bins | Bins with >0 counts | Bins with >2000 counts | High rate bins dominated by noise | Noise dominated (total time) | Noise dominated (detector-on time) | Marked lightcurve |
|---|---|---|---|---|---|---|---|
| A | 7547 | 6222 | 18 | 18 | 0.24% | 0.29% | 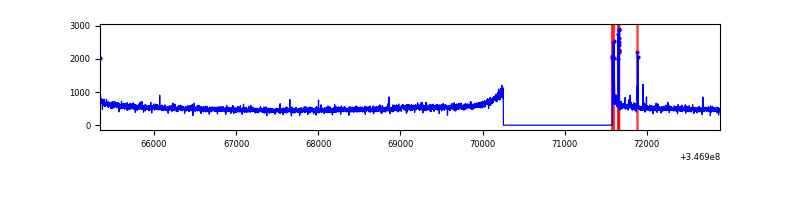 |
| B | 7546 | 6221 | 17 | 17 | 0.23% | 0.27% | 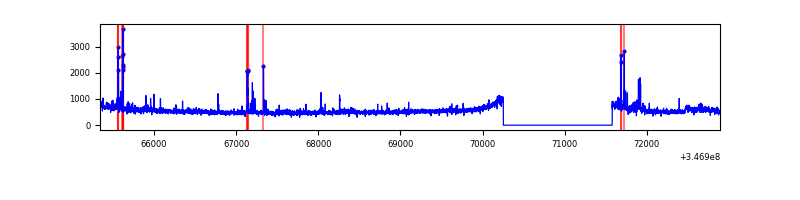 |
| C | 7546 | 6222 | 0 | 0 | 0.00% | 0.00% | 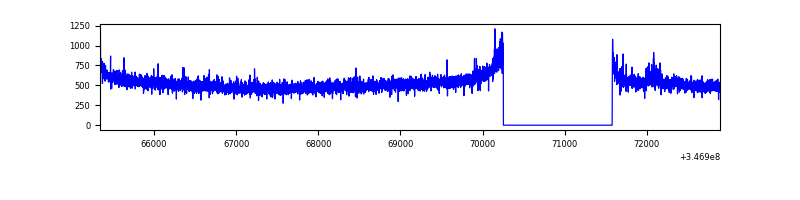 |
| D | 7546 | 6222 | 304 | 304 | 4.03% | 4.89% | 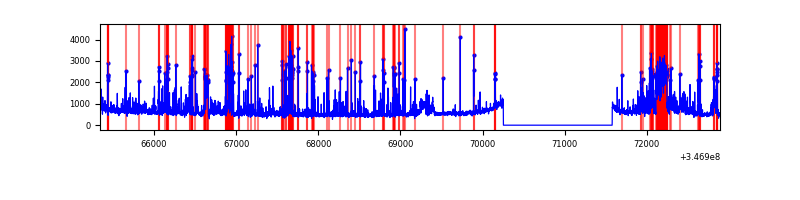 |
Top three noisy pixels from each quadrant. If the there are fewer than three noisy pixels in the level2.evt file, extra rows are filled as -1
| Pixel properties | Quadrant properties | ||||||
|---|---|---|---|---|---|---|---|
| Quadrant | DetID | PixID | Counts | Sigma | Mean | Median | Sigma |
| A | 4 | 2 | 59066 | 352.95 | 825 | 810 | 165.1 |
| A | 6 | 16 | 17359 | 100.26 | 825 | 810 | 165.1 |
| A | 8 | 192 | 10748 | 60.21 | 825 | 810 | 165.1 |
| B | 10 | 245 | 113953 | 725.11 | 831 | 813 | 156.0 |
| B | 10 | 246 | 46500 | 292.81 | 831 | 813 | 156.0 |
| B | 0 | 190 | 28240 | 175.78 | 831 | 813 | 156.0 |
| C | 14 | 238 | 130342 | 701.68 | 794 | 802 | 184.6 |
| C | 1 | 16 | 28622 | 150.69 | 794 | 802 | 184.6 |
| C | 7 | 220 | 9055 | 44.7 | 794 | 802 | 184.6 |
| D | 1 | 52 | 1230089 | 6662.33 | 775 | 755 | 184.5 |
| D | 8 | 195 | 479195 | 2592.89 | 775 | 755 | 184.5 |
| D | 2 | 250 | 86649 | 465.5 | 775 | 755 | 184.5 |
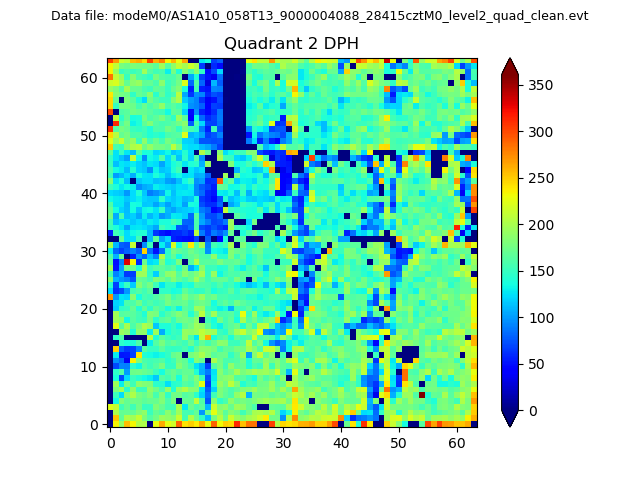
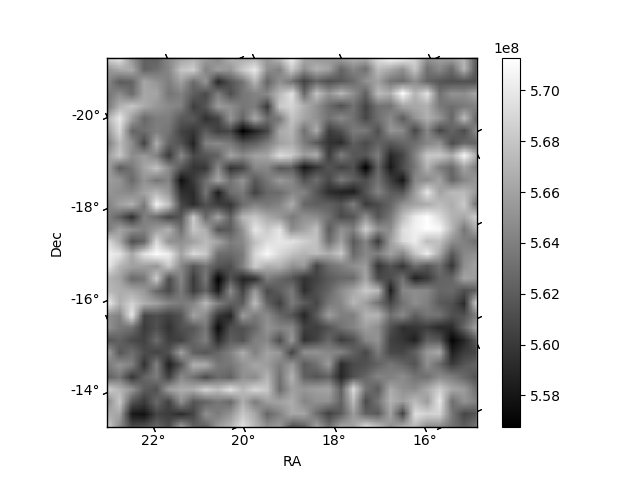
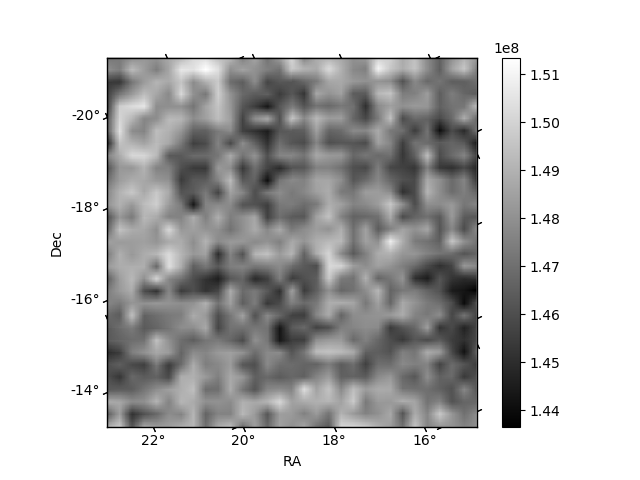
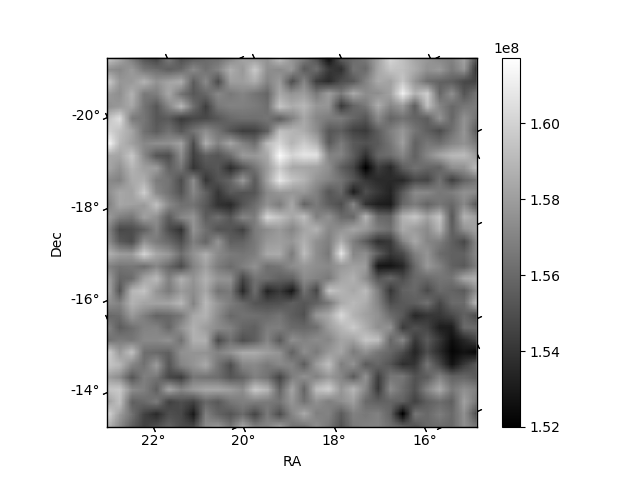
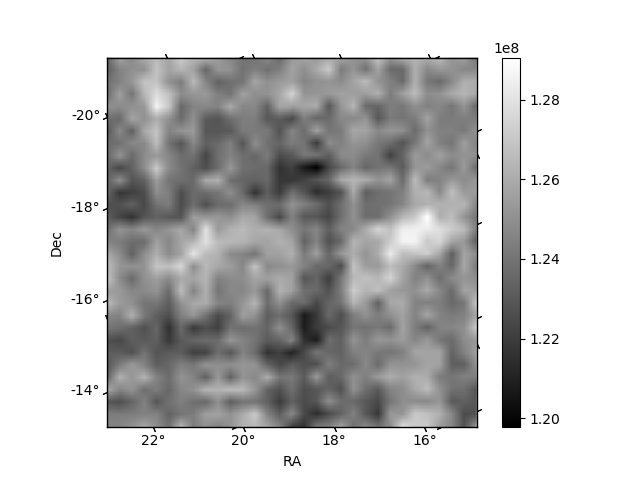
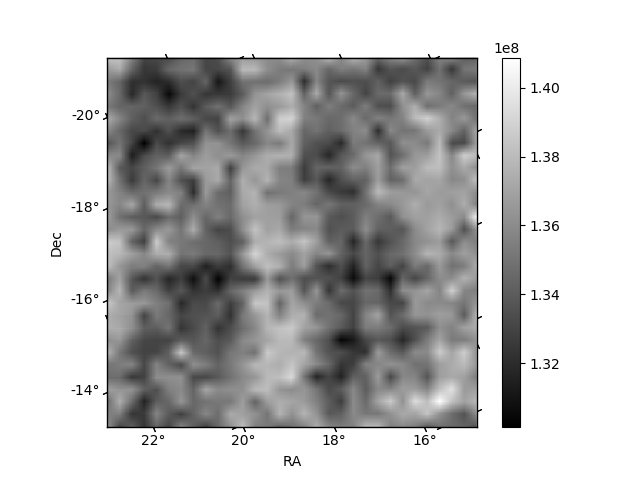
Histogram calculated using DETX and DETY for each event in the final _common_clean file
| Quadrant A | 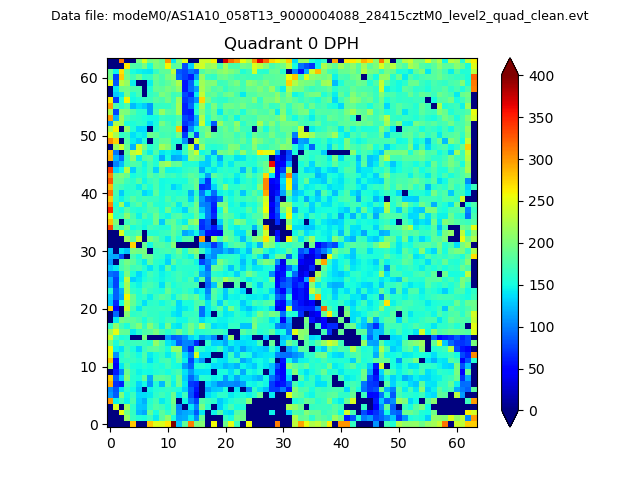 |
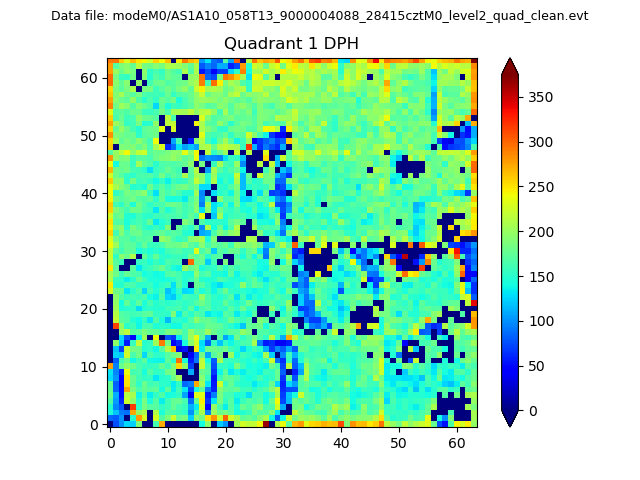 |
Quadrant B |
|---|---|---|---|
| Quadrant D | 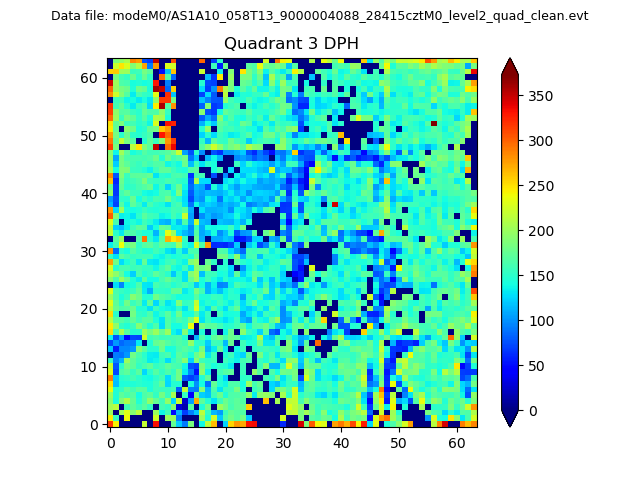 |
 |
Quadrant C |
| Plot type | Count rate plots | Images |
|---|---|---|
| Comparison with Poisson distribution Blue bars denote a histogram of data divided into 1 sec bins. Red curve is a Poisson curve with rate = median count rate of data. |
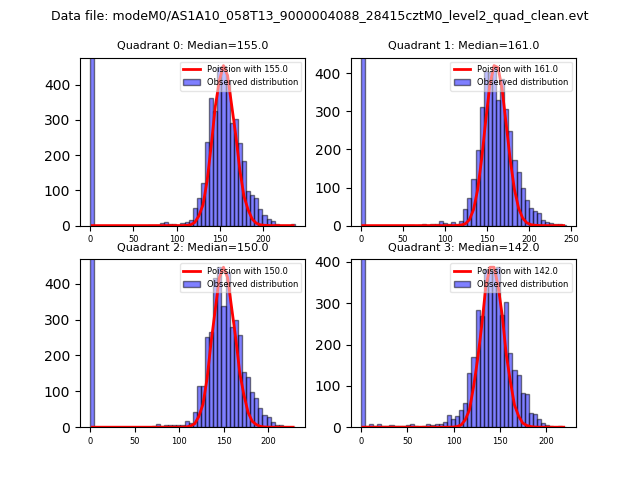 |
 |
| Quadrant-wise count rates Data is divided into 100 sec bins |
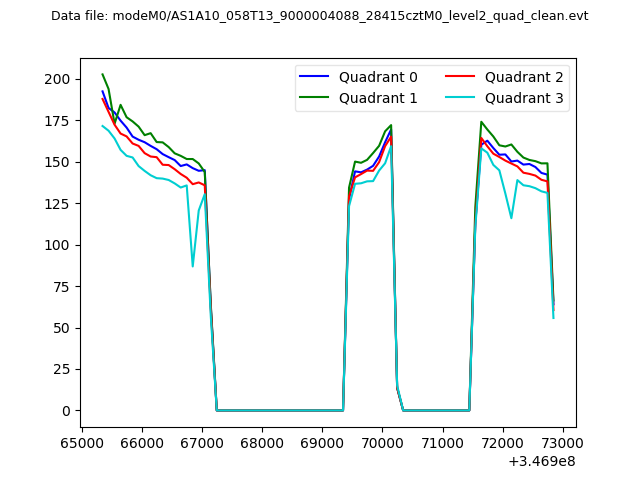 |
|
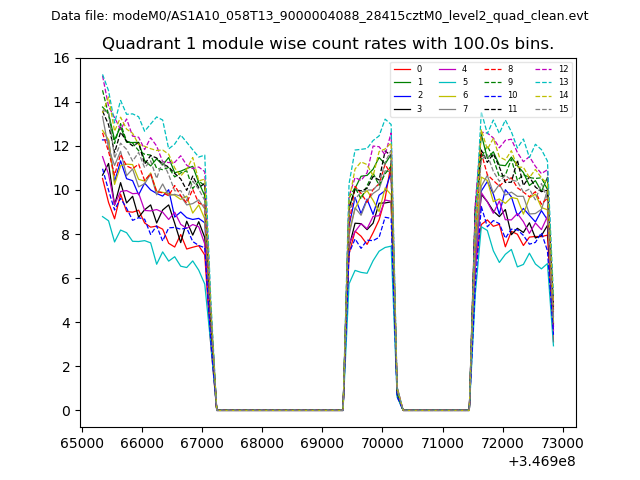
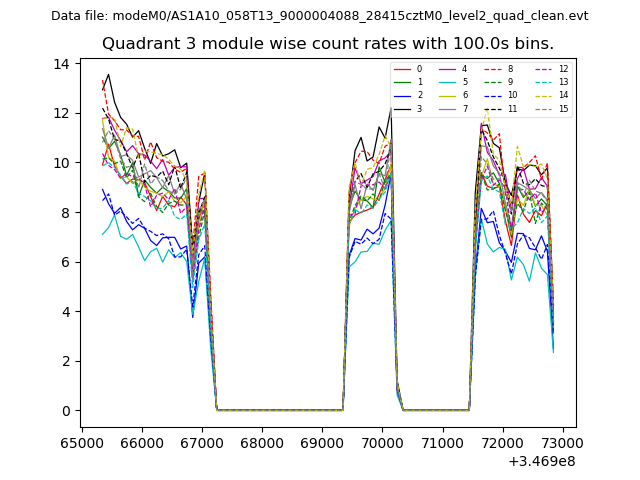
| Module-wise count rates for Quadrant A Data is divided into 100 sec bins |
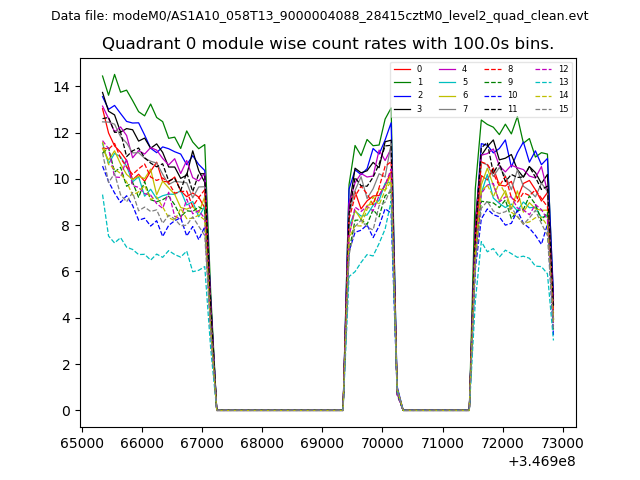 |
 |
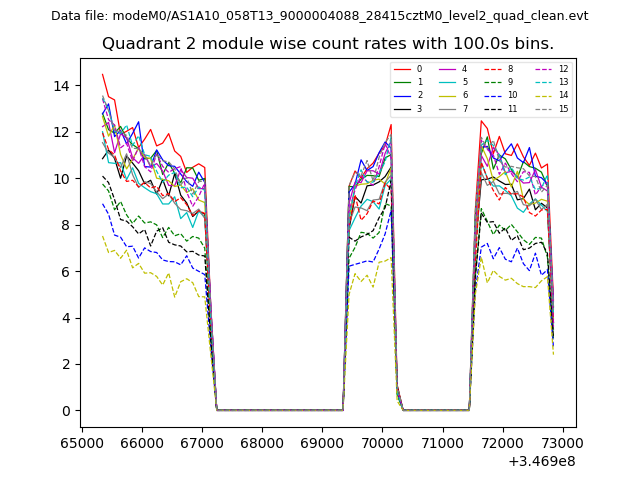
| Module-wise count rates for Quadrant B Data is divided into 100 sec bins |
 |
 |
| Module-wise count rates for Quadrant C Data is divided into 100 sec bins |
 |
 |
| Module-wise count rates for Quadrant D Data is divided into 100 sec bins |
 |
 |
| Parameter | Plot |
|---|---|
| CZT HV Monitor | 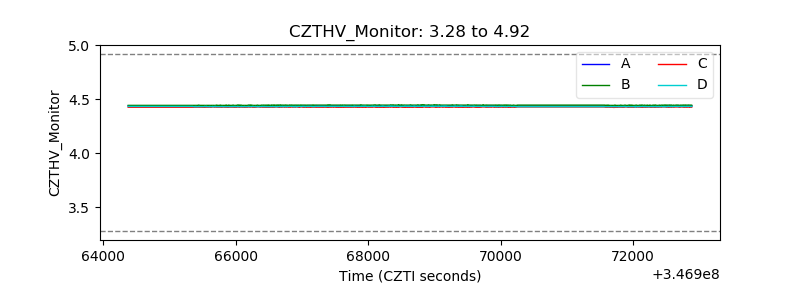 |
| D_VDD | 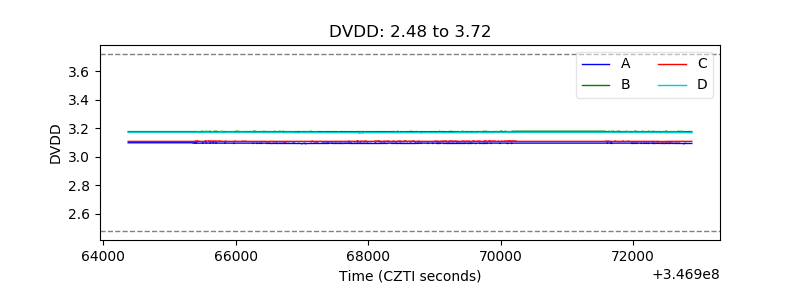 |
| Temperature 1 | 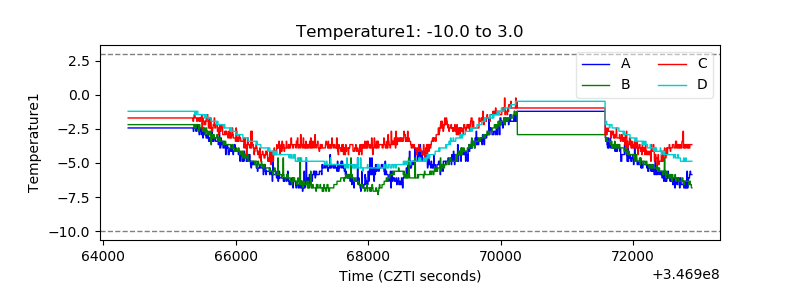 |
| Veto HV Monitor | 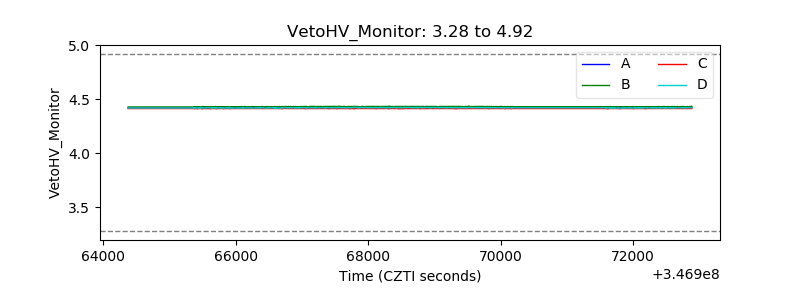 |
| Veto LLD | 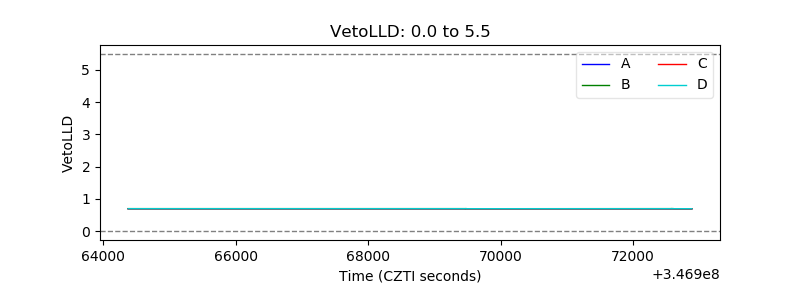 |
| Alpha Counter | 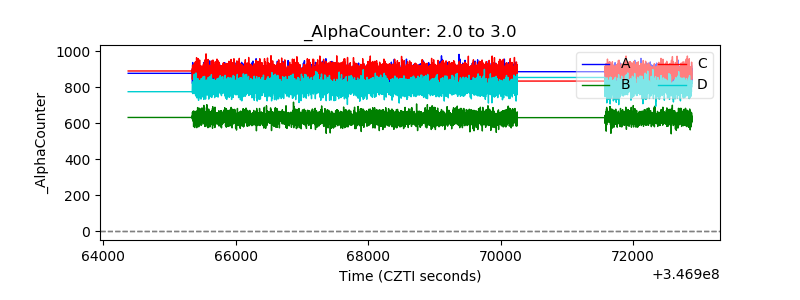 |
| _CPM_Rate |  |
| CZT Counter | 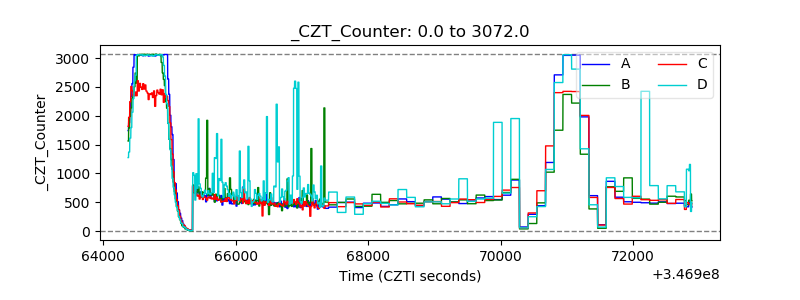 |
| +2.5 Volts monitor | 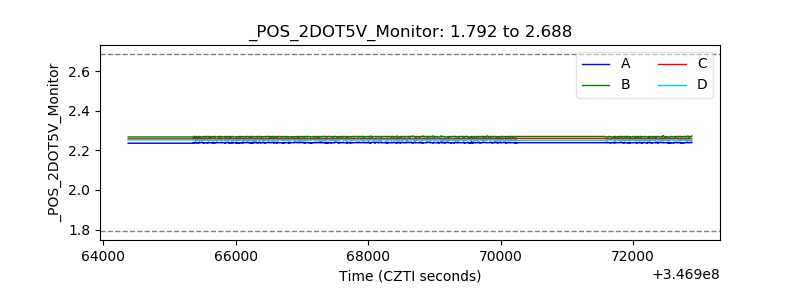 |
| +5 Volts monitor | 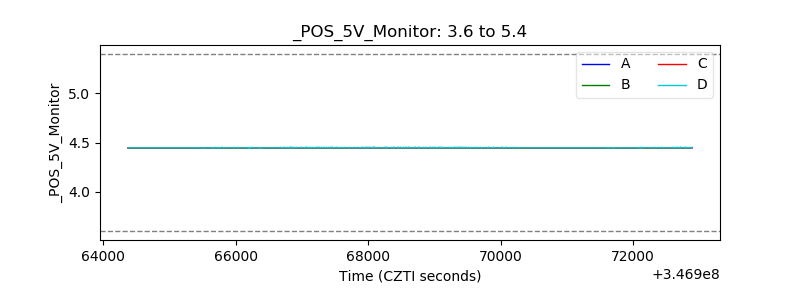 |
| _ROLL_ROT | 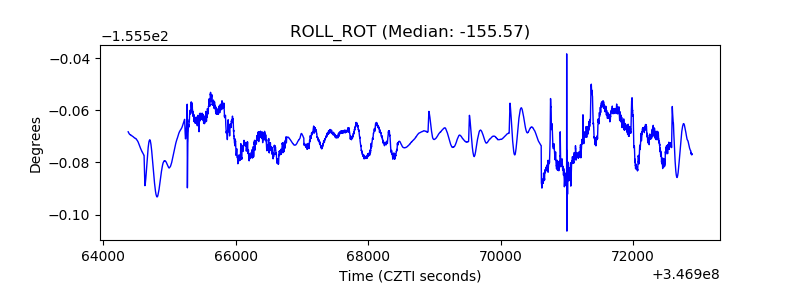 |
| _Roll_DEC |  |
| _Roll_RA | 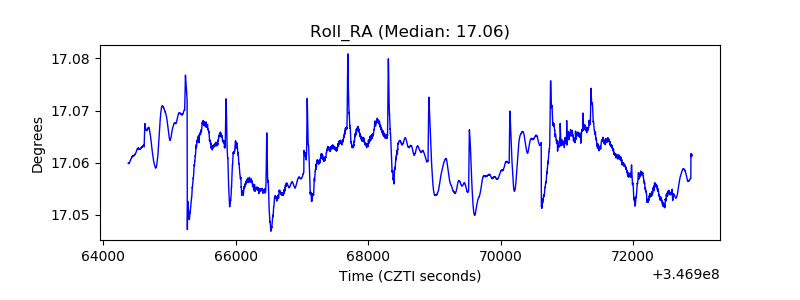 |
| Veto Counter | 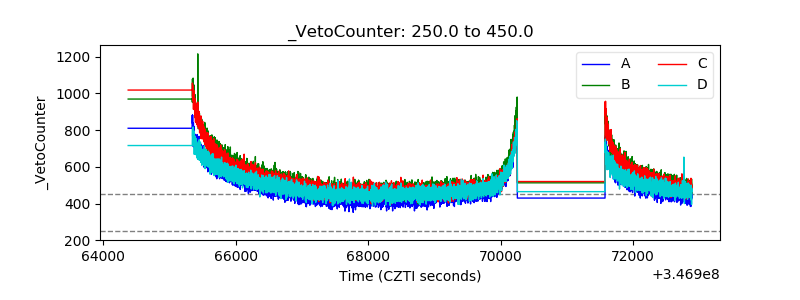 |