| Param | Original file | Final file |
|---|---|---|
| Filename | modeM0/AS1A10_058T13_9000004088_28416cztM0_level2.evt | modeM0/AS1A10_058T13_9000004088_28416cztM0_level2_quad_clean.evt |
| Size (bytes) | 495,152,640 | 87,079,680 |
| Size | 472.2 MB | 83.0 MB |
| Events in quadrant A | 3,207,619 | 558,339 |
| Events in quadrant B | 3,442,488 | 577,284 |
| Events in quadrant C | 3,246,281 | 542,727 |
| Events in quadrant D | 4,667,414 | 514,355 |
| Mode M0 | |||
|---|---|---|---|
| Quadrant | BADHDUFLAG | Total packets | Discarded packets |
| A | 0 | 13486 | 0 |
| B | 0 | 14076 | 0 |
| C | 0 | 13429 | 0 |
| D | 0 | 18079 | 0 |
| Mode M9 | |||
|---|---|---|---|
| Quadrant | BADHDUFLAG | Total packets | Discarded packets |
| A | 0 | 20 | 0 |
| B | 0 | 21 | 0 |
| C | 0 | 21 | 0 |
| D | 0 | 21 | 0 |
| Quadrant | Total seconds | Saturated seconds | Saturation percentage |
|---|---|---|---|
| A | 6372 | 44 | 0.690521% |
| B | 6372 | 49 | 0.768989% |
| C | 6371 | 62 | 0.973160% |
| D | 6371 | 218 | 3.421755% |
Noise dominated data is calculated using 1-second bins in cleaned event files. If a bin has >2000 counts, and if more than 50% of those come from <1% of pixels, then it is considered to be noise-dominated and hence unusable.
| Quadrant | # 1 sec bins | Bins with >0 counts | Bins with >2000 counts | High rate bins dominated by noise | Noise dominated (total time) | Noise dominated (detector-on time) | Marked lightcurve |
|---|---|---|---|---|---|---|---|
| A | 7592 | 6373 | 17 | 17 | 0.22% | 0.27% |  |
| B | 7592 | 6373 | 8 | 8 | 0.11% | 0.13% |  |
| C | 7591 | 6372 | 4 | 4 | 0.05% | 0.06% |  |
| D | 7591 | 6371 | 256 | 256 | 3.37% | 4.02% | 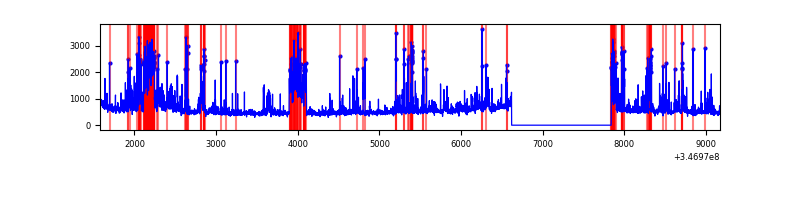 |
Top three noisy pixels from each quadrant. If the there are fewer than three noisy pixels in the level2.evt file, extra rows are filled as -1
| Pixel properties | Quadrant properties | ||||||
|---|---|---|---|---|---|---|---|
| Quadrant | DetID | PixID | Counts | Sigma | Mean | Median | Sigma |
| A | 4 | 2 | 63196 | 382.97 | 813 | 797 | 162.9 |
| A | 13 | 254 | 9974 | 56.32 | 813 | 797 | 162.9 |
| A | 8 | 192 | 9016 | 50.44 | 813 | 797 | 162.9 |
| B | 10 | 245 | 164506 | 1049.1 | 818 | 800 | 156.0 |
| B | 0 | 230 | 23030 | 142.46 | 818 | 800 | 156.0 |
| B | 12 | 111 | 19040 | 116.89 | 818 | 800 | 156.0 |
| C | 14 | 238 | 128573 | 694.62 | 785 | 793 | 184.0 |
| C | 1 | 16 | 32215 | 170.81 | 785 | 793 | 184.0 |
| C | 7 | 220 | 25117 | 132.23 | 785 | 793 | 184.0 |
| D | 1 | 52 | 916586 | 4945.21 | 774 | 752 | 185.2 |
| D | 8 | 195 | 675586 | 3643.89 | 774 | 752 | 185.2 |
| D | 2 | 250 | 95980 | 514.2 | 774 | 752 | 185.2 |
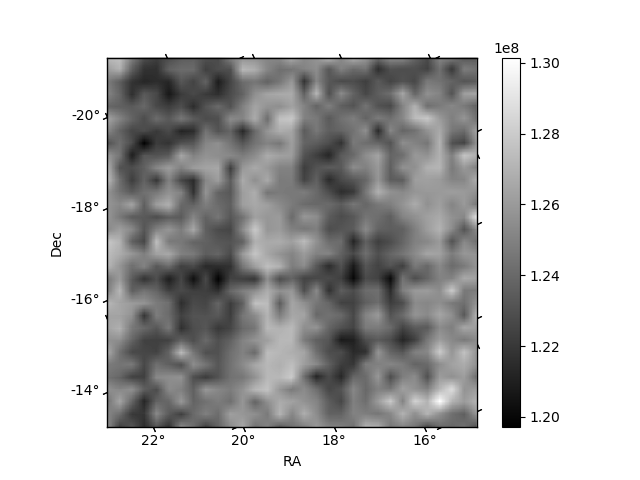
Histogram calculated using DETX and DETY for each event in the final _common_clean file
| Quadrant A | 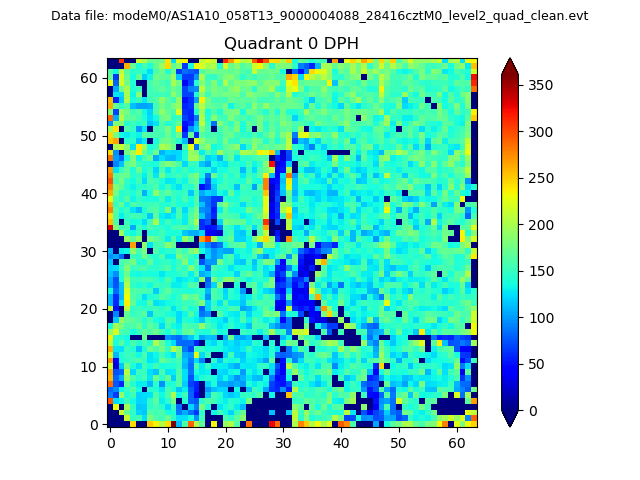 |
 |
Quadrant B |
|---|---|---|---|
| Quadrant D | 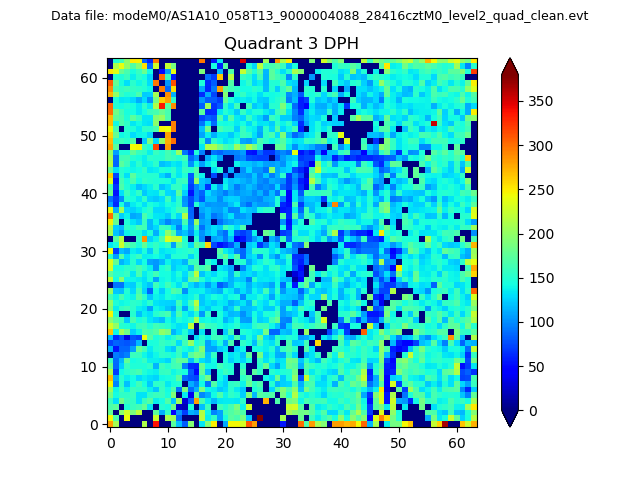 |
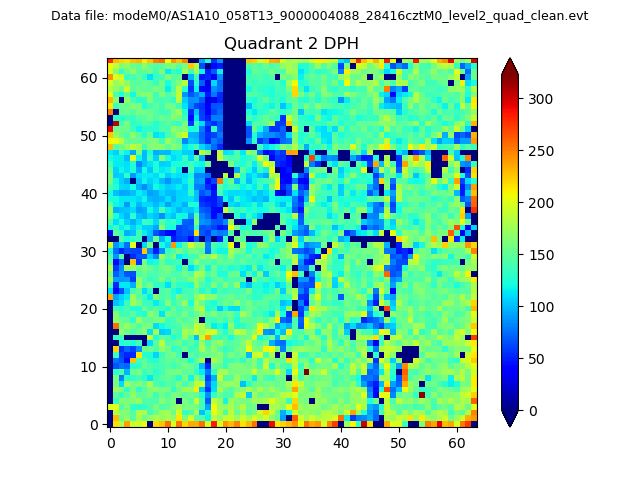 |
Quadrant C |
| Plot type | Count rate plots | Images |
|---|---|---|
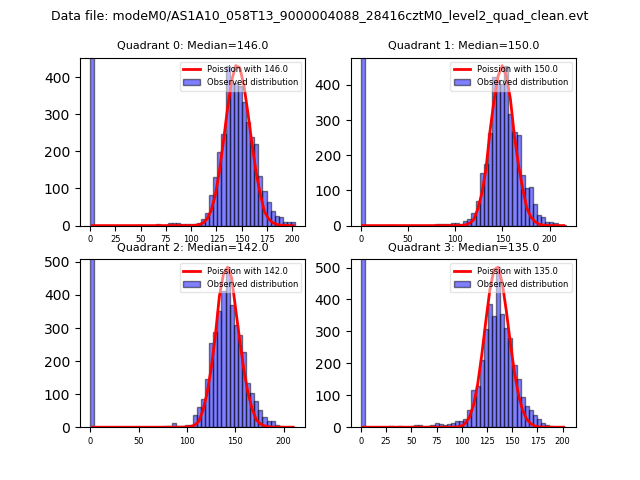
| Comparison with Poisson distribution Blue bars denote a histogram of data divided into 1 sec bins. Red curve is a Poisson curve with rate = median count rate of data. |
 |
 |
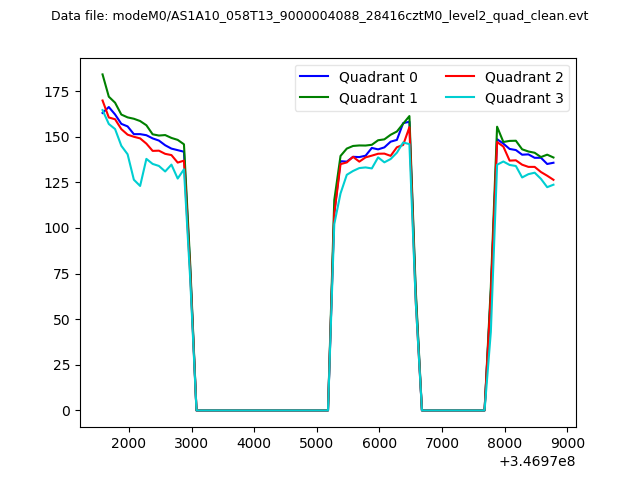
| Quadrant-wise count rates Data is divided into 100 sec bins |
 |
|
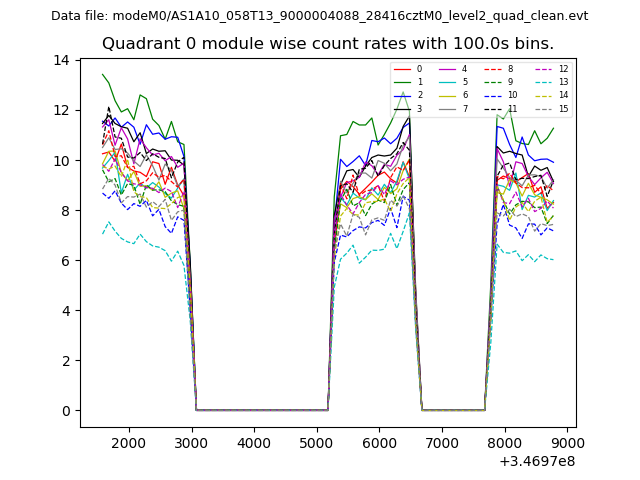
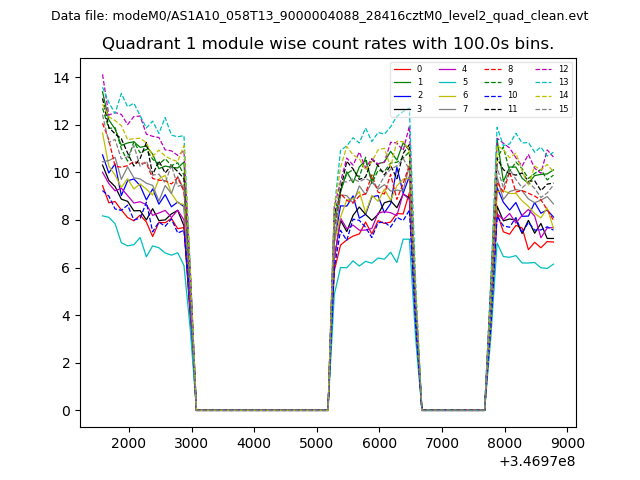
| Module-wise count rates for Quadrant A Data is divided into 100 sec bins |
 |
 |
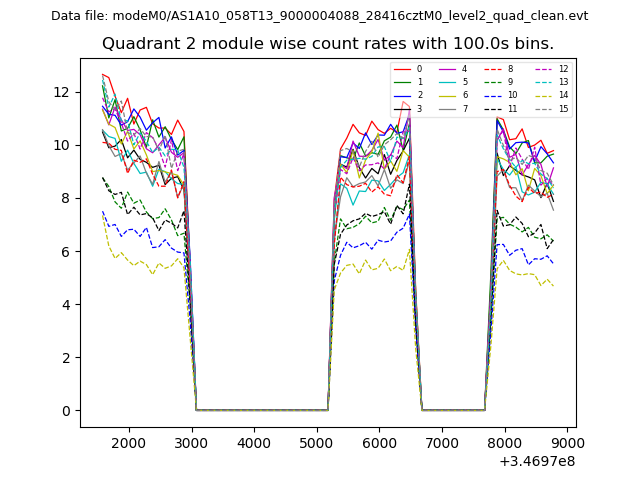
| Module-wise count rates for Quadrant B Data is divided into 100 sec bins |
 |
 |
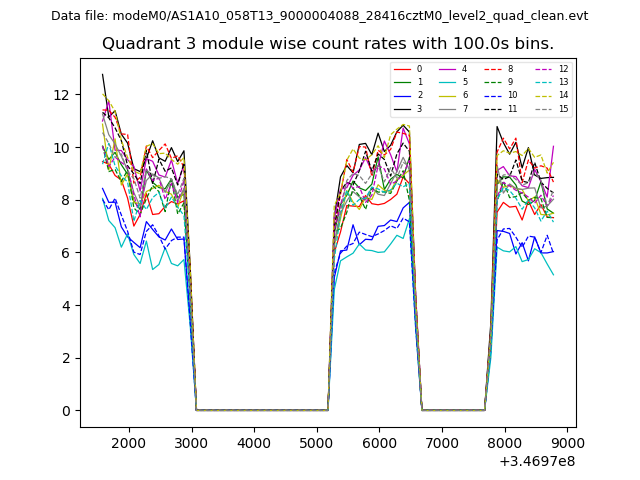
| Module-wise count rates for Quadrant C Data is divided into 100 sec bins |
 |
 |
| Module-wise count rates for Quadrant D Data is divided into 100 sec bins |
 |
 |
| Parameter | Plot |
|---|---|
| CZT HV Monitor | 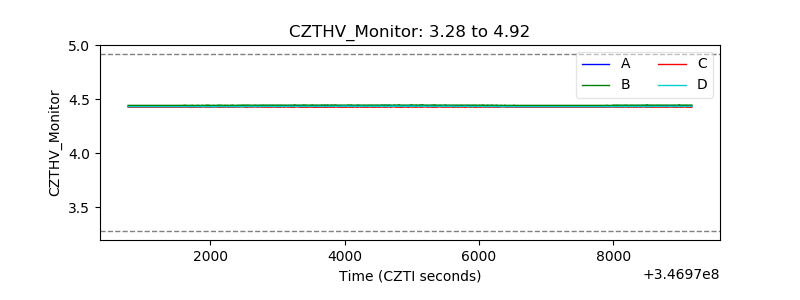 |
| D_VDD | 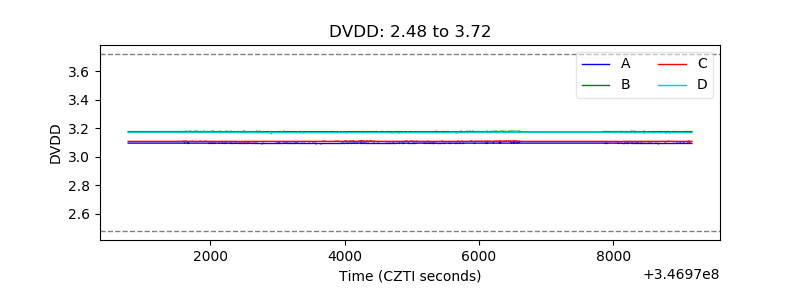 |
| Temperature 1 | 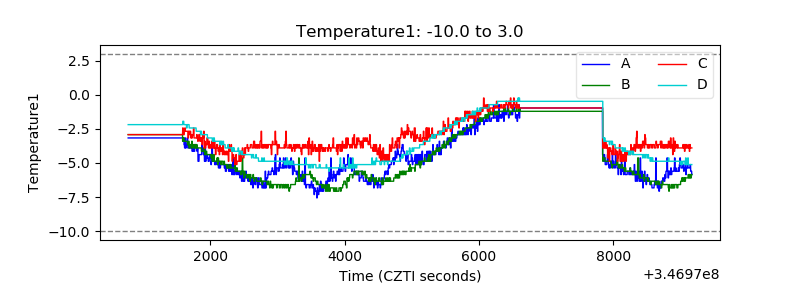 |
| Veto HV Monitor | 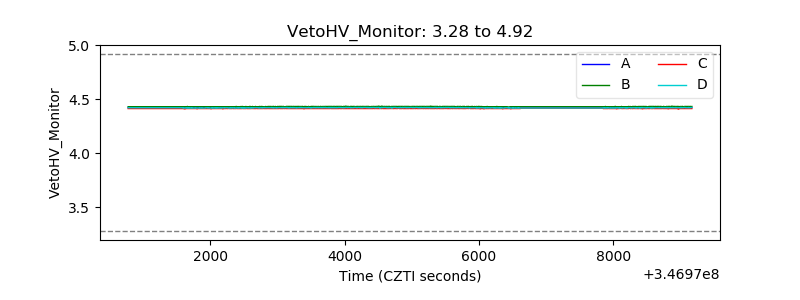 |
| Veto LLD | 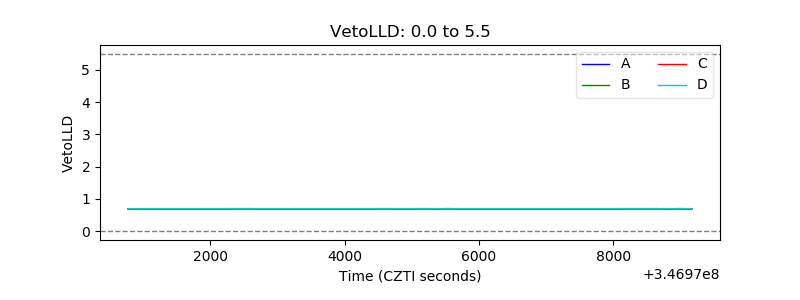 |
| Alpha Counter | 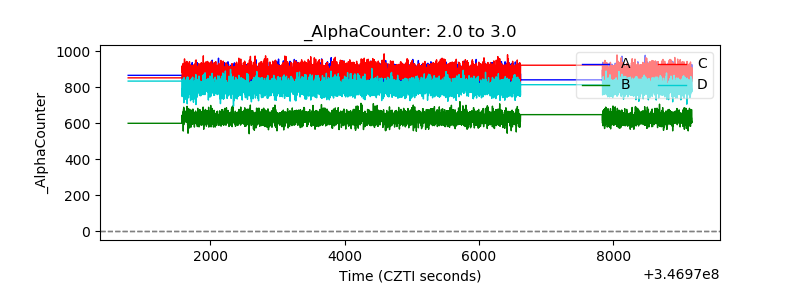 |
| _CPM_Rate | 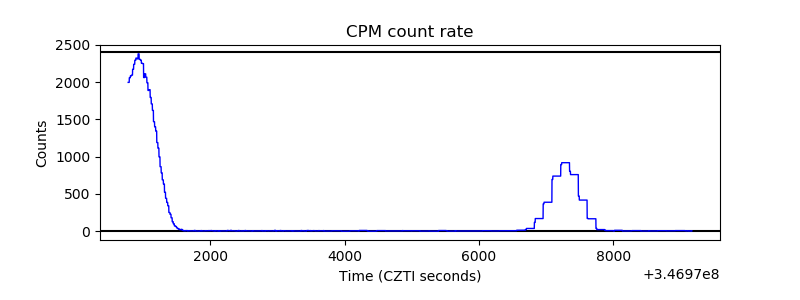 |
| CZT Counter | 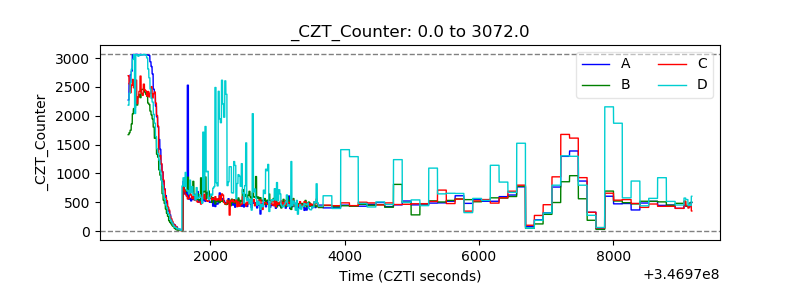 |
| +2.5 Volts monitor | 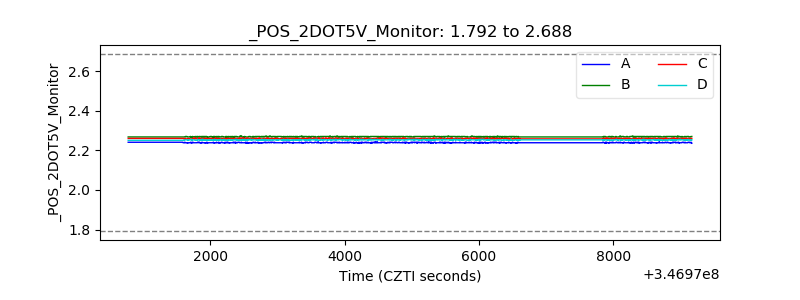 |
| +5 Volts monitor | 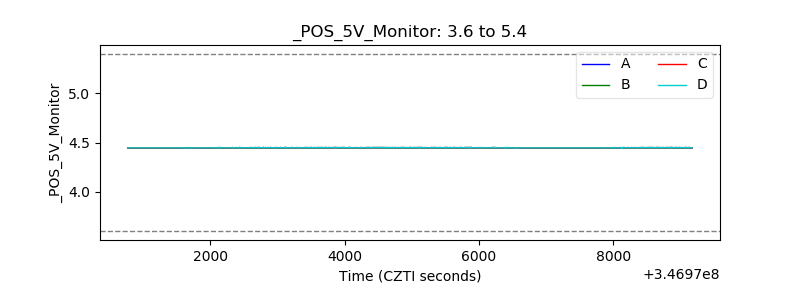 |
| _ROLL_ROT | 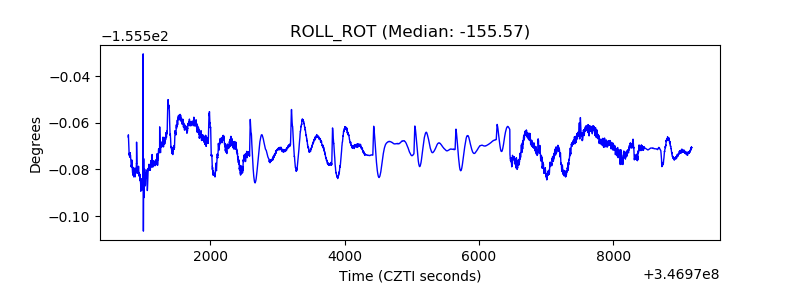 |
| _Roll_DEC |  |
| _Roll_RA | 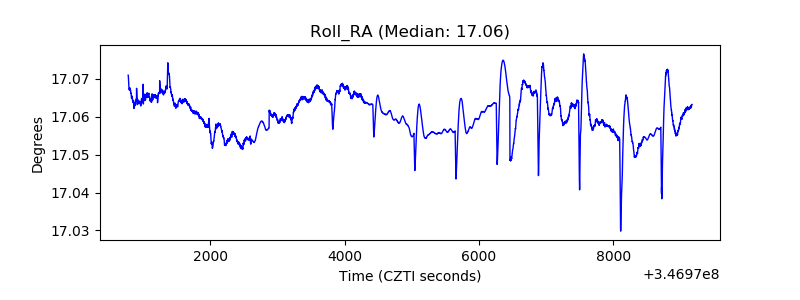 |
| Veto Counter | 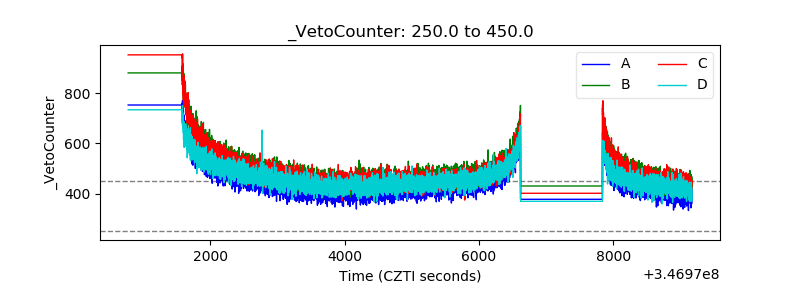 |