| Param | Original file | Final file |
|---|---|---|
| Filename | modeM0/AS1A10_058T13_9000004088_28417cztM0_level2.evt | modeM0/AS1A10_058T13_9000004088_28417cztM0_level2_quad_clean.evt |
| Size (bytes) | 508,072,320 | 83,419,200 |
| Size | 484.5 MB | 79.6 MB |
| Events in quadrant A | 3,326,073 | 520,114 |
| Events in quadrant B | 3,434,575 | 533,340 |
| Events in quadrant C | 3,392,927 | 503,211 |
| Events in quadrant D | 4,758,766 | 482,234 |
| Mode M0 | |||
|---|---|---|---|
| Quadrant | BADHDUFLAG | Total packets | Discarded packets |
| A | 0 | 14279 | 0 |
| B | 0 | 14413 | 0 |
| C | 0 | 14349 | 0 |
| D | 0 | 18695 | 0 |
| Mode M9 | |||
|---|---|---|---|
| Quadrant | BADHDUFLAG | Total packets | Discarded packets |
| A | 0 | 12 | 0 |
| B | 0 | 13 | 0 |
| C | 0 | 13 | 0 |
| D | 0 | 13 | 0 |
| Quadrant | Total seconds | Saturated seconds | Saturation percentage |
|---|---|---|---|
| A | 6988 | 32 | 0.457928% |
| B | 6987 | 48 | 0.686990% |
| C | 6987 | 65 | 0.930299% |
| D | 6987 | 165 | 2.361529% |
Noise dominated data is calculated using 1-second bins in cleaned event files. If a bin has >2000 counts, and if more than 50% of those come from <1% of pixels, then it is considered to be noise-dominated and hence unusable.
| Quadrant | # 1 sec bins | Bins with >0 counts | Bins with >2000 counts | High rate bins dominated by noise | Noise dominated (total time) | Noise dominated (detector-on time) | Marked lightcurve |
|---|---|---|---|---|---|---|---|
| A | 7838 | 6989 | 0 | 0 | 0.00% | 0.00% | 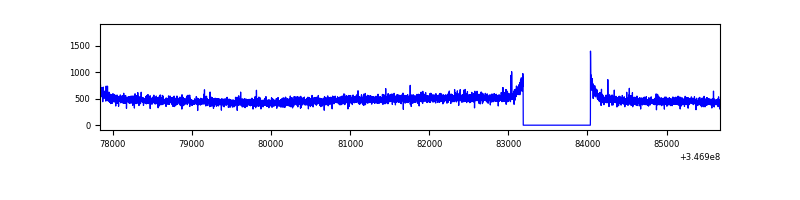 |
| B | 7837 | 6988 | 0 | 0 | 0.00% | 0.00% | 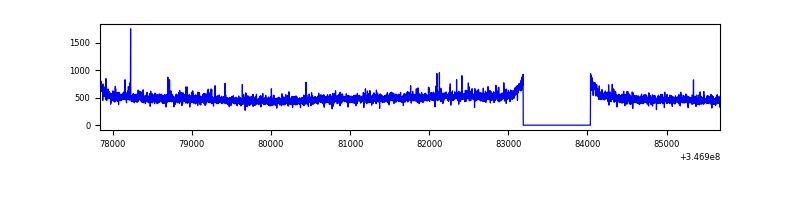 |
| C | 7837 | 6988 | 3 | 3 | 0.04% | 0.04% | 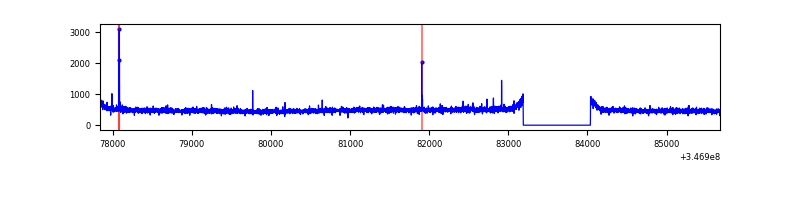 |
| D | 7837 | 6988 | 138 | 138 | 1.76% | 1.97% | 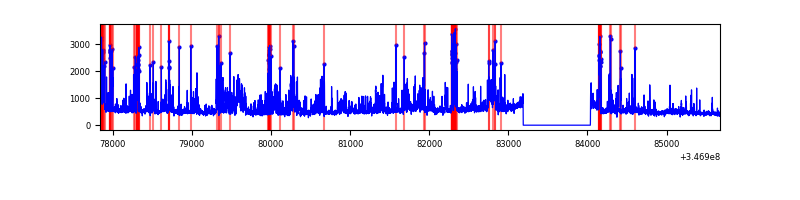 |
Top three noisy pixels from each quadrant. If the there are fewer than three noisy pixels in the level2.evt file, extra rows are filled as -1
| Pixel properties | Quadrant properties | ||||||
|---|---|---|---|---|---|---|---|
| Quadrant | DetID | PixID | Counts | Sigma | Mean | Median | Sigma |
| A | 13 | 254 | 11147 | 59.46 | 860 | 841 | 173.3 |
| A | 3 | 137 | 8191 | 42.4 | 860 | 841 | 173.3 |
| A | 0 | 226 | 7229 | 36.85 | 860 | 841 | 173.3 |
| B | 10 | 245 | 21278 | 123.17 | 862 | 840 | 165.9 |
| B | 12 | 111 | 20337 | 117.5 | 862 | 840 | 165.9 |
| B | 11 | 111 | 18591 | 106.98 | 862 | 840 | 165.9 |
| C | 14 | 238 | 132153 | 671.13 | 830 | 838 | 195.7 |
| C | 7 | 220 | 27049 | 133.96 | 830 | 838 | 195.7 |
| C | 13 | 61 | 5654 | 24.61 | 830 | 838 | 195.7 |
| D | 1 | 52 | 1070297 | 5351.23 | 823 | 801 | 199.9 |
| D | 8 | 195 | 288519 | 1439.6 | 823 | 801 | 199.9 |
| D | 2 | 250 | 203240 | 1012.9 | 823 | 801 | 199.9 |
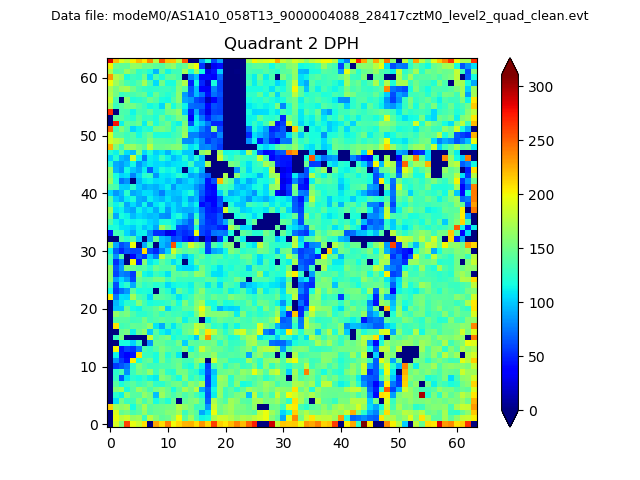
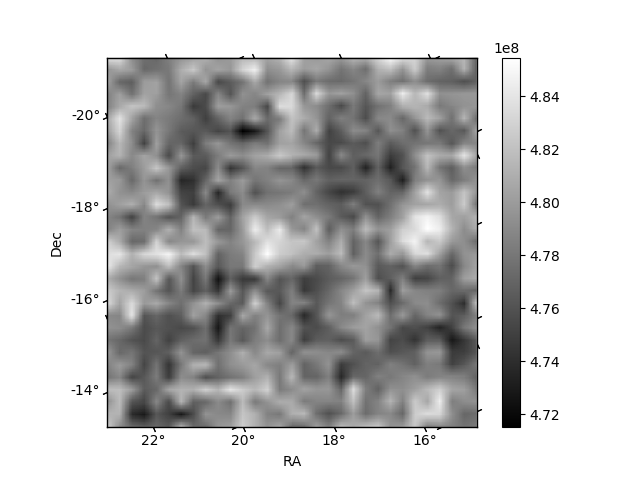
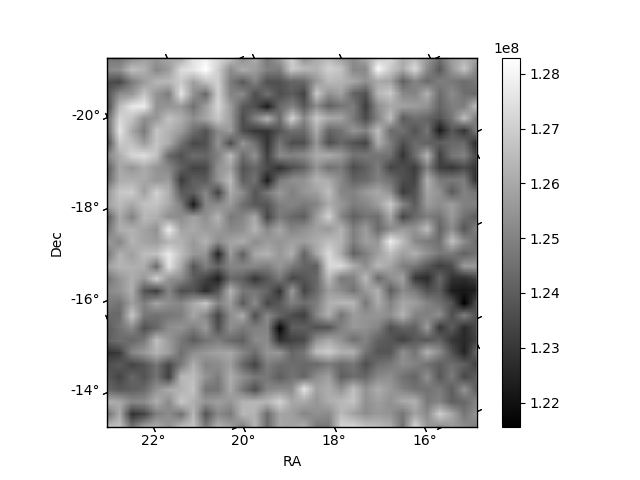
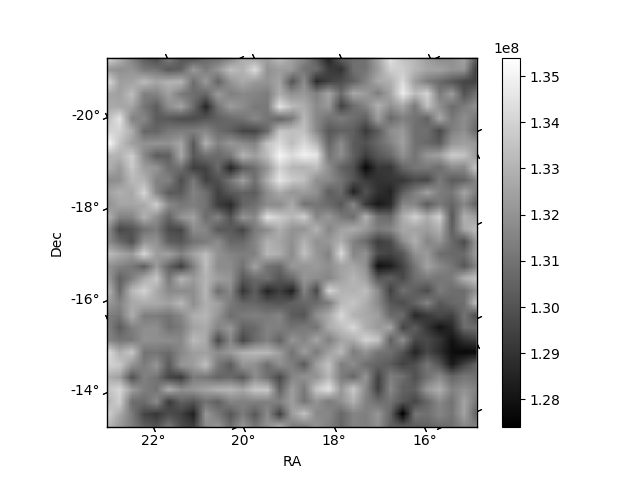
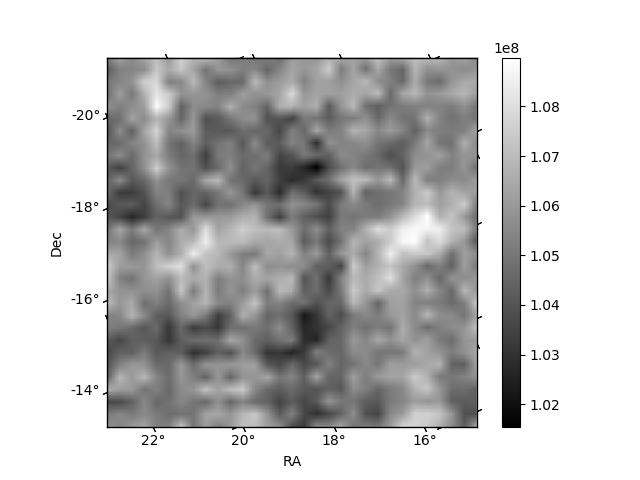
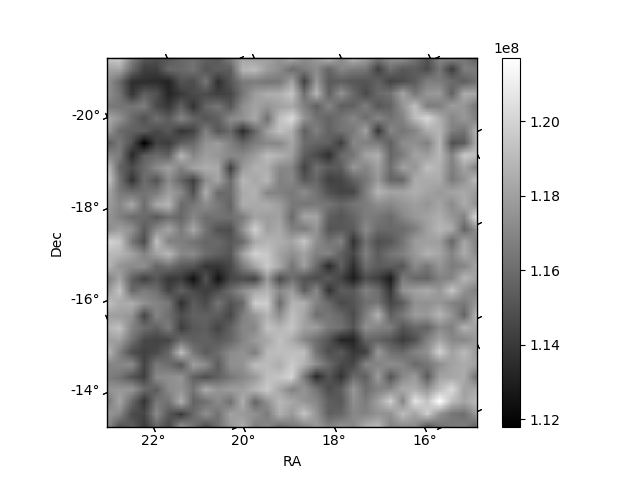
Histogram calculated using DETX and DETY for each event in the final _common_clean file
| Quadrant A | 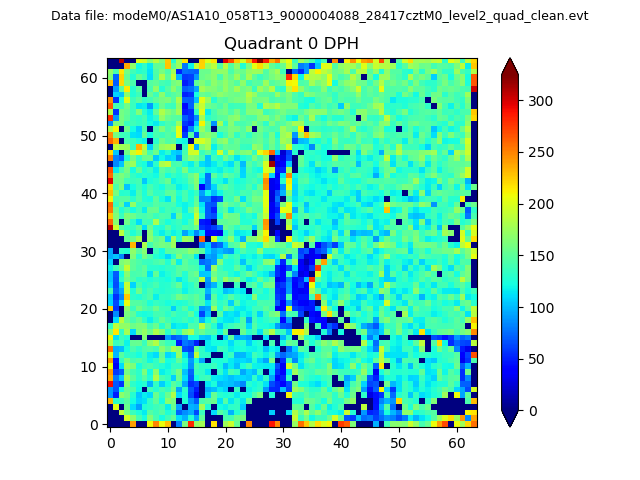 |
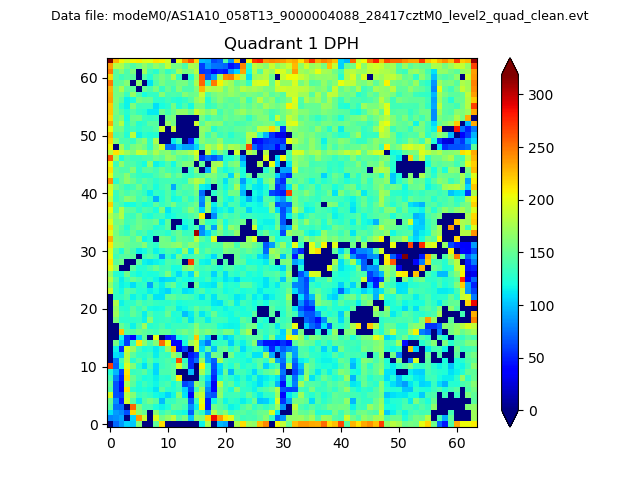 |
Quadrant B |
|---|---|---|---|
| Quadrant D | 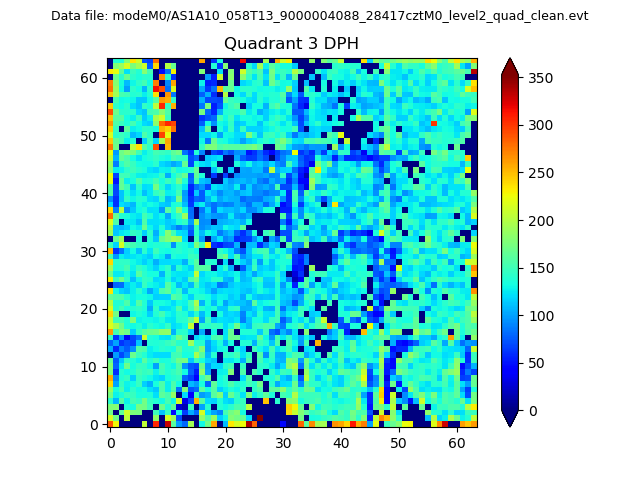 |
 |
Quadrant C |
| Plot type | Count rate plots | Images |
|---|---|---|
| Comparison with Poisson distribution Blue bars denote a histogram of data divided into 1 sec bins. Red curve is a Poisson curve with rate = median count rate of data. |
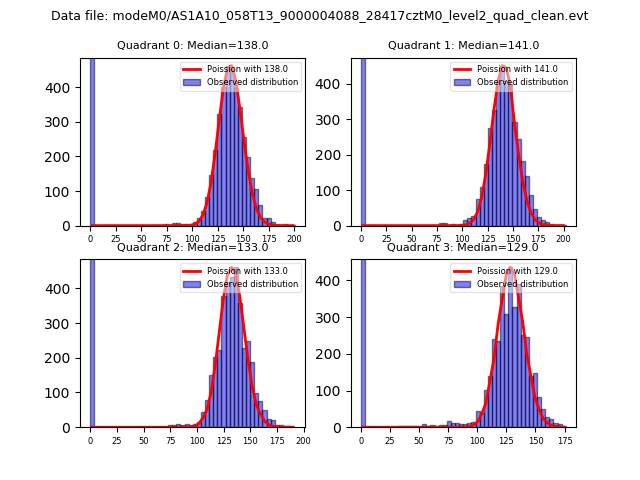 |
 |
| Quadrant-wise count rates Data is divided into 100 sec bins |
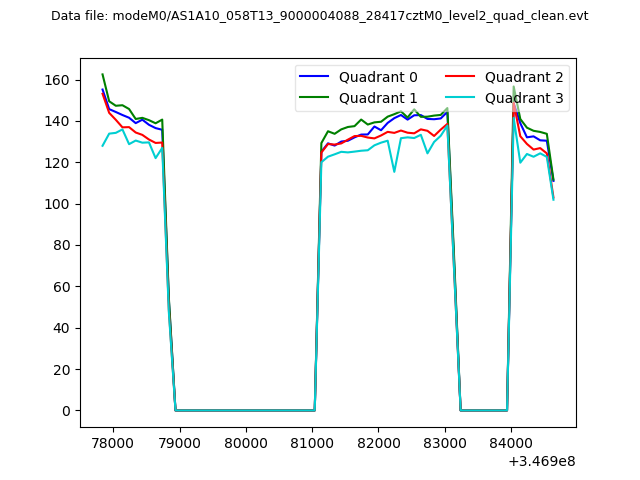 |
|
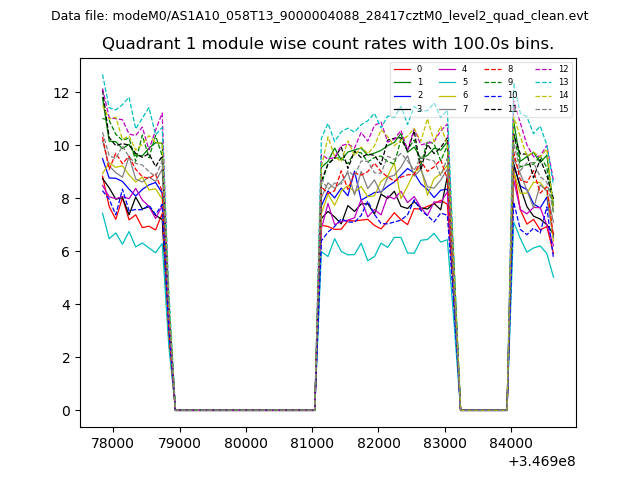
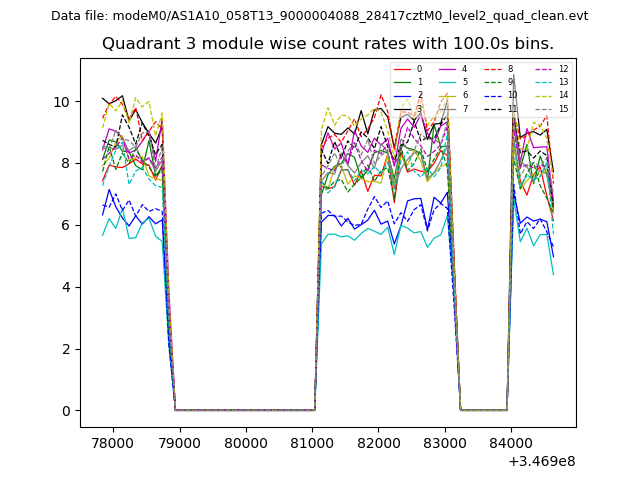
| Module-wise count rates for Quadrant A Data is divided into 100 sec bins |
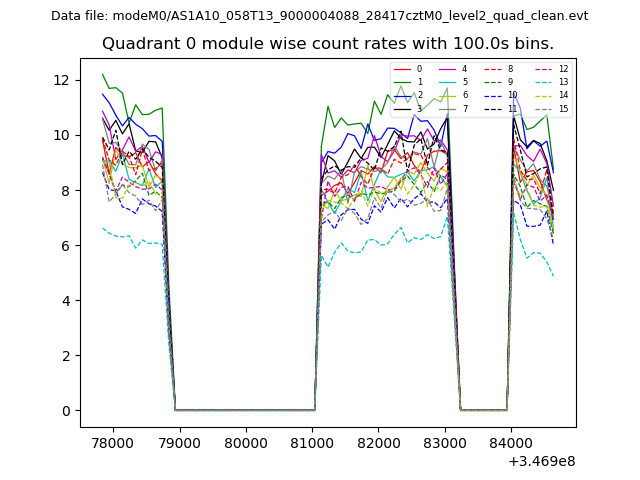 |
 |
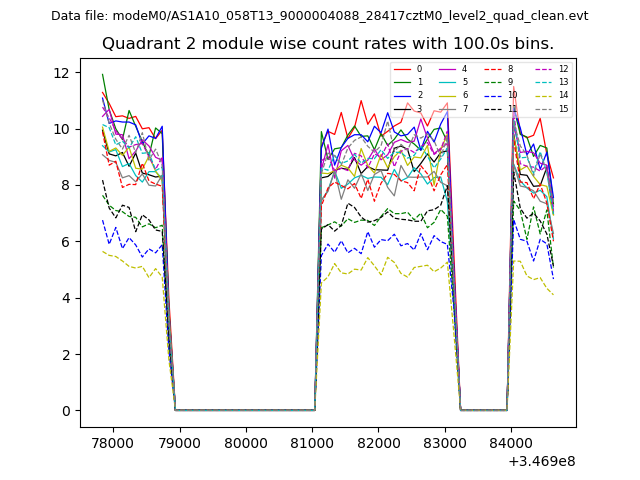
| Module-wise count rates for Quadrant B Data is divided into 100 sec bins |
 |
 |
| Module-wise count rates for Quadrant C Data is divided into 100 sec bins |
 |
 |
| Module-wise count rates for Quadrant D Data is divided into 100 sec bins |
 |
 |
| Parameter | Plot |
|---|---|
| CZT HV Monitor | 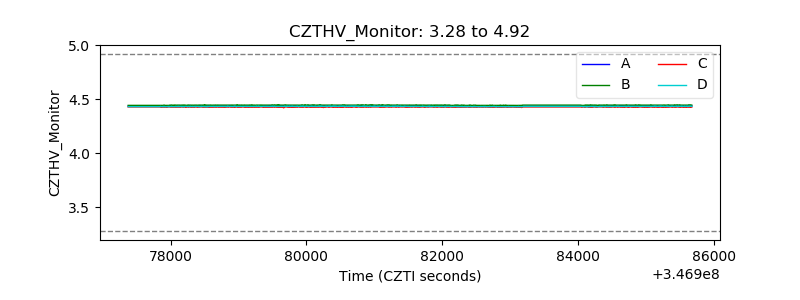 |
| D_VDD | 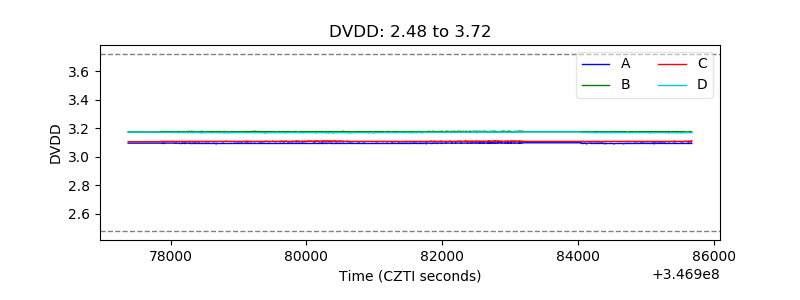 |
| Temperature 1 | 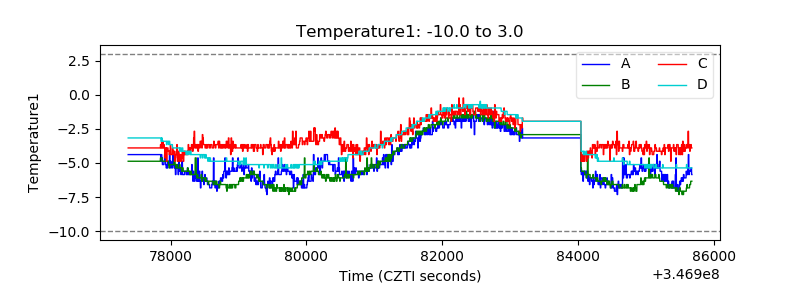 |
| Veto HV Monitor | 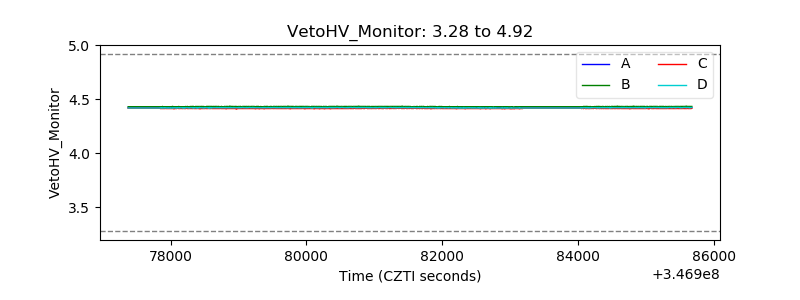 |
| Veto LLD | 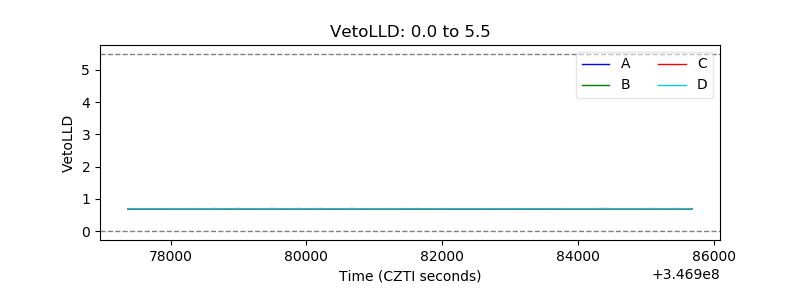 |
| Alpha Counter | 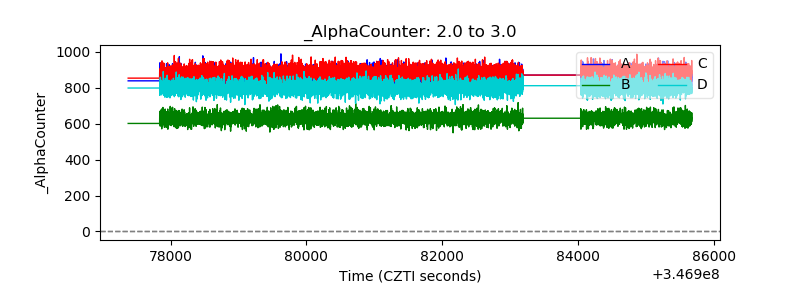 |
| _CPM_Rate | 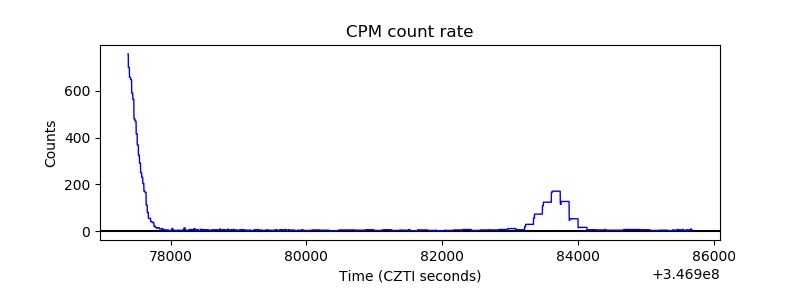 |
| CZT Counter | 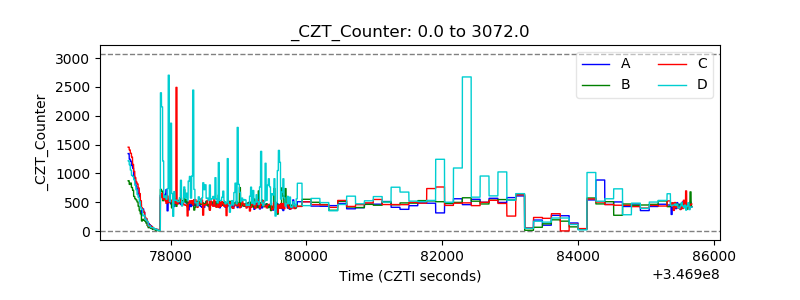 |
| +2.5 Volts monitor |  |
| +5 Volts monitor |  |
| _ROLL_ROT | 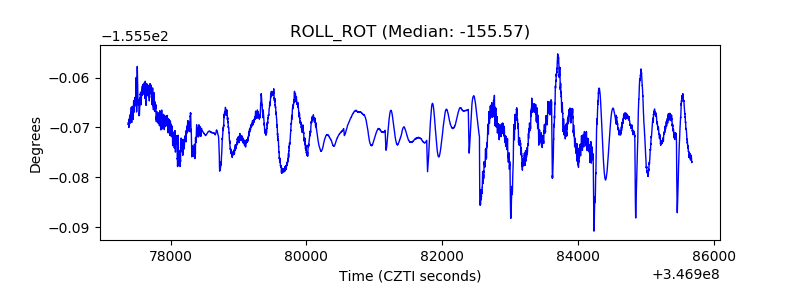 |
| _Roll_DEC | 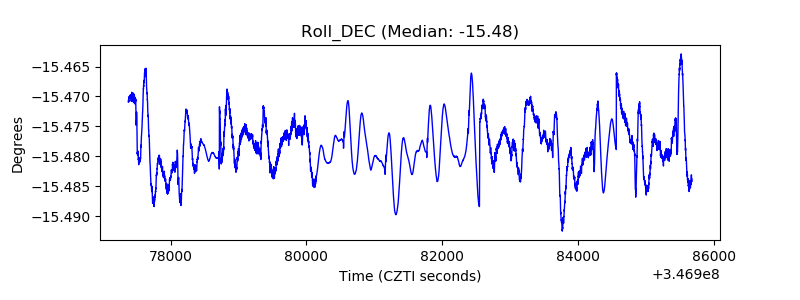 |
| _Roll_RA | 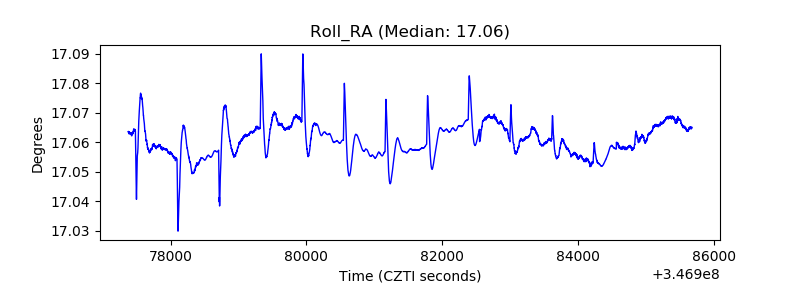 |
| Veto Counter | 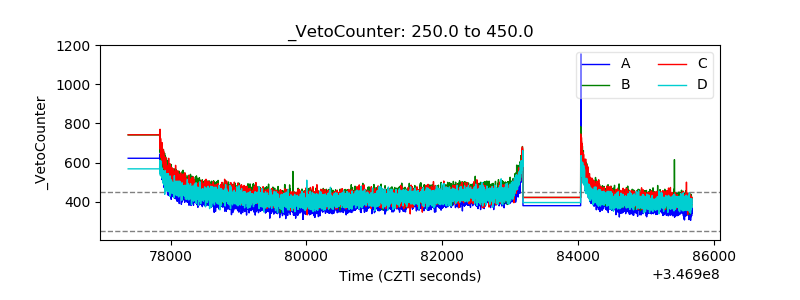 |