| Param | Original file | Final file |
|---|---|---|
| Filename | modeM0/AS1A10_058T13_9000004088_28418cztM0_level2.evt | modeM0/AS1A10_058T13_9000004088_28418cztM0_level2_quad_clean.evt |
| Size (bytes) | 569,502,720 | 80,078,400 |
| Size | 543.1 MB | 76.4 MB |
| Events in quadrant A | 3,428,219 | 493,359 |
| Events in quadrant B | 3,711,734 | 499,093 |
| Events in quadrant C | 3,482,095 | 477,520 |
| Events in quadrant D | 6,135,183 | 451,297 |
| Mode M0 | |||
|---|---|---|---|
| Quadrant | BADHDUFLAG | Total packets | Discarded packets |
| A | 0 | 14872 | 0 |
| B | 0 | 15577 | 0 |
| C | 0 | 14907 | 0 |
| D | 0 | 22995 | 0 |
| Mode M9 | |||
|---|---|---|---|
| Quadrant | BADHDUFLAG | Total packets | Discarded packets |
| A | 0 | 4 | 0 |
| B | 0 | 4 | 0 |
| C | 0 | 4 | 0 |
| D | 0 | 4 | 0 |
| Quadrant | Total seconds | Saturated seconds | Saturation percentage |
|---|---|---|---|
| A | 7230 | 56 | 0.774550% |
| B | 7230 | 133 | 1.839557% |
| C | 7230 | 117 | 1.618257% |
| D | 7230 | 490 | 6.777317% |
Noise dominated data is calculated using 1-second bins in cleaned event files. If a bin has >2000 counts, and if more than 50% of those come from <1% of pixels, then it is considered to be noise-dominated and hence unusable.
| Quadrant | # 1 sec bins | Bins with >0 counts | Bins with >2000 counts | High rate bins dominated by noise | Noise dominated (total time) | Noise dominated (detector-on time) | Marked lightcurve |
|---|---|---|---|---|---|---|---|
| A | 7600 | 7231 | 0 | 0 | 0.00% | 0.00% | 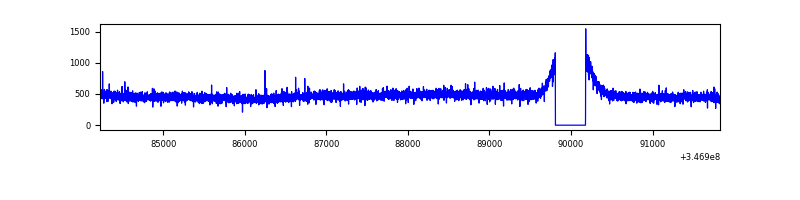 |
| B | 7600 | 7230 | 11 | 11 | 0.14% | 0.15% | 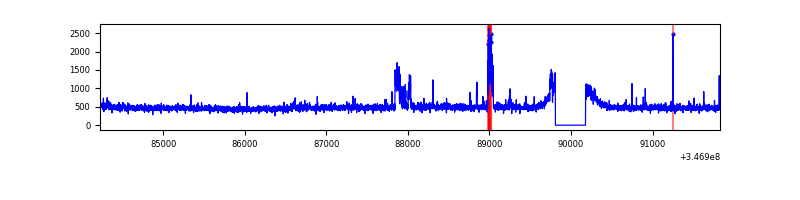 |
| C | 7600 | 7231 | 0 | 0 | 0.00% | 0.00% | 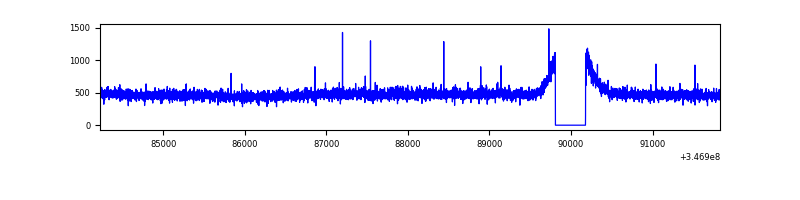 |
| D | 7600 | 7231 | 451 | 451 | 5.93% | 6.24% | 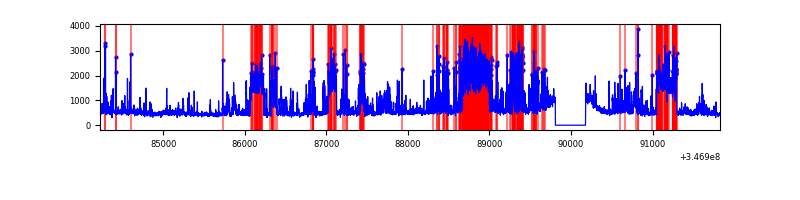 |
Top three noisy pixels from each quadrant. If the there are fewer than three noisy pixels in the level2.evt file, extra rows are filled as -1
| Pixel properties | Quadrant properties | ||||||
|---|---|---|---|---|---|---|---|
| Quadrant | DetID | PixID | Counts | Sigma | Mean | Median | Sigma |
| A | 13 | 254 | 11653 | 59.97 | 887 | 868 | 179.8 |
| A | 3 | 137 | 8852 | 44.4 | 887 | 868 | 179.8 |
| A | 0 | 226 | 7514 | 36.96 | 887 | 868 | 179.8 |
| B | 10 | 245 | 217639 | 1255.99 | 886 | 863 | 172.6 |
| B | 12 | 111 | 21469 | 119.39 | 886 | 863 | 172.6 |
| B | 11 | 111 | 19144 | 105.92 | 886 | 863 | 172.6 |
| C | 14 | 238 | 134430 | 659.5 | 854 | 861 | 202.5 |
| C | 7 | 220 | 20656 | 97.74 | 854 | 861 | 202.5 |
| C | 13 | 61 | 5850 | 24.63 | 854 | 861 | 202.5 |
| D | 1 | 52 | 1368821 | 6749.96 | 844 | 821 | 202.7 |
| D | 8 | 195 | 1361457 | 6713.62 | 844 | 821 | 202.7 |
| D | 2 | 250 | 171525 | 842.28 | 844 | 821 | 202.7 |
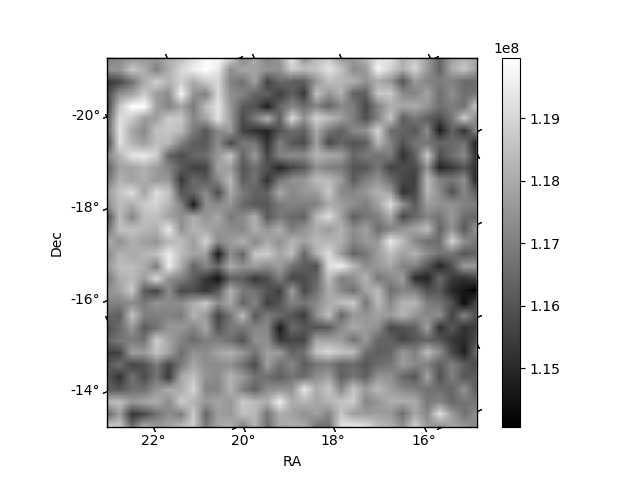
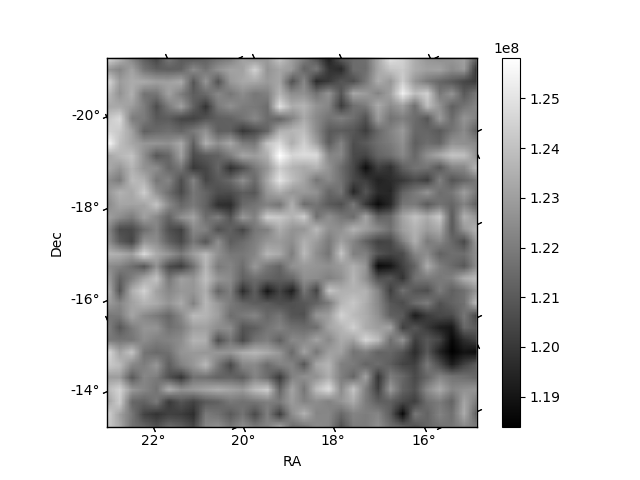
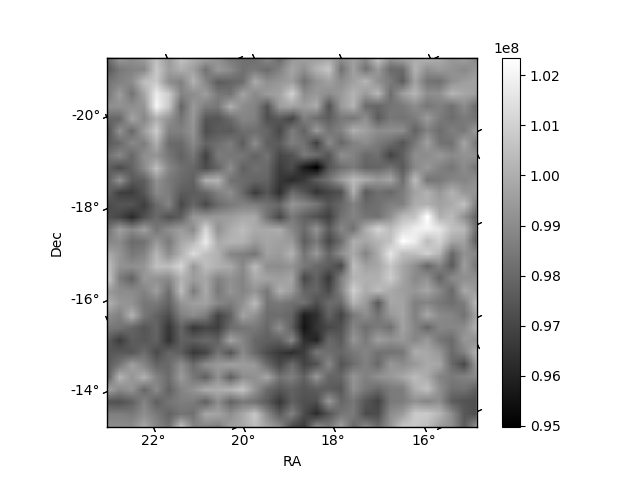
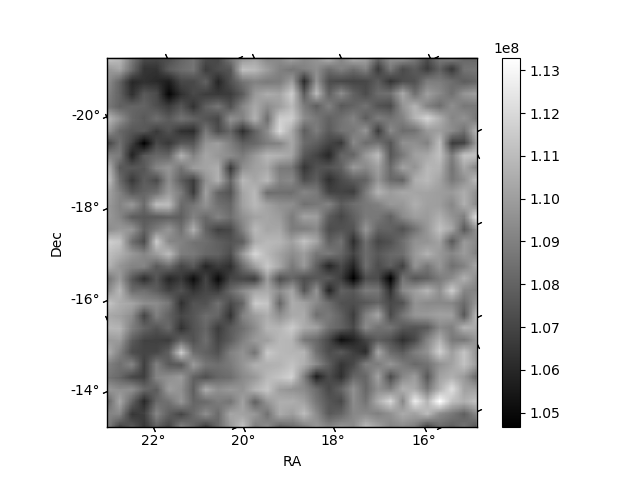
Histogram calculated using DETX and DETY for each event in the final _common_clean file
| Quadrant A | 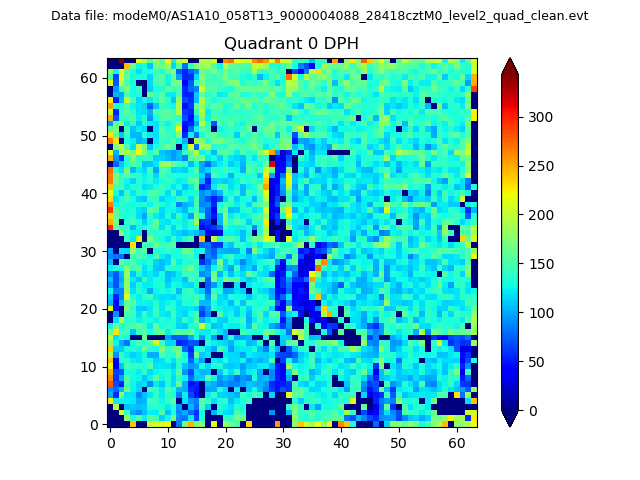 |
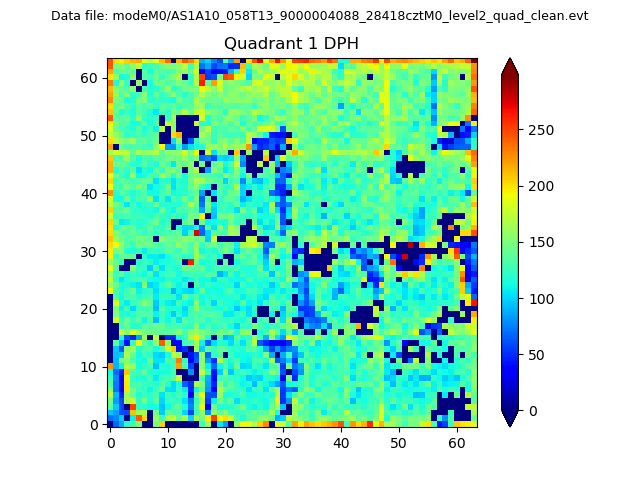 |
Quadrant B |
|---|---|---|---|
| Quadrant D | 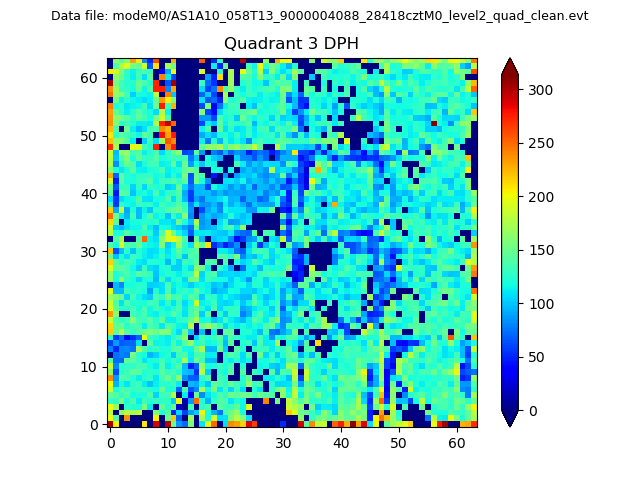 |
 |
Quadrant C |
| Plot type | Count rate plots | Images |
|---|---|---|
| Comparison with Poisson distribution Blue bars denote a histogram of data divided into 1 sec bins. Red curve is a Poisson curve with rate = median count rate of data. |
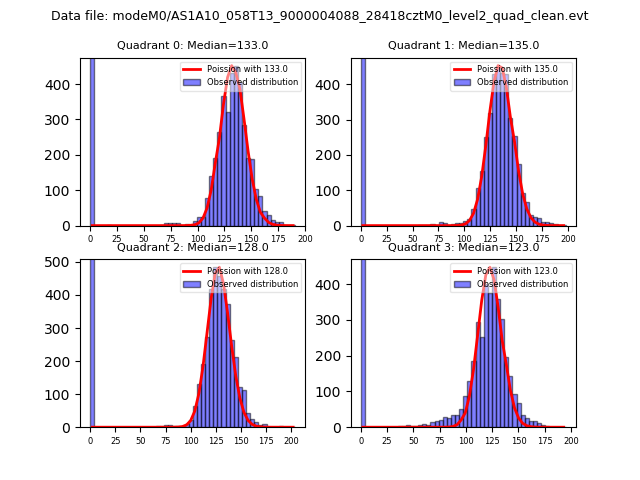 |
 |
| Quadrant-wise count rates Data is divided into 100 sec bins |
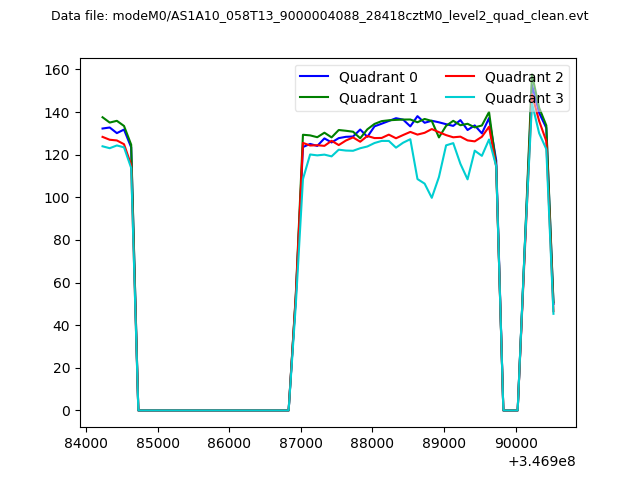 |
|
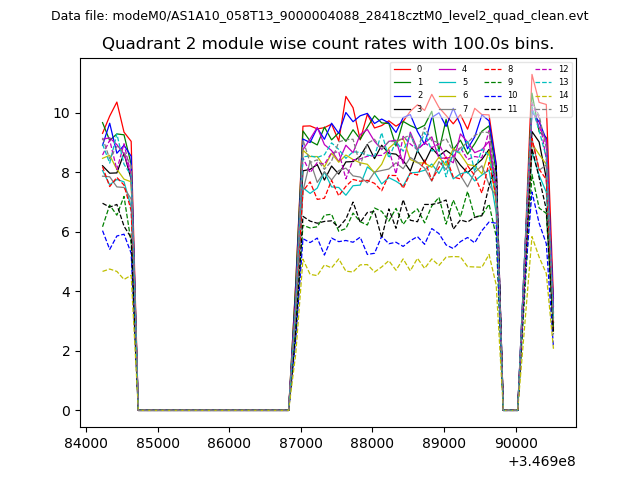
| Module-wise count rates for Quadrant A Data is divided into 100 sec bins |
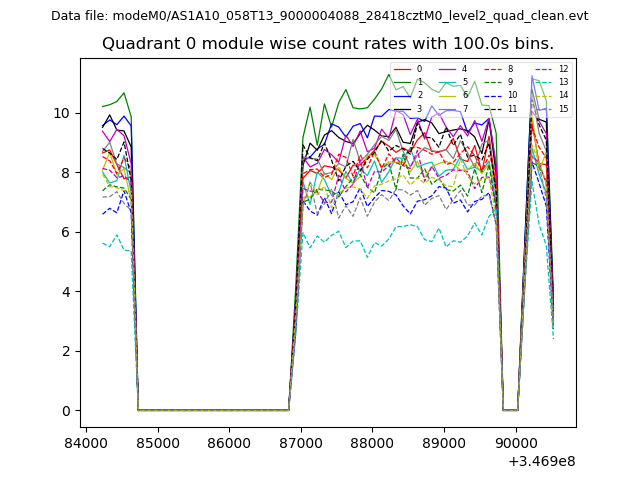 |
 |
| Module-wise count rates for Quadrant B Data is divided into 100 sec bins |
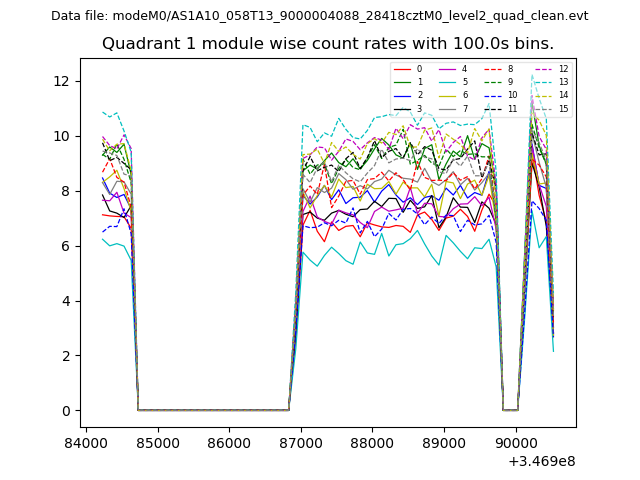 |
 |
| Module-wise count rates for Quadrant C Data is divided into 100 sec bins |
 |
 |
| Module-wise count rates for Quadrant D Data is divided into 100 sec bins |
 |
 |
| Parameter | Plot |
|---|---|
| CZT HV Monitor | 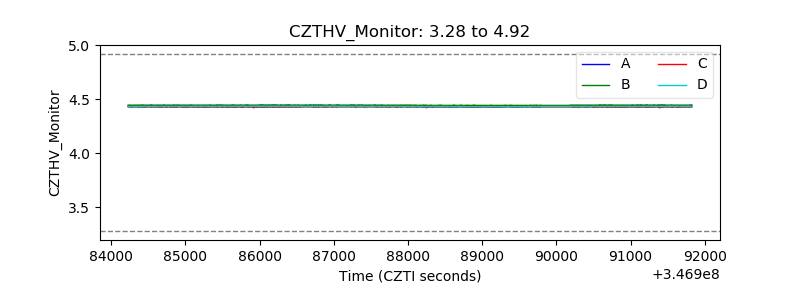 |
| D_VDD | 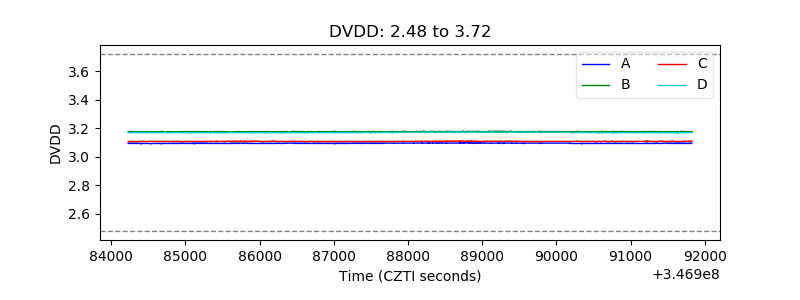 |
| Temperature 1 |  |
| Veto HV Monitor | 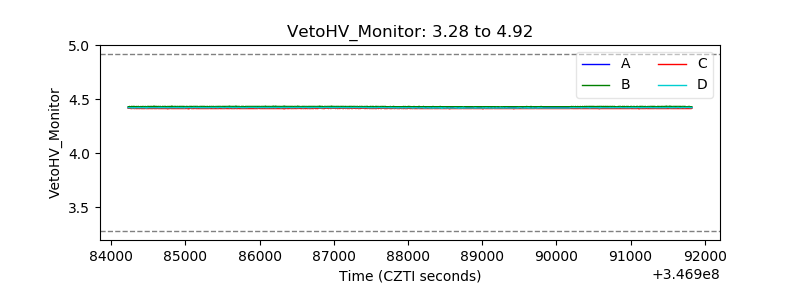 |
| Veto LLD | 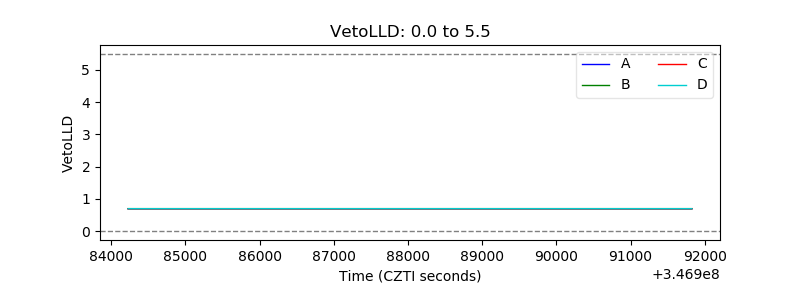 |
| Alpha Counter | 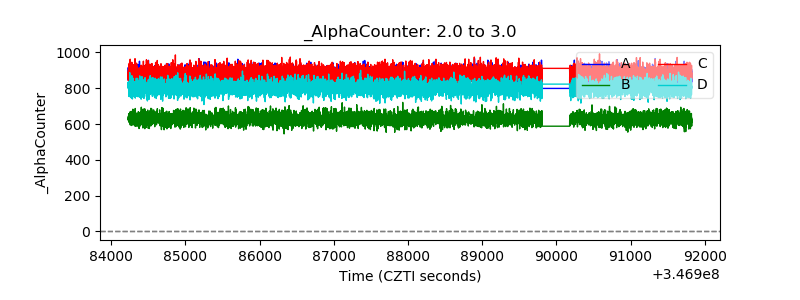 |
| _CPM_Rate | 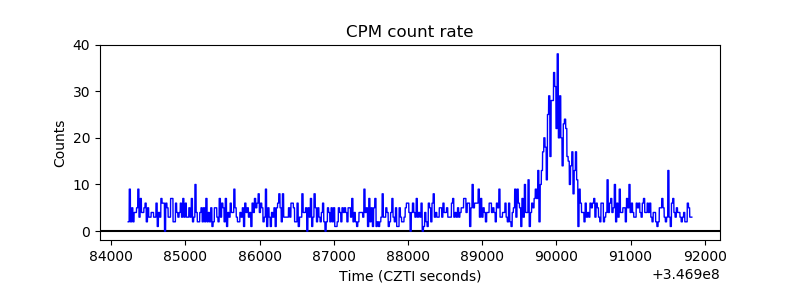 |
| CZT Counter |  |
| +2.5 Volts monitor |  |
| +5 Volts monitor |  |
| _ROLL_ROT |  |
| _Roll_DEC |  |
| _Roll_RA |  |
| Veto Counter |  |